Bitcoin Dominance
Bitcoin dominance is a metric that measures how much of the total cryptocurrency market value is made up by Bitcoin. In other words, it’s the percentage of the entire crypto market’s market capitalization that belongs to. For example, if the total crypto market is worth $1 trillion and Bitcoin’s market cap is $600 billion, Bitcoin’s dominance would be 60%. This number tells us Bitcoin’s “market share” relative to all other cryptocurrencies.
Bitcoin dominance can indicate which part of the market is leading. When dominance is high or rising, it means Bitcoin is relatively stronger – either Bitcoin’s price is going up faster than other coins, or altcoin prices are falling (or both). A rising Bitcoin dominance “indicates that Bitcoin is outperforming the rest of the market”. On the other hand, when dominance is low or falling, it suggests that alternative cryptocurrencies (altcoins) are collectively gaining value faster than Bitcoin, so the altcoins are “gaining ground”.
Originally, when Bitcoin was virtually the only crypto, its dominance was close to 100%. As thousands of altcoins emerged over the years, Bitcoin’s share of the market naturally dropped. Today, Bitcoin dominance typically fluctuates. It is one of the key metrics crypto enthusiasts watch to gauge market trends and sentiment.
Bitcoin Dominance
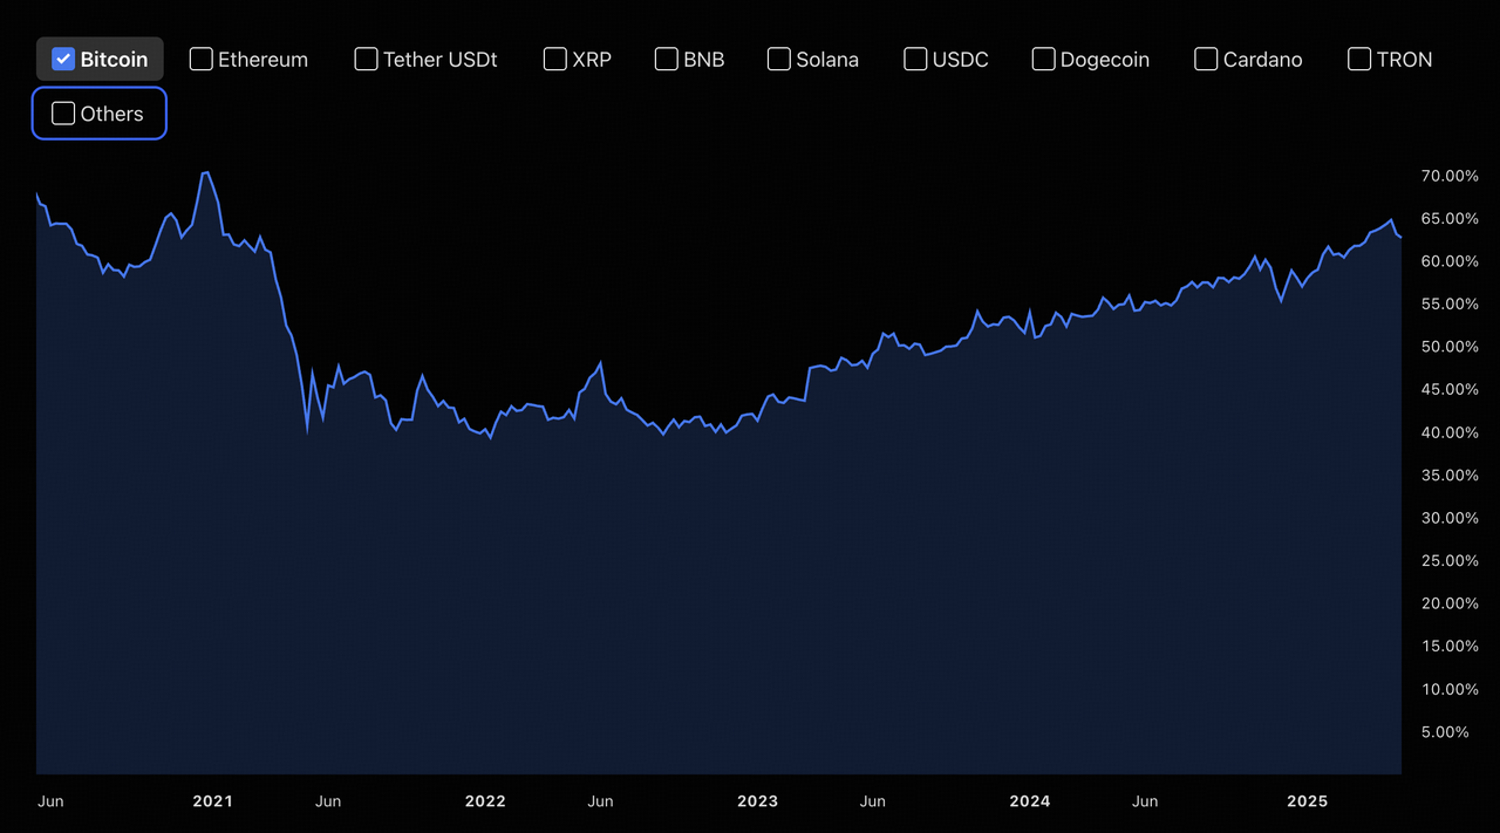
Source: https://www.tradingview.com/markets/cryptocurrencies/dominance/
Altcoin Season
Altcoin season is a period of time when altcoins (any cryptocurrency that isn’t Bitcoin) collectively outperform Bitcoin. In an altcoin season, you’ll see many altcoin prices shooting up more in percentage terms than Bitcoin’s price. Traders jokingly say it’s “altcoin season” when their non-Bitcoin coins are all rallying strongly.
Altcoin seasons often coincide with surging interest and money flowing into the crypto market beyond just Bitcoin. Typically, a major altcoin season might occur during a bull market when investors who made profits on Bitcoin start investing in smaller coins hoping for higher returns.
Bitcoin Dominance vs. Altcoin Performance
Bitcoin dominance is essentially a ratio reflecting Bitcoin’s strength relative to the rest of the market, so it has an inverse relationship with altcoin performance. Understanding this relationship can help you interpret what a change in dominance might mean for your portfolio:
When Bitcoin dominance is rising, it usually means Bitcoin’s price is doing better than the prices of most altcoins. Sometimes this happens because Bitcoin’s price is shooting up rapidly and altcoins are lagging behind. Other times, Bitcoin might be stable or dipping slightly, but altcoins are crashing even harder, in both cases, Bitcoin’s share of the total market grows.
When Bitcoin dominance is falling, it indicates altcoins are collectively performing better than Bitcoin. This scenario often corresponds to altcoin rallies, either Bitcoin’s price is going up slowly while many altcoins are rocketing upward, or Bitcoin is stagnant/declining and some altcoins still rise or fall less. A sharply falling dominance (especially dropping below certain thresholds like 50% or 40%) is a signature of an altcoin season in full swing. Historically, major altcoin booms saw Bitcoin dominance plunge.
It’s important to add context to this relationship: the state of the overall market matters. Not every decline in dominance is a “good” thing for altcoins in absolute terms – sometimes dominance can fall simply because Bitcoin is falling in price (which could mean everything is crashing).
The most exciting altcoin seasons are usually when Bitcoin is stable or rising slowly, and altcoins are rising much faster.
In that scenario, the total market is growing but altcoins are taking a bigger piece of the growth (dominance falls). On the other hand, if Bitcoin dominance drops during a market crash (Bitcoin drops, but perhaps some money goes into stablecoins, reducing Bitcoin’s share), that’s not a happy altseason – that’s just a broad bear market with Bitcoin dumping along with others.
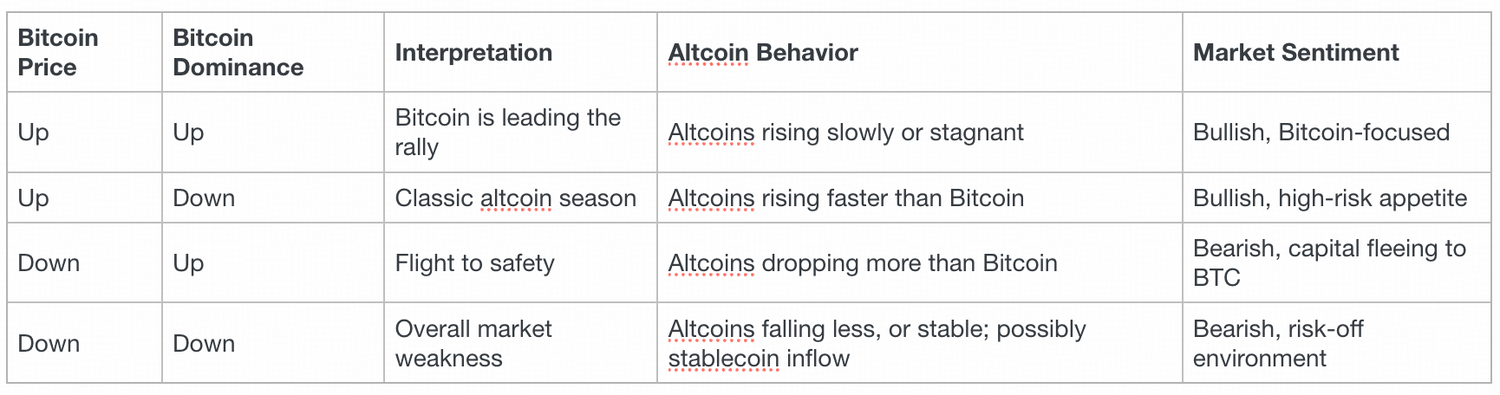
A helpful way to think about it is to consider what’s happening with Bitcoin’s price at the same time:
- If Bitcoin’s price is going up and dominance is going up – Bitcoin is leading the rally strongly; altcoins are likely rising more slowly or not at all. Bitcoin is the star of the show in that moment.
- If Bitcoin’s price is going up and dominance is going down – this is a classic altcoin season signal. It means while Bitcoin is climbing, altcoins are climbing even faster in percentage terms. Investors are taking on more risk to chase bigger gains in smaller coins.
- If Bitcoin’s price is going down and dominance is going up – this often means a market flight to safety. Bitcoin is dropping, but altcoins are dropping even more. Money may be moving from alts back into Bitcoin (or leaving crypto entirely), so Bitcoin’s share of the shrinking pie grows. This is typically bearish for altcoins.
- If Bitcoin’s price is going down and dominance is going down – that can mean Bitcoin is falling, but some altcoins are not falling as much or maybe stable (or people are moving into stablecoins). This could be a sign that the market is risk-off and even Bitcoin is being sold off heavily relative to other assets. Not a common scenario for “altseason” – it’s more an overall weak market.
Using Bitcoin Dominance to Spot Altcoin Season
Can Bitcoin dominance help predict or anticipate an altcoin season? Many traders think so. While it’s not a crystal ball, dominance trends and levels are used alongside price analysis to gauge when the market might be shifting focus between Bitcoin and altcoins.
One common strategy: watch for extremes or trend reversals in Bitcoin dominance. Altcoin seasons often kick off after Bitcoin dominance has reached a high peak and then starts to tip downward. The idea is that Bitcoin may have had a strong run (pushing dominance up), and then as it slows, investors rotate into altcoins, causing dominance to fall and altcoins to surge.
Another way traders use the metric is in real-time portfolio adjustment. Some will shift their holdings based on dominance trends. For example, if dominance has been steadily climbing and shows no sign of slowing, a trader might decide to keep a higher proportion of Bitcoin (since it’s leading the market) and be cautious with altcoins. On the flip side, if they observe dominance flattening out at a high level or starting to dip while Bitcoin’s price remains strong, they might start buying promising altcoins in anticipation of a possible altcoin season.
It’s also useful to monitor Ethereum’s performance relative to Bitcoin as a clue. Ethereum is the largest altcoin, and sometimes a big move in Ethereum (or a period where Ethereum outperforms Bitcoin) is a prelude to a broader altcoin rally.
A practical way to visualize this relationship is by looking at the ETH/BTC trading pair on a chart. This pair shows how many bitcoins one Ethereum token is worth. When the ETH/BTC chart is trending upward, it means Ethereum is gaining value compared to Bitcoin, signaling that capital is rotating into altcoins. Traders often interpret a breakout or uptrend in the ETH/BTC ratio as a leading signal that altcoins may begin to outperform broadly.
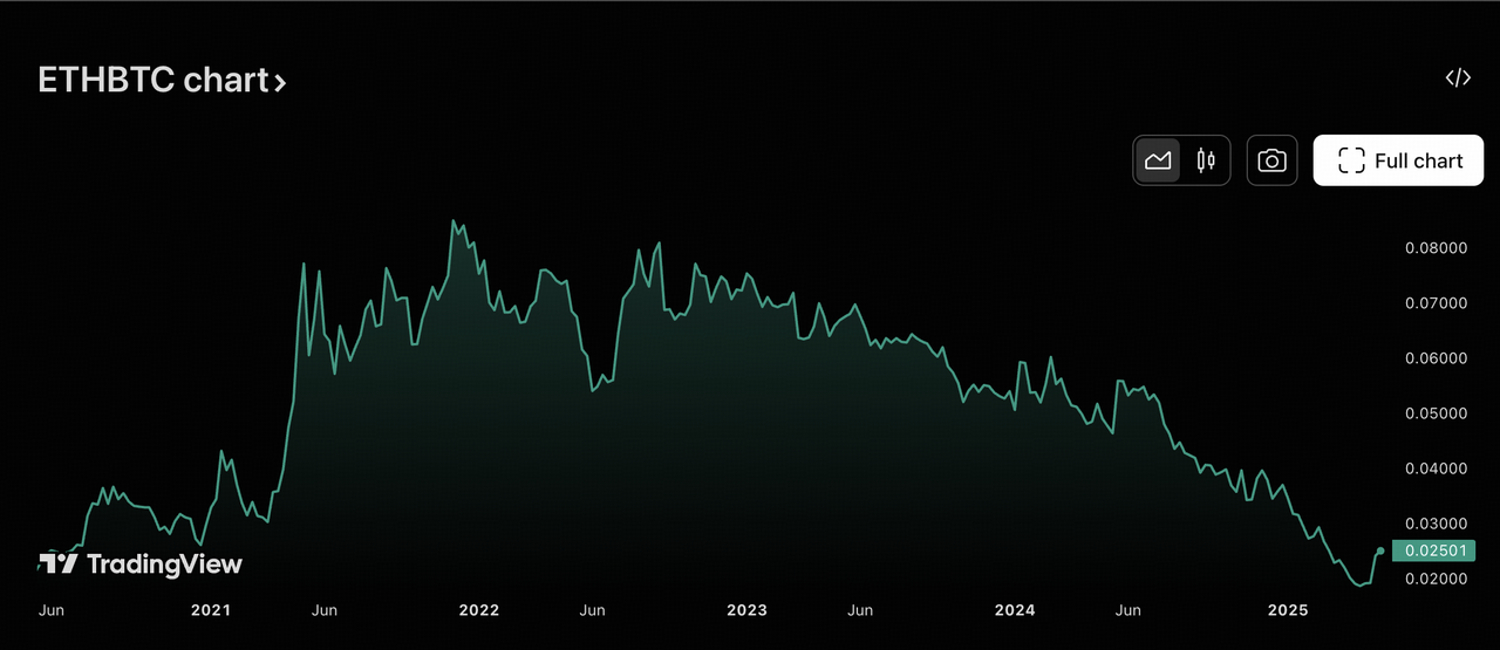
Source: https://www.tradingview.com/symbols/ETHBTC/?timeframe=60M
Bitcoin's Safe Haven Feature: Discovered From Bitcoin Dominance
Investors have been arguing for a long time about the safe-haven features of Bitcoin. Many people believe that Bitcoin is already "digital gold", but more people believe that it exhibits the same high volatility as risky assets, and has a significant correlation with the performance of the Nasdaq at many times, and should be regarded as a risky asset.
Most investors will be confused if we consider it from the perspective of price. But if we change our perspective—from the perspective of market share—and compare it with gold, it is not difficult to find that Bitcoin's safe-haven features are hidden here. Bitcoin's "safe-haven features" are not directly reflected in the price but in the changes in price and market share (that is, "Bitcoin Dominance").
In terms of features, Bitcoin and gold have the same property: "alternative payment system". When the legal currency system fails in certain circumstances (for example, war), gold is a common payment tool for international trade. Bitcoin is also playing this role to some extent. When investors lack confidence in the legal currency system, whether due to inflation or policy uncertainty, many investors will choose to transfer their liquidity from the legal currency system to the "alternative payment system", thereby driving the long-term price increase and market share of gold and Bitcoin (think about the performance of Bitcoin and gold in the past year).
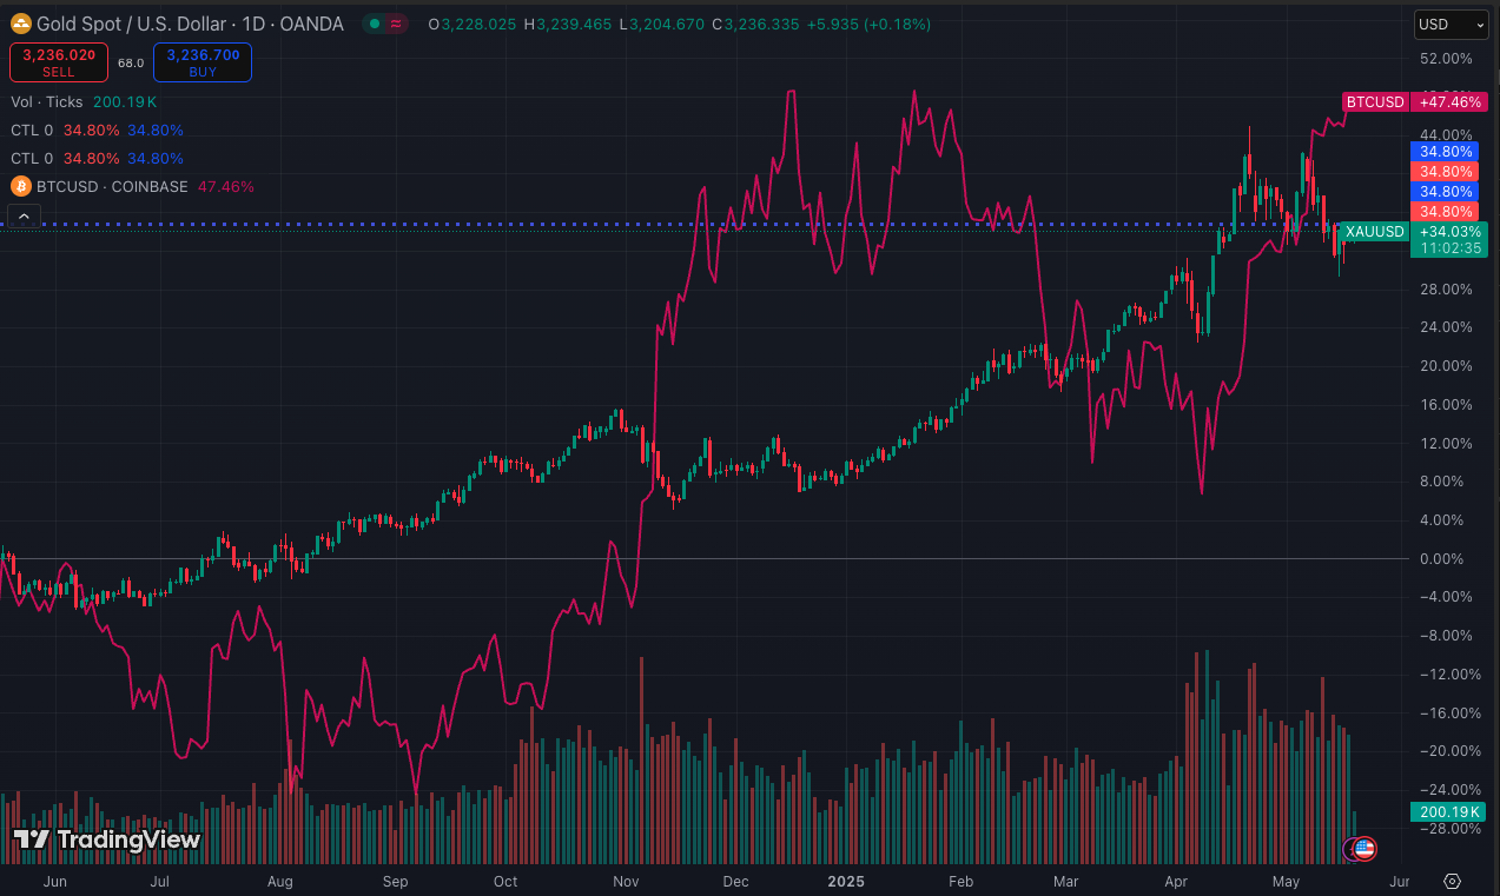
Source: Tradingview
From an investment perspective, gold and Bitcoin are the first stop for liquidity to enter the interest rate cut cycle, and the last stop for liquidity to withdraw in the interest rate hike cycle. When liquidity begins to be released but the financing cost is relatively high, investors tend to invest in assets with better liquidity for risk management reasons, and gold, Bitcoin and index futures are good targets, which leads to an increase in Bitcoin's market share. When liquidity begins to shrink, investors often choose to sell equity assets first, and sell Bitcoin and gold at the end, which leads to an increase in the market share of Bitcoin and gold in the era of shrinking liquidity.
In summary, we can see how Bitcoin's safe-haven features are reflected:
- When investors lack confidence in fiat currencies, Bitcoin dominance rises, reflecting its safe-haven features.
- When investors enter the market due to liquidity release, Bitcoin's high liquidity and high potential returns attract investors' preferences, and Bitcoin dominance rises, reflecting its safe-haven features.
- When investors withdraw liquidity from the market due to various factors, Bitcoin is often the last to be sold, so it performs relatively more strongly, and Bitcoin dominance rises, reflecting its safe-haven features.
In addition, if we look at it from the perspective of "volatility of volatility", Bitcoin's safe-haven features will be even more apparent. "Volatility of volatility", or "sensitivity", is an indicator of the magnitude of changes in the volatility level of an asset when an event occurs. In the plunge caused by tariffs in April 2025, the VIX index rose rapidly from around 20 to around 60, while Bitcoin's volatility index (DVOL) only rose from 45 to around 63, showing that Bitcoin is relatively less sensitive than the stock market - and this is an important feature of its safe-haven features.
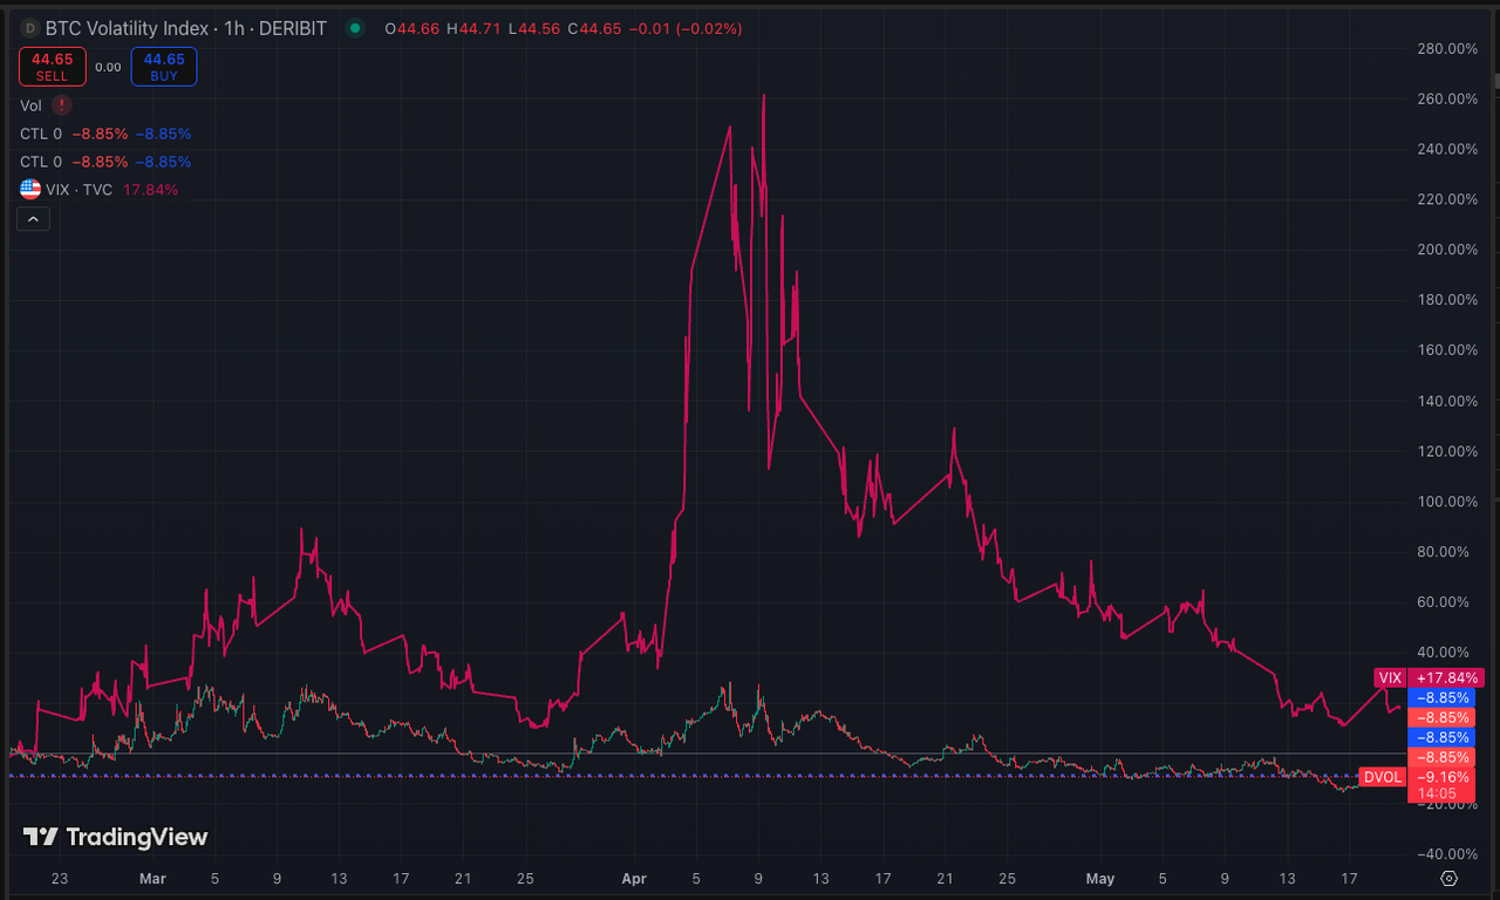
Source: Tradingview
So why does Bitcoin perform in sync with the Nasdaq at certain moments, but differently from gold? This may be due to the dominant position that leveraged trading occupies in Bitcoin trading. Leverage for Bitcoin and US stocks is easy to obtain, while leverage for gold is relatively difficult. In an era of rampant liquidity or significant speculative sentiment, investors tend to leverage Bitcoin and stock exposure through derivatives, and driven by leverage, both have deviated from fundamentals to a certain extent and performed in sync. However, as leverage is liquidated and investors become rational, the different fundamentals of Bitcoin and stocks dominate, so Bitcoin gradually stabilises and exhibits safe-haven features. Bitcoin leverage trading brings risks, while Bitcoin itself brings safe-haven features.