
Many people who hold bitcoin also own a famous AI software stock, often because both felt like bets on the same future. On a calm week the two sit in the portfolio without much thought. When both drop on the same afternoon, though, the obvious question is whether they are really one trade wearing two names.
Most of what a search turns up on that pairing is news from 2021, when the company talked about taking bitcoin as payment and then bought gold bars. Those stories describe a treasury decision, and they say little about whether the share price and the coin have risen and fallen on the same days since.
Traders answer that with the correlation coefficient. A daily return is the percentage change in a price from one daily close to the next, and the coefficient compares the daily returns of two assets on matching dates. Read over the latest month or quarter as well as a full year, it shows how strong the link has been and how much it has changed.
Palantir Technologies (PLTR) is the company behind that stock. Perpetual contracts are futures that never expire and follow the price of the asset behind them. BloFin lists a contract on its share price, the PLTRUSDT Perpetual, which prints a price every day of the week, as bitcoin's perpetual on the same exchange does. Lined up on those contracts and on Nasdaq's closes, Palantir and bitcoin have moved together loosely and positively through 2026.
What is the correlation between Palantir stock and bitcoin?
The correlation between Palantir stock and bitcoin is positive but loose. On BloFin's PLTRUSDT and BTCUSDT perpetuals, daily returns from February 10 to November 9, 2026 scored 0.40 (source: BloFin PLTRUSDT market data, BloFin BTCUSDT market data). On Nasdaq closes, with bitcoin priced at the moment of each close, the same months scored 0.33 (source: Nasdaq PLTR historical data, BloFin BTCUSDT market data).
The coefficient is a number between -1 and +1 that sums up how closely two sets of daily changes have lined up in the past. At +1, every move in one came with a move of the same direction and the same relative size in the other. At -1, each move came with its opposite, and near 0, one asset's day told you almost nothing about the other's.
Because the inputs are percentage changes, a share near $170 and a coin near $74,000 can be compared directly. Traders who pair crypto assets use the same measure for correlation trading, where the coefficient shows how closely two positions have tended to move.
R-squared is the share of one asset's daily variation that a straight-line fit to the other accounts for, and it equals the correlation squared. On the perpetuals, 0.40 squared is about 0.16, so roughly a sixth of PLTRUSDT's day-to-day movement in 2026 lined up with bitcoin's. The rest belonged to Palantir's own results, deals and swings, the story told by Palantir's stock price history.
A correlation is built entirely from days that have already happened, so it describes a relationship and predicts nothing. It also ignores how far each asset moved, since two assets can score highly while one swings twice as far as the other. That is why price volatility gets measured as a separate figure. To measure volatility, analysts take the standard deviation of daily returns, which shows how far a typical day's move sits from the average. Scaled up to a yearly figure, it becomes annualized volatility.
Palantir and bitcoin in November 2026
Bitcoin's slide and Palantir's results week landed in the same days of November 2026. BTCUSDT's daily close on September 21 was 86,590 USDT, its highest close since the PLTR perpetual listed. By the November 10 close it was at 73,764.2 USDT, a fall of 14.81% (source: BloFin BTCUSDT market data). Palantir, reporting on November 2, fell faster over its own week.
On November 10, bitcoin dropped below $74,000 after October's consumer price index rose 0.4% against a forecast of 0.3%. The Block reported that core inflation came in at 0.3% against 0.2%, which revived worries about the Federal Reserve's path for interest rates (source: The Block).
Palantir released its third-quarter results on November 2 and hosted a webcast that day at 5PM ET, or 10PM Coordinated Universal Time (UTC) (source: Palantir third-quarter 2026 results release). Its share closed at $184.11 on Friday, October 30 and at $160.38 on Friday, November 6, a fall of 12.89% across the report week (source: Nasdaq PLTR historical data).
Bitcoin, priced on BTCUSDT at each of those Nasdaq closes at 4PM ET (9PM UTC, or 8PM UTC in US summer time), fell only 1.33% over the same days (source: Nasdaq PLTR historical data, BloFin BTCUSDT market data). On the night of the report it barely stirred, with hourly closes between 76,700.1 and 77,104.5 USDT from 4PM to 10PM ET (9PM UTC to 3AM UTC). The next day Palantir slipped 1.65% to $175.40, while bitcoin rose 1.38% at the close (source: Nasdaq PLTR historical data, BloFin BTCUSDT market data).
The day the two fell hardest together that month was Thursday, November 5. Palantir dropped 9.73% to $154.99 and bitcoin 4.89% at the close. Strategy (MSTR) lost 9.29% and Coinbase (COIN) 9.69% (source: Nasdaq PLTR historical data, Nasdaq MSTR historical data, Nasdaq COIN historical data, BloFin BTCUSDT market data). 24/7 Wall St. tied the drop to a wider retreat from risk across stocks that day (source: 24/7 Wall St.).
They split again over the next two sessions, as Palantir rose 3.48% on November 6 and 5.50% on November 9 while bitcoin fell 0.39% and 1.36% at those closes. One week held both kinds of day that the correlation adds together (source: Nasdaq PLTR historical data, BloFin BTCUSDT market data).
How the Palantir and bitcoin correlation is measured
The Palantir and bitcoin correlation can be measured on two time bases, and the two never belong in one figure. One pairs the UTC-day closes of BloFin's PLTRUSDT and BTCUSDT perpetuals, weekends included. The other pairs Nasdaq's official closes for Palantir with bitcoin's price at that same moment, taken from the hourly candles of BloFin's BTCUSDT Perpetual.
A daily candle records an asset's prices over one UTC day, ending with its close. BloFin lists both perpetuals on one exchange, and both print a price every day, so their daily candles line up one for one. The series runs from PLTRUSDT's listing on February 9, 2026 to the last full UTC day, November 9 (source: BloFin PLTRUSDT market data). That gives 274 closes and 273 daily returns, 78 of them on Saturdays and Sundays. These are perpetual prices in USDT, a separate series from Nasdaq's share price and from any bitcoin index.
Weekend days on the stock contract are quiet, because the share it follows is shut. The average size of a PLTRUSDT weekend day's move was 0.50%, against 2.56% on a weekday, while bitcoin averaged 0.91% and 1.72% (source: BloFin PLTRUSDT market data, BloFin BTCUSDT market data). Taken separately over that February 10 to November 9 window, the weekday returns scored 0.41 with bitcoin and the weekend returns 0.35.
The Nasdaq version uses the share's official close and the closing price of the BTCUSDT hourly candle that ends at the 4PM ET close. That is 9PM UTC, or 8PM UTC in US summer time. On early-close days the close is 1PM ET (6PM UTC, or 5PM UTC in US summer time). Weekends drop out, so each Monday return runs from Friday's close and carries bitcoin's whole weekend move. Pricing bitcoin at 12AM UTC instead, which is 7PM ET in winter and 8PM ET in US summer time, would catch it three or four hours after the share's close.
From February 9 to November 10, 2026, the Nasdaq method gives 190 matched pairs of returns. Each series' volatility is annualized with its own day count, by multiplying the daily standard deviation by the square root of 365 for the perpetuals and of 252 for Nasdaq sessions.
Both perpetuals sit on BloFin's futures market. A Palantir position on the PLTRUSDT trading page and a bitcoin position on BTCUSDT are held in the same futures account and priced on the same days.

Rolling 30-day and 90-day correlation in 2026
Rolling correlation recalculates the figure every day over the latest 30 or 90 days, so it shows how the link has changed through 2026. On the perpetuals, the 30-day reading ranged from 0.01 on August 3 to 0.67 on July 1 between March 11 and November 9. It stood at 0.50 on November 9 (source: BloFin PLTRUSDT market data, BloFin BTCUSDT market data).
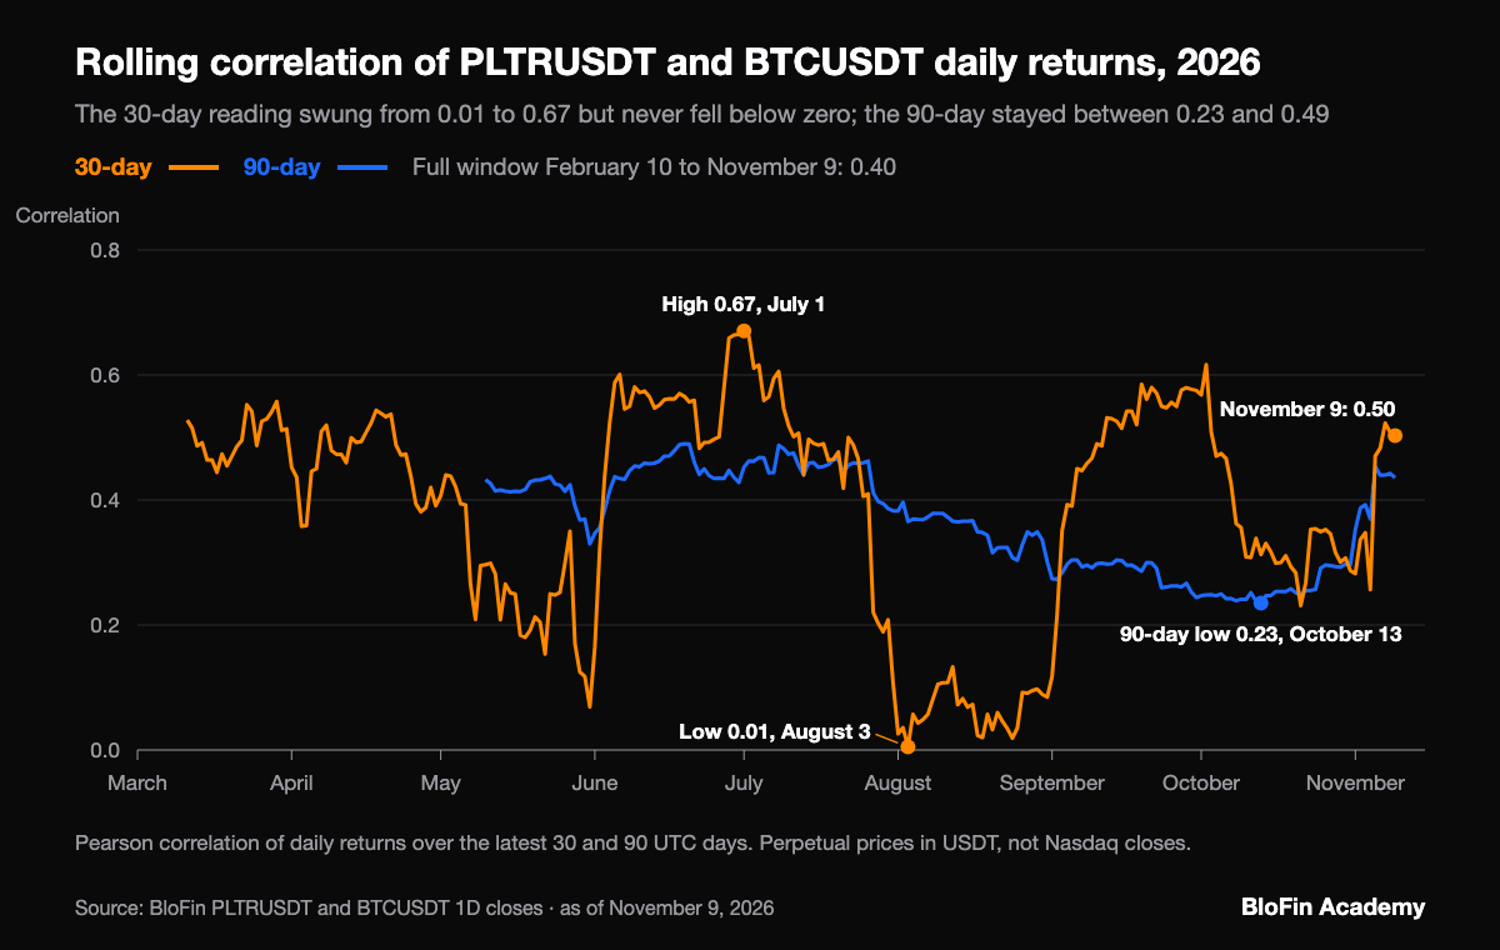
Across its 244 daily readings from March 11 to November 9, the 30-day figure stayed above zero every time, with a median of 0.45. It sat above 0.5 on 32.4% of days. Its swings were large and quick. It went from 0.66 at the end of June to 0.11 at the end of July, then 0.08 at the end of August and 0.58 at the end of September (source: BloFin PLTRUSDT market data, BloFin BTCUSDT market data).
The 90-day reading starts on May 10, once 90 returns exist, and from then to November 9 it moved in a much narrower band. Its low was 0.23 on October 13 and its high 0.49 on June 19, and it read 0.44 on November 9. A longer window smooths the swings, so the two lines together describe a link that has been steady in sign and unsteady in strength (source: BloFin PLTRUSDT market data, BloFin BTCUSDT market data).
Calendar months show the same pattern from another angle. June scored 0.66, as PLTRUSDT fell 28.7% and BTCUSDT 20.4% over the month. August scored 0.09 even though both rose, PLTRUSDT by 51.7% and BTCUSDT by 25.0%. May scored 0.11, with PLTRUSDT up 16.7% and BTCUSDT down 3.5% (source: BloFin PLTRUSDT market data, BloFin BTCUSDT market data).
August shows what the coefficient leaves out, because rising together over a month is a matter of trend. Correlation counts how well the daily moves matched, so a strong month for both assets can still score close to zero.
Palantir and bitcoin returns and volatility
Palantir has moved further than bitcoin in 2026, and it has gained more. On the perpetuals, PLTRUSDT ran at 58.1% annualized volatility from February 9 to November 9, against 39.4% for BTCUSDT (source: BloFin PLTRUSDT market data, BloFin BTCUSDT market data). Over the same days, PLTRUSDT rose 18.20% from 143.81 to 169.99 USDT, while BTCUSDT rose 7.45%.
In daily terms, the standard deviation of returns, a typical day's move either way, was 3.04% for PLTRUSDT and 2.06% for BTCUSDT. At 1x, before fees and funding, $1,000 in each at the February 9 close would have been worth $1,182.05 in PLTRUSDT at the November 9 close, against $1,074.55 in BTCUSDT (source: BloFin PLTRUSDT market data, BloFin BTCUSDT market data).
Nasdaq's closes tell a similar story on the other time base. Over the 190 sessions from February 9 to November 10, Palantir's annualized volatility was 62.5% against 39.1% for bitcoin at the Nasdaq close (source: Nasdaq PLTR historical data, BloFin BTCUSDT market data). The share rose 18.13% from $142.91 to $168.82, while bitcoin gained 4.29%.
Beta is the average move in one asset for each 1% move in another, so it joins the size of the moves to the strength of the link. PLTRUSDT's beta to BTCUSDT from February 10 to November 9 was 0.59. On average, a 1% bitcoin day came with a 0.59% PLTRUSDT move in the same direction, and most of each day's PLTRUSDT move came from elsewhere (source: BloFin PLTRUSDT market data, BloFin BTCUSDT market data).
Palantir priced in bitcoin
Dividing the PLTRUSDT close by the BTCUSDT close prices one Palantir share in bitcoin. One satoshi is one hundred-millionth of a bitcoin. A Palantir share was worth 0.002052 BTC on February 9, or 205,157 satoshis (source: BloFin PLTRUSDT market data, BloFin BTCUSDT market data). On November 9 it was worth 225,681 satoshis, a gain of 10.00% measured in bitcoin.
Between February 9 and November 9, the bitcoin price of a Palantir share ranged from 164,209 satoshis on May 6 to 281,093 on August 13. For anyone who counts wealth in bitcoin, that line shows whether holding Palantir instead added or lost ground (source: BloFin PLTRUSDT market data, BloFin BTCUSDT market data).
When Palantir and bitcoin fall together
Palantir and bitcoin have fallen hard together on a handful of days in 2026. Across the 190 Nasdaq sessions from February 9 to November 10, Palantir and bitcoin at the Nasdaq close both fell 3% or more on eight (source: Nasdaq PLTR historical data, BloFin BTCUSDT market data).
Session (2026) | Bitcoin, % change at the Nasdaq close | Palantir, % change at the Nasdaq close |
|---|---|---|
February 12 | -3.13% | -4.83% |
February 23 | -4.85% | -3.43% |
March 26 | -3.37% | -4.78% |
March 27 | -3.61% | -3.05% |
June 2 | -5.99% | -5.28% |
June 5 | -5.23% | -4.35% |
October 30 | -4.84% | -6.27% |
November 5 | -4.89% | -9.73% |
Each of bitcoin's five worst sessions in that window was also a fall of 3% or more for Palantir. Bitcoin's heaviest was June 2, the only session on which both fell more than 5%. The most lopsided was November 5, when Palantir fell about twice as far as bitcoin (source: Nasdaq PLTR historical data, BloFin BTCUSDT market data).
Palantir's own worst days came mostly from somewhere else. Of its five worst sessions in the same window, November 5 was the only one on which bitcoin fell more than 1.5%. On April 9, Palantir dropped 7.30% while bitcoin rose 1.09%. On June 22 it dropped 6.98% while bitcoin gained 2.39% (source: Nasdaq PLTR historical data, BloFin BTCUSDT market data).
Sharp moves in opposite directions were rarer still. April 8 was the only session in that window on which both moved 3% or more the opposite way, with bitcoin up 3.36% and Palantir down 6.20%. So on bitcoin's worst days Palantir has tended to fall too. Many of Palantir's sell-offs, though, have come with bitcoin steady or higher (source: Nasdaq PLTR historical data, BloFin BTCUSDT market data).
When Palantir and bitcoin went separate ways
Palantir and bitcoin have also spent whole months moving apart while their daily correlation stayed positive. From December 17, 2024 to April 8, 2025, Palantir's Nasdaq close rose 3.9%, from $74.39 to $77.32. Bitcoin at the same Nasdaq closes fell 28.0% (source: Nasdaq PLTR historical data, BloFin BTCUSDT market data).
The weeks just before had looked like one trade. From the close on November 5, 2024, the day of the US presidential election, to December 17, 2024, Palantir rose 45.5% from $51.13 to $74.39 and bitcoin 53.8%. Strategy gained 69.6% and Coinbase 60.7% over the same sessions (source: Nasdaq PLTR historical data, Nasdaq MSTR historical data, Nasdaq COIN historical data, BloFin BTCUSDT market data).
Over the split that followed, Strategy fell 38.4% and Coinbase 51.4%, staying with bitcoin on the way down while Palantir held its level. In the middle of that period, Palantir climbed 48.8% from $83.74 on February 3, 2025 to $124.62 on February 18, its highest close of the first quarter of 2025. Bitcoin fell 6.9% over those two weeks (source: Nasdaq PLTR historical data, Nasdaq MSTR historical data, Nasdaq COIN historical data, BloFin BTCUSDT market data).
The climb then reversed, and from February 18 to April 8, 2025, Palantir fell 38.0%, against 18.4% for bitcoin. On Nasdaq closes, the rolling 63-session correlation between the two fell to 0.05 on February 20, 2025, near the peak of that run. That was the lowest of its 444 readings from February 5, 2025 to November 10, 2026, when it read 0.45 (source: Nasdaq PLTR historical data, BloFin BTCUSDT market data).
Correlation is calculated day by day, so it can stay positive while two prices drift far apart over months. Over the two years from November 1, 2024 to November 10, 2026, Palantir's share rose 302.72%, from $41.92 to $168.82. Bitcoin at the close gained 6.50% (source: Nasdaq PLTR historical data, BloFin BTCUSDT market data).
Palantir, Strategy and Coinbase against bitcoin
Strategy and Coinbase show what a strong link to bitcoin looks like. Over the same 190 Nasdaq sessions from February 9 to November 10, 2026, the correlation with bitcoin at each Nasdaq close was 0.84 for Strategy and 0.79 for Coinbase. Palantir scored 0.33 (source: Nasdaq PLTR historical data, Nasdaq MSTR historical data, Nasdaq COIN historical data, BloFin BTCUSDT market data).
Squared, those figures mean bitcoin's daily moves lined up with about 71% of the daily variation in Strategy and 62% in Coinbase, against about 11% in Palantir. On November 5, 24/7 Wall St. wrote that leverage magnifies bitcoin's swings for Strategy (source: 24/7 Wall St.).
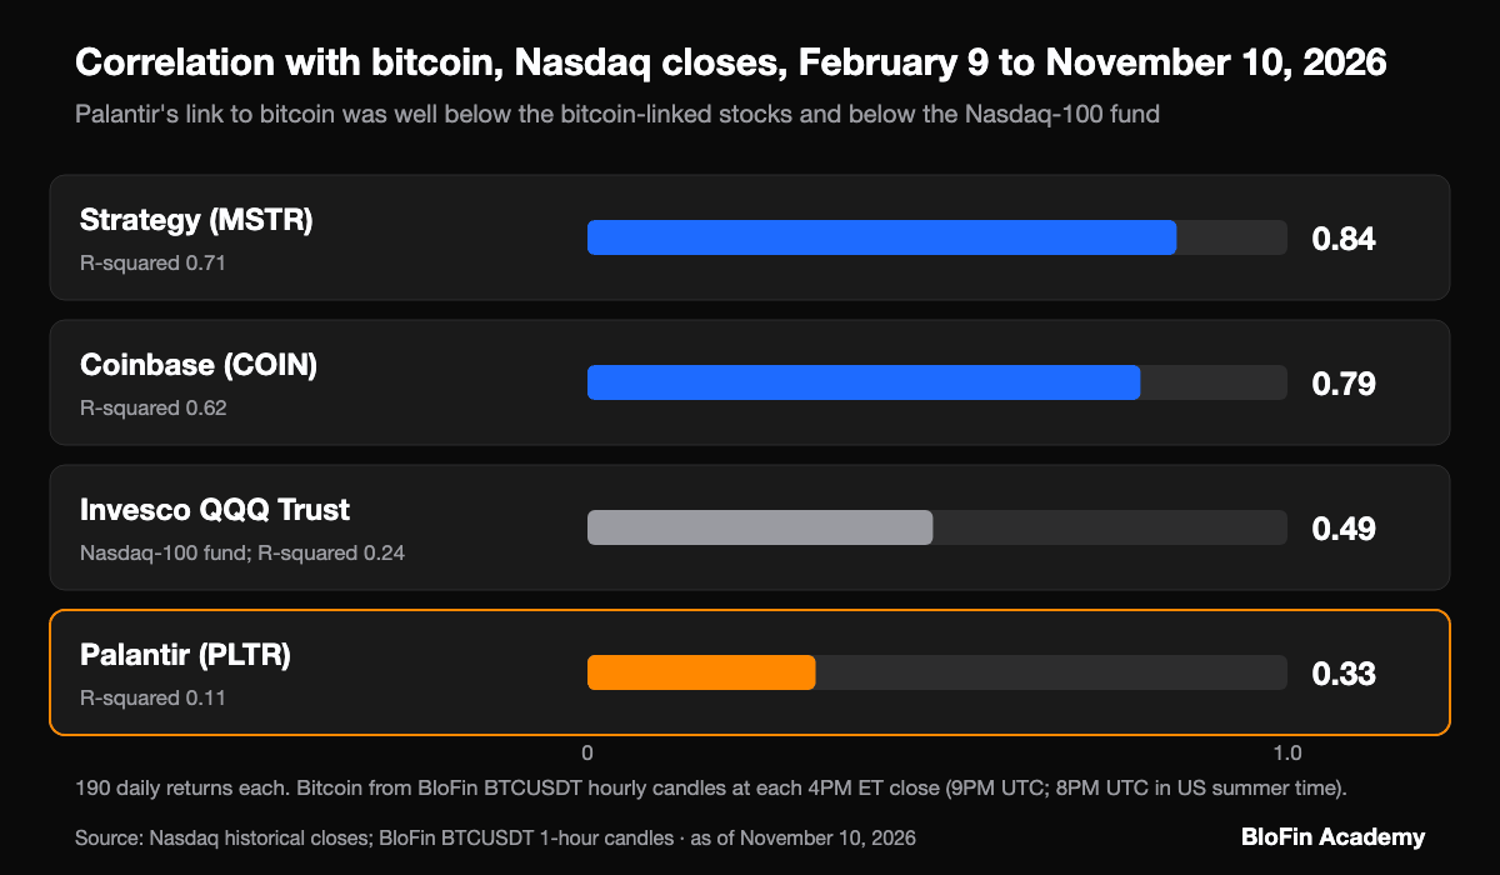
The Nasdaq-100 index fund Invesco QQQ Trust scored 0.49 with bitcoin over those sessions (source: Nasdaq QQQ historical data, BloFin BTCUSDT market data). Over those months, bitcoin's tie to the broad tech market ran stronger than its tie to Palantir in particular.
November 4 showed the gap between the two groups in a single session. Bitcoin rose 2.91% at the close, Strategy 5.09% and Coinbase 4.16%. Palantir fell 2.11% to $171.70 as its report week went on (source: Nasdaq PLTR historical data, Nasdaq MSTR historical data, Nasdaq COIN historical data, BloFin BTCUSDT market data).
BloFin lists perpetuals on both stocks, the MSTRUSDT Perpetual and the COINUSDT Perpetual, next to PLTRUSDT. All three listed on February 9, 2026 with the same 20x maximum leverage (source: BloFin market data).
Does Palantir stock move with AI crypto tokens?
Palantir stock has moved only weakly with AI-linked crypto tokens. On BloFin's perpetuals from February 10 to November 9, 2026, PLTRUSDT's daily correlation was 0.22 with TAO, 0.22 with FET, 0.19 with RENDER and 0.18 with VIRTUAL (source: BloFin market data). Each of those tokens scored above 0.6 with BTCUSDT over the same days.
Those four are AI-linked crypto tokens listed on BloFin. An equal-weight basket of their daily returns scored 0.24 with PLTRUSDT and 0.73 with BTCUSDT. The tokens also swung harder, with annualized volatility between 73.2% and 96.9%, against 58.1% for PLTRUSDT (source: BloFin market data).
Most of that 0.24 runs through bitcoin, as a simple test shows: take out the part of each daily move that a straight-line fit to BTCUSDT accounts for. What remains of PLTRUSDT and of the basket scored -0.08, close to no link at all (source: BloFin market data).
Sharing the AI label in the news did little, over these months, to make the share and the tokens move together on their own. What the four tokens had in common with Palantir was mostly their common tie to bitcoin.
Does Palantir own bitcoin?
Palantir is a software company, and its stock is a share traded on Nasdaq, not a cryptocurrency. Its SEC filings show no bitcoin holding. A full-text search of its filings on SEC EDGAR, which covers its November 3, 2026 quarterly report, returns no match for "bitcoin", "crypto", "cryptocurrency" or "digital asset" (source: SEC EDGAR full-text search).
Bitcoin came up on the call for the first quarter of 2021. Chief financial officer David Glazer said holding bitcoin on the balance sheet was "definitely on the table" (source: CNBC). CNBC also reported that Palantir already accepted bitcoin as payment from customers.
In August 2021, Bloomberg reported that Palantir had bought gold bars as a hedge, and a spokeswoman said that no customer had yet paid in bitcoin (source: Bloomberg, via WealthManagement.com).
Its 10-Q for the second quarter of 2021 disclosed that in August 2021 it bought $50.7 million of 100-ounce gold bars. They were held at a secure third-party facility in the northeastern United States (source: SEC, Palantir 10-Q for Q2 2021). The next quarterly report put the total bought at $50.9 million (source: SEC, Palantir 10-Q for Q3 2021).
The bars stayed on the books for under two years. Palantir sold all of them in the three months to March 31, 2023 for $51.1 million and recorded an immaterial realized gain (source: SEC, Palantir 10-Q for Q1 2023).
So Palantir's share price has no line to bitcoin through the balance sheet, which sets it apart from Strategy. The link the market shows runs through trading in the two assets, with no bitcoin on Palantir's books behind it.
Holding Palantir and bitcoin on one venue
Holding both has meant holding two assets that usually lean the same way. PLTRUSDT moved the same way as BTCUSDT on 176 of the 272 days on which both closes changed, from February 10 to November 9, 2026, or 64.7%. On bitcoin's five worst Nasdaq sessions from February 9 to November 10, Palantir fell 3% or more each time (source: BloFin PLTRUSDT market data, BloFin BTCUSDT market data, Nasdaq PLTR historical data).
In cross margin, positions draw on one futures balance. A shared fall like November 5 then hits that balance from both sides at once, while a split like April 9 leaves one position offsetting part of the other.
A correlation near 0.40 is too loose for one position to cancel the other reliably. It is also too positive for the pair to give much portfolio diversification on a bad day. A hedge with the PLTRUSDT Perpetual is a separate technique, sized from the shares being protected.
Portfolio correlation works the same way across a whole crypto account, measuring how much the holdings overlap. A figure that wandered as far as PLTRUSDT's 30-day reading against BTCUSDT did from March 11 to November 9 reads quite differently depending on the window chosen.
Looking to trade Palantir? To get started, you'll need to first create a BloFin account, fund your account with cryptocurrency, and go to the PLTRUSDT Perpetual trading page.

Frequently asked questions
Is Palantir stock more correlated with bitcoin than Nvidia stock?
Slightly less, over 2026. From February 9 to November 10, 2026, Nvidia stock had a daily correlation of 0.36 with bitcoin at each Nasdaq close, against 0.33 for Palantir (source: Nasdaq NVDA historical data, BloFin BTCUSDT market data). Nvidia's annualized volatility over those sessions, 39.6%, was close to bitcoin's 39.1%.
What was the correlation between Palantir and bitcoin in 2025?
It was 0.33, in a year when the two went opposite ways. From the December 31, 2024 close to the December 31, 2025 close, Palantir's daily Nasdaq returns scored 0.33 with bitcoin at each Nasdaq close (source: Nasdaq PLTR historical data, BloFin BTCUSDT market data). Over that year Palantir rose 135.0% and bitcoin fell 6.3%.
Does Palantir use blockchain?
Palantir pitched its software to crypto companies in 2021. On the call for the third quarter of 2021, chief operating officer Shyam Sankar said the company was excited about "Foundry for crypto". CoinDesk reported that Palantir was bringing its anti-money-laundering and know-your-customer expertise to crypto clients, who were welcome to pay in crypto (source: CoinDesk). A full-text search of its annual and quarterly reports finds no mention of blockchain (source: SEC EDGAR full-text search).
How do you measure Palantir's correlation with bitcoin in a spreadsheet?
List both closing prices on matching dates and turn each column into daily returns: today's close divided by yesterday's, minus one. Then apply the CORREL function to the two return columns. Microsoft describes CORREL as returning the correlation coefficient of two cell ranges (source: Microsoft Support). Prices themselves are the wrong input, because two rising prices can correlate strongly when their daily moves barely match.
Does Palantir stock go up when bitcoin goes up?
A little more often than not. On the 92 Nasdaq sessions from February 9 to November 10, 2026 when bitcoin rose at the Nasdaq close, Palantir rose on 58, or 63%. On the 98 sessions when bitcoin fell, Palantir fell on 60, or 61% (source: Nasdaq PLTR historical data, BloFin BTCUSDT market data).
Researched and written by the BloFin Academy editorial team with AI-assisted drafting. All facts independently verified. Primary sources include Palantir's quarterly reports for 2021 and 2023, its third-quarter 2026 results release and SEC EDGAR full-text search, Nasdaq's daily price tables for Palantir, Strategy, Coinbase, the Invesco QQQ Trust and Nvidia, Microsoft Support, and reporting from The Block, 24/7 Wall St., CNBC, Bloomberg and CoinDesk. BloFin facts come from its instrument list and its own PLTRUSDT, BTCUSDT and token market data, including hourly BTCUSDT candles, current as of November 11, 2026.
Nothing in this article constitutes financial advice, and nothing in it is a recommendation to buy, sell or hold Palantir in any form. A correlation describes how two prices moved in the past and can change quickly. PLTRUSDT's 30-day reading against BTCUSDT ranged from 0.01 to 0.67 between March 11 and November 9, 2026, and the two fell sharply on the same days several times. Past performance does not indicate future results. Do your own research and consider your risk tolerance before you trade on BloFin.