
When the prices of food, fuel and rent keep climbing, people start looking for something that holds its value while their cash buys less each month. Precious metals are usually the first answer they hear, because a coin in a drawer feels safer than money that loses buying power every year.
Silver borrows that reputation from gold. Yet more than half of the silver bought each year goes into factories, so its price also follows the business cycle.
The way to answer the question is to measure silver against consumer prices in the two inflation episodes people quote most, on one price series, and then see how closely the two moved in between. Done that way, the answer splits. Silver beat inflation from 1973 to 1982, fell behind it in 2021-23, and has moved with it only loosely in the decades between.
On BloFin, the price of silver, coded XAG, is open to trading through the XAGUSDT Perpetual, where profit and loss are paid in USDT and no metal changes hands at any point. Silver's past record in inflation helps you judge the hedge stories you hear. A leveraged position, though, lives on daily moves, while a hedge is judged over years.
Is silver an inflation hedge?
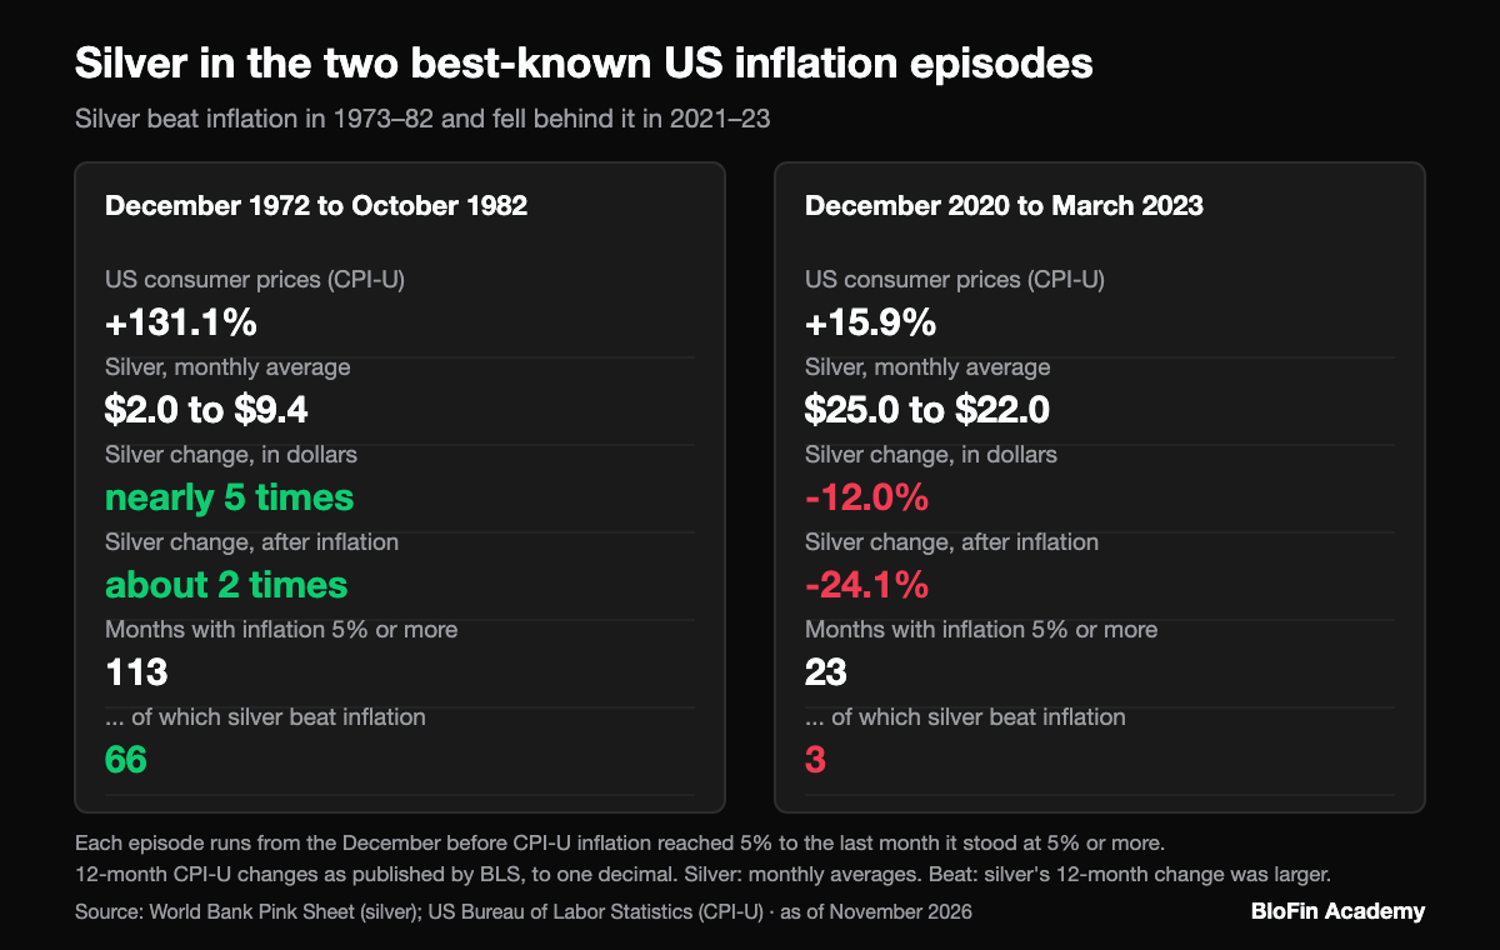
Silver is an inflation hedge only some of the time. From December 1972 to October 1982, as US consumer prices rose 131.1%, its monthly average about doubled after inflation. From December 2020 to March 2023, its monthly average fell 12.0% while consumer prices rose 15.9% (source: World Bank Pink Sheet, BLS CPI-U). Since 1971, its yearly moves have followed inflation only weakly.
The World Bank figure is the monthly average of the silver price, and the consumer price figure is the CPI-U from the US Bureau of Labor Statistics (BLS). The Silver Institute, an industry group, reaches a similar verdict. It says past data give some support to a link between silver and inflation, yet the latest wave of inflation had far less effect on the price (source: Silver Institute, Factors that determine the silver price).
So the answer depends on the period you pick, and the two periods people quote most give opposite results.
What makes an asset an inflation hedge
An inflation hedge is an asset whose value keeps up with the general level of prices, so its buying power holds while cash loses it. The test is the real return: the change in price after you take out the rise in consumer prices over the same months.
The usual yardstick in the United States is the CPI-U, the consumer price index for all urban consumers, which the BLS publishes each month (source: BLS CPI-U). Inflation is the percentage rise in that index, usually over 12 months.
For silver, a long and steady price series matters as much as the index. The World Bank publishes a monthly average of the London silver price back to 1960. It uses the Handy & Harman price before July 1976 and rounds to 10 cents an ounce (source: World Bank Pink Sheet). A monthly average sits below the highest daily price of its month, so peaks measured this way look lower than the single-day records quoted for silver.
A fair test measures each inflation episode the same way: from the December before the CPI-U first stood 5% or more above a year earlier to the last month it did. The 12-month changes used are the ones the BLS publishes, rounded to one decimal place. That gives December 1972 to October 1982 for the 1970s, when only two months of late 1976 dipped below 5%, and December 2020 to March 2023 for the recent wave (source: BLS CPI-U).
The same rule picks out an earlier run, from December 1968 to February 1971. Over it the CPI-U rose 12.4% and silver's monthly average fell from $2.0 to $1.6, about a fifth, and its 12-month change beat inflation in only 2 of the run's 24 months at 5% or more (source: World Bank Pink Sheet, BLS CPI-U). Later spells at 5% or more, in 1989-91 and in mid-2008, lasted no more than seven months at a time (source: BLS CPI-U). Older prices are restated at September 2026 prices, using the September 2026 CPI-U reading of 336.940 (source: BLS CPI-U).

Silver in the 1970s inflation
The idea of a silver inflation hedge comes from the 1970s. From December 1972 to October 1982, silver's monthly average went from $2.0 to $9.4 an ounce, nearly five times, while the CPI-U rose 131.1%. After inflation, silver ended the period at about twice its starting value (source: World Bank Pink Sheet, BLS CPI-U).
Silver kept up in most months until 1981 and in none from 1981 on. Inflation ran at 5% or more in 113 months from April 1973 to October 1982. Silver's 12-month gain was the bigger of the two in 66 of them, all before 1981, and in none of the 22 such months of 1981 and 1982 (source: World Bank Pink Sheet, BLS CPI-U).
The gain did not arrive evenly. The Silver Institute splits the decade into two US inflation waves and says silver tripled in the first. On the World Bank's monthly averages, it went from $2.0 in December 1972 to $5.4 in February 1974, about 2.7 times (source: Silver Institute, Factors that determine the silver price, World Bank Pink Sheet).
Between the waves, prices kept rising and silver stood still. Its monthly average was $4.4 in December 1974 and again in December 1976. Over those two years the CPI-U rose 12.1%, so silver lost about 10.8% after inflation. In 1975 alone, the CPI's yearly average rose 9.1% while silver's yearly average fell 6.0% (source: World Bank Pink Sheet, BLS CPI-U).
The second wave brought the famous spike. Silver's monthly average reached $38.9 in January 1980. The Silver Institute links the climb partly to investors who bought because of rising inflation and negative real interest rates. It also says other factors drove the final spike, so January 1980 is a poor guide to what inflation alone did (source: World Bank Pink Sheet, Silver Institute, Factors that determine the silver price).
The crash came while inflation was still high. From January to December 1980, silver's monthly average dropped 57.6% as the CPI-U rose 10.9%. In 1981 the CPI's yearly average rose 10.3% and silver's yearly average fell 49.4% (source: World Bank Pink Sheet, BLS CPI-U). The Silver Institute calls the fall in inflation under the Federal Reserve's aggressive policy an important factor in that collapse. It says the Fed lifted its federal funds rate to a peak of 20% in 1981 (source: Silver Institute, Factors that determine the silver price).
So the decade that built silver's reputation ended in a crash while inflation stayed high. After inflation, silver stood at about four times its December 1972 value at the end of 1980, before the crash halved that by October 1982 (source: World Bank Pink Sheet, BLS CPI-U).
Silver in the 2021-23 inflation
The second test is the most recent inflation wave, and silver failed it. From December 2020 to March 2023, the CPI-U rose 15.9%, while silver's monthly average went from $25.0 to $22.0, a fall of 12.0%. After inflation, silver lost 24.1% (source: World Bank Pink Sheet, BLS CPI-U).
The worst of it came at the height of inflation. In June 2022, the CPI-U stood 9.1% above a year earlier, its fastest pace of the episode. By then silver's monthly average was 13.6% below its December 2020 level, and it hit its low for the episode, $18.9, in September 2022 (source: World Bank Pink Sheet, BLS CPI-U).
Silver's big gain came before the inflation did. From March to August 2020, its monthly average jumped 81.2%, from $14.9 to $27.0, while consumer prices rose 0.7% (source: World Bank Pink Sheet, BLS CPI-U). The Silver Institute makes the same point, saying gains mostly came before the surge in US inflation. It suggests trust in the Fed kept inflation expectations low, and that investors did not reach for silver as a hedge this time (source: Silver Institute, Factors that determine the silver price).
Year by year, the result depends on how you count. On yearly averages, silver rose 22.5% in 2021, when the CPI rose 4.7%, then fell 13.4% in 2022, when the CPI rose 8.0%. From December to December the order flips: silver fell 10.0% in 2021 and rose 3.6% in 2022 (source: World Bank Pink Sheet, BLS CPI-U). In the 23 months of the wave with inflation at 5% or more, silver's 12-month change beat inflation in just 3. By December 2023, nine months after the episode's last 5% month in March 2023, silver's monthly average was still 4.4% below its December 2020 level while consumer prices were 17.8% higher (source: World Bank Pink Sheet, BLS CPI-U).
Silver's real return from 1980 to 2011
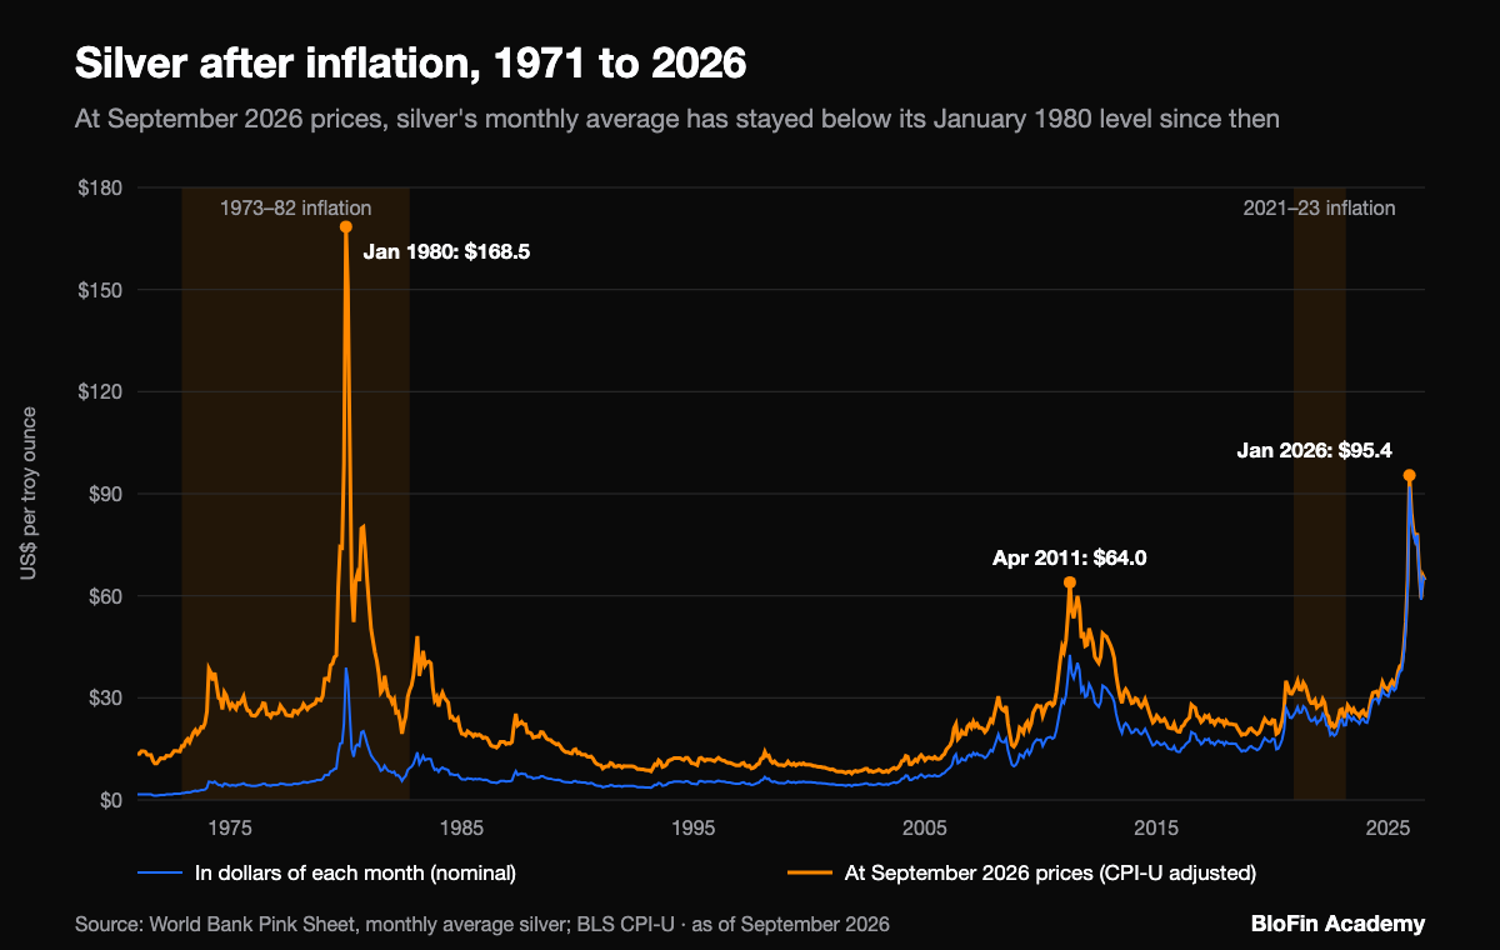
Measured on monthly averages, silver's real return between its two great peaks, from January 1980 to April 2011, was about -62%. Consumer prices nearly tripled while the silver price barely moved. Its monthly average went from $38.9 to $42.7, up 9.8%, as the CPI-U rose 189.1% (source: World Bank Pink Sheet, BLS CPI-U).
That span is a real-return measure from one top to the next, and it is not an inflation episode. It starts at a spike and covers three decades in which inflation was mostly lower. What it shows is how long a real loss can last after buying at a peak. Using the CPI-U's reading of 77.8 for January 1980, that month's average is worth about $168.5 at September 2026 prices (source: World Bank Pink Sheet, BLS CPI-U).
Silver has not regained that level in real terms. Its highest monthly average since 1980, $92.1 in January 2026, is worth about $95.4 on the same basis, or about 56.6% of the January 1980 figure. September 2026's own monthly average of $64.6 comes to about 38.3% of it (source: World Bank Pink Sheet, BLS CPI-U).
How closely silver tracks CPI
Silver tracks the CPI loosely, and less closely in recent decades. From 1971 to 2025, yearly changes in silver's yearly average and in the CPI's yearly average had a correlation of 0.34. Squared, that is about 12%, the share of silver's yearly swings that lines up with inflation (source: World Bank Pink Sheet, BLS CPI-U).
A correlation is a score between -1 and +1, and the closer it is to +1, the more the two series rise and fall together. On yearly averages, the score was 0.50 for 1971 to 1999 and only 0.12 for 2000 to 2025. In the ten years from 2016 to 2025 it was -0.36, so silver tended to move against inflation. Measured from December to December, the results are close: 0.32 for the whole window and 0.05 since 2000 (source: World Bank Pink Sheet, BLS CPI-U).
The years of high inflation make the point more plainly. In 19 of the years from 1971 to 2025, the CPI's yearly average rose 4% or more. Silver's yearly average fell in 11 of them, including 1975, 1981, each year from 1988 to 1991, and 2022, and it beat inflation in only 7 (source: World Bank Pink Sheet, BLS CPI-U). In the 36 years with inflation under 4%, silver beat inflation in 20. The BLS published no CPI-U figure for October 2025 because of the 2025 lapse in federal funding, so 2025's yearly average is taken over the other 11 months (source: BLS CPI-U).
Month by month, the pattern holds. From January 1972 to September 2026, inflation ran at 5% or more in 155 months, and silver's 12-month change beat inflation in 72 of them, about 46% (source: World Bank Pink Sheet, BLS CPI-U). In months with lower inflation it beat inflation about 49% of the time, so high inflation did not make silver more likely to keep up.
Other assets make different promises. Treasury Inflation-Protected Securities (TIPS) adjust their principal with consumer prices and repay at least the original principal at maturity, a floor that silver lacks (source: TreasuryDirect, TIPS). Gold is seen far more as a financial asset than silver is, in the Silver Institute's account, so gold's record as an inflation hedge needs its own test (source: Silver Institute, Factors that determine the silver price).
Why industrial demand weakens silver as an inflation hedge
Industrial demand weakens the hedge because most silver is bought to be used up, so its price follows factories as well as money worries. Factories took 657.4 million ounces of silver in 2025, about 58% of all 1,130.6 million ounces of demand. Add the 278.1 million ounces that exchange-traded funds bought, and that share falls to about 47% (source: Silver Institute, World Silver Survey 2026).
That pulls against the hedge when inflation brings higher interest rates. The 2026 survey says rising bond yields tend to weigh on assets that pay no yield, such as silver and gold. It also warns that silver's use in industry makes it vulnerable to worries about a worldwide slowdown (source: Silver Institute, World Silver Survey 2026). A metal used in electronics, solar panels and brazing can lose factory buyers just as prices in shops are rising.
The 2022 figures show the two kinds of buyer pulling apart. Industrial demand rose 5.0% that year, yet the Silver Institute's yearly average London price fell 13.6%, from $25.14 to $21.73, as funds sold silver (source: Silver Institute, World Silver Survey 2026). A strong year for factories did not hold the price up while investors sold.
Silver and the October 2026 US inflation report
The US inflation report for October 2026, published at 8.30AM ET (1.30PM UTC) on November 10, 2026, showed the CPI-U up 0.4% in the month after seasonal adjustment, after 0.6% in September (source: BLS, CPI release for October 2026). Shelter made up more than 30% of the rise. Energy rose 0.7%, far less than in September, when it rose 5.2% and gasoline's 9.1% jump made up more than half of the month's increase (source: BLS, CPI release for September 2026, BLS, CPI release for October 2026).
The October report carries no 12-month rate for the CPI-U. The BLS collected no survey data in October 2025, during the lapse in federal funding, so it cannot publish 12-month changes that need that month. Core prices, which leave out food and energy, rose 0.3% in October, as they did in September and August (source: BLS, CPI release for October 2026). The latest 12-month rates are September's: consumer prices 3.7% higher than a year earlier, up from 3.4% in August, and core prices 2.6% higher (source: BLS, CPI release for September 2026).
Silver's recent path is another case of the two going separate ways. Over the 12 months to September 2026, its monthly average rose 50.9%, from $42.8 to $64.6, far ahead of inflation. From August to October 2026, silver's monthly average fell 12.8%, from $65.4 to $57.0, even as the September report showed inflation picking up (source: World Bank Pink Sheet). A monthly average moves slowly, so for the live mark price used for liquidation, next to the last traded price, open the XAGUSDT Perpetual page.
Trading silver on BloFin
Each CPI report is one input to a silver price that also answers to factories, interest rates and fund flows, and trading silver around CPI and FOMC covers report days in detail. On BloFin, silver trades through the XAGUSDT Perpetual. Each contract represents 0.01 troy ounce of silver, profit and loss settle in USDT, and the market trades 24/7 (source: BloFin, XAGUSDT listing notice).
BloFin has no silver token or spot market for silver, so the perpetual gives you price exposure with no metal to store or redeem, and it never expires. While you hold it, funding between longs and shorts settles every 4 hours, and a positive rate means longs pay shorts.
Leverage cuts the time your view has to be right. BloFin closes a futures position by force when its mark price hits the liquidation price of a leveraged position. Before you place an order, the order panel gives an estimate of that level as Liq. Price. A drop like the 12.8% between silver's August and October monthly averages can end a leveraged trade long before any inflation trend plays out.
The inflation record is one input to whether silver is a good investment, together with its swings, its long waits below past peaks and the cost of holding it. Protecting a crypto holding is a different task, because hedging crypto with silver depends on how the two prices move together and on sizing the silver position to the holding.
Looking to trade silver? To get started, you'll need to first create a BloFin account, fund your account with cryptocurrency, and navigate to the XAGUSDT Perpetual trading page.

Frequently asked questions
How do you adjust a silver price for inflation?
Multiply the old price by the CPI-U reading for the month whose prices you want, then divide by the reading for the month of the old price. Silver's monthly average of $42.7 in April 2011, when the CPI-U stood at 224.906, is worth about $64.0 at September 2026 prices. That is close to the $64.6 monthly average of September 2026 itself (source: World Bank Pink Sheet, BLS CPI-U).
Does silver rise when inflation is low?
It can rise sharply. Silver's yearly average London price climbed 134.3% from 2008 to 2011, from $14.99 to $35.12, while yearly average US inflation ran between -0.4% and 3.2% from 2009 to 2011 (source: Silver Institute, World Silver Survey 2017, BLS CPI-U). The Silver Institute ties part of that run to central bank bond buying, which raised expectations of future inflation (source: Silver Institute, Factors that determine the silver price).
How did silver do when consumer prices fell?
The only year since 1971 when the CPI's yearly average fell was 2009, by 0.4%. Silver's yearly average London price slipped 2.1% that year, from $14.99 to $14.67 (source: Silver Institute, World Silver Survey 2017, BLS CPI-U). One year is too few to call silver a hedge against falling prices, or to rule it out.
What was silver's lowest price after inflation?
Silver's lowest monthly average since 1971, after inflation, came in November 2001, at $4.1 an ounce. At September 2026 prices that is about $7.8 (source: World Bank Pink Sheet, BLS CPI-U). Over the 1990s, silver lost ground: its monthly average fell 7.1% from December 1989 to December 1999 while the CPI-U rose 33.5%.
What is the difference between headline and core inflation?
Headline inflation counts everything in the CPI basket, while core inflation leaves out food and energy, whose prices swing the most. Energy is why the two can split quickly: the BLS energy index rose 2.1% in August 2026, 5.2% in September and 0.7% in October (source: BLS, CPI release for October 2026).
Researched and written by the BloFin Academy editorial team with AI-assisted drafting. All facts independently verified. Primary sources include the US Bureau of Labor Statistics' CPI-U series and its CPI releases for September and October 2026, the World Bank's monthly silver prices (Pink Sheet), the Silver Institute's report on the factors behind the silver price and its World Silver Surveys for 2026 and 2017, and TreasuryDirect's TIPS page, current as of November 10, 2026.
Nothing in this article constitutes financial advice, and nothing in it is a recommendation to buy, sell or hold silver in any form. Silver lost value after inflation for three decades after its 1980 peak and fell while prices rose in 2021-23, so it can leave your buying power lower at the very time you want it protected. On the XAGUSDT Perpetual, leverage can liquidate a position on a few days' move, and funding can cost a long position every four hours. Past performance does not indicate future results. Do your own research and consider your risk tolerance before you trade on BloFin.