
Silver is in more of the things around you than most people guess, from the phone in your pocket to the solar panels on a neighbor's roof. Ranked by how much metal each one takes, though, those uses look quite different from the stories you hear about them. The same metal also fills coin collections and jewelry boxes. So it gets talked about as a factory input one week and as a store of wealth the next.
Headlines tend to pick one use and run with it. Solar panels and data centers get most of the attention, usually next to the word "shortage". What you rarely get is the order: which uses take the most silver, how much of the total goes to factories, and whether factory demand is growing. In 2025, factory demand for silver shrank.
The clearest picture comes from ranking the uses by demand, in ounces, from one count. A yearly survey from the Silver Institute is that count. Its figures put electronics outside solar as the biggest single use, with coins, bars and jewelry each ahead of solar panels. The ranking also shows which uses move with the economy and which move with the price.
BloFin offers price exposure to silver through the XAGUSDT Perpetual, a USDT-settled contract that tracks the metal while no silver changes hands. Knowing who uses silver helps you judge the stories told about its price. Still, demand is counted once a year, so it tells you little about next week.
What is silver used for?
Silver is used for electronics, solar panels, coins and bars, jewelry, silverware, brazing alloys, chemical catalysts and medical products. In 2025, industry took 657.4 million ounces, about 58% of the 1,130.6 million ounces of demand. Coins, bars, jewelry and silverware took most of the rest (source: Silver Institute, World Silver Survey 2026).
Those figures come from the World Silver Survey, which the Silver Institute, an industry group, publishes each April with data from the research firm Metals Focus. The 2026 edition is the newest full count, so its 2026 numbers are forecasts made in April.
Photography, once a big use, has shrunk to 24.2 million ounces, its lowest in decades (source: Silver Institute, World Silver Survey 2026). The survey keeps it on its own line, apart from industry. Buying by funds also sits outside the demand total, and that matters when you work out industry's share.
Silver's uses ranked by ounces
Ranked by ounces in 2025, electronics outside solar came first at 262.9 million. Coins and bars came next at 217.7 million, then jewelry at 189.3 million and solar panels at 186.6 million. The survey puts solar inside its electrical and electronics line, so the first figure is that line's 449.5 million minus solar (source: Silver Institute, World Silver Survey 2026).
Use | 2025, million ounces | Share of 2025 demand | 2026 forecast, million ounces |
|---|---|---|---|
Electronics and electrical, outside solar | 262.9 | 23.3% | 271.9 |
Coins and bars | 217.7 | 19.3% | 257.6 |
Jewelry | 189.3 | 16.7% | 159.4 |
Solar panels (photovoltaics) | 186.6 | 16.5% | 151.0 |
Other industrial, including catalysts | 157.4 | 13.9% | 165.7 |
Brazing alloys and solders | 50.5 | 4.5% | 51.0 |
Silverware | 42.1 | 3.7% | 33.5 |
Photography | 24.2 | 2.1% | 22.5 |
Each share is of the 1,130.6 million ounces of 2025 demand, and the last column holds the April 2026 forecasts (source: Silver Institute, World Silver Survey 2026).
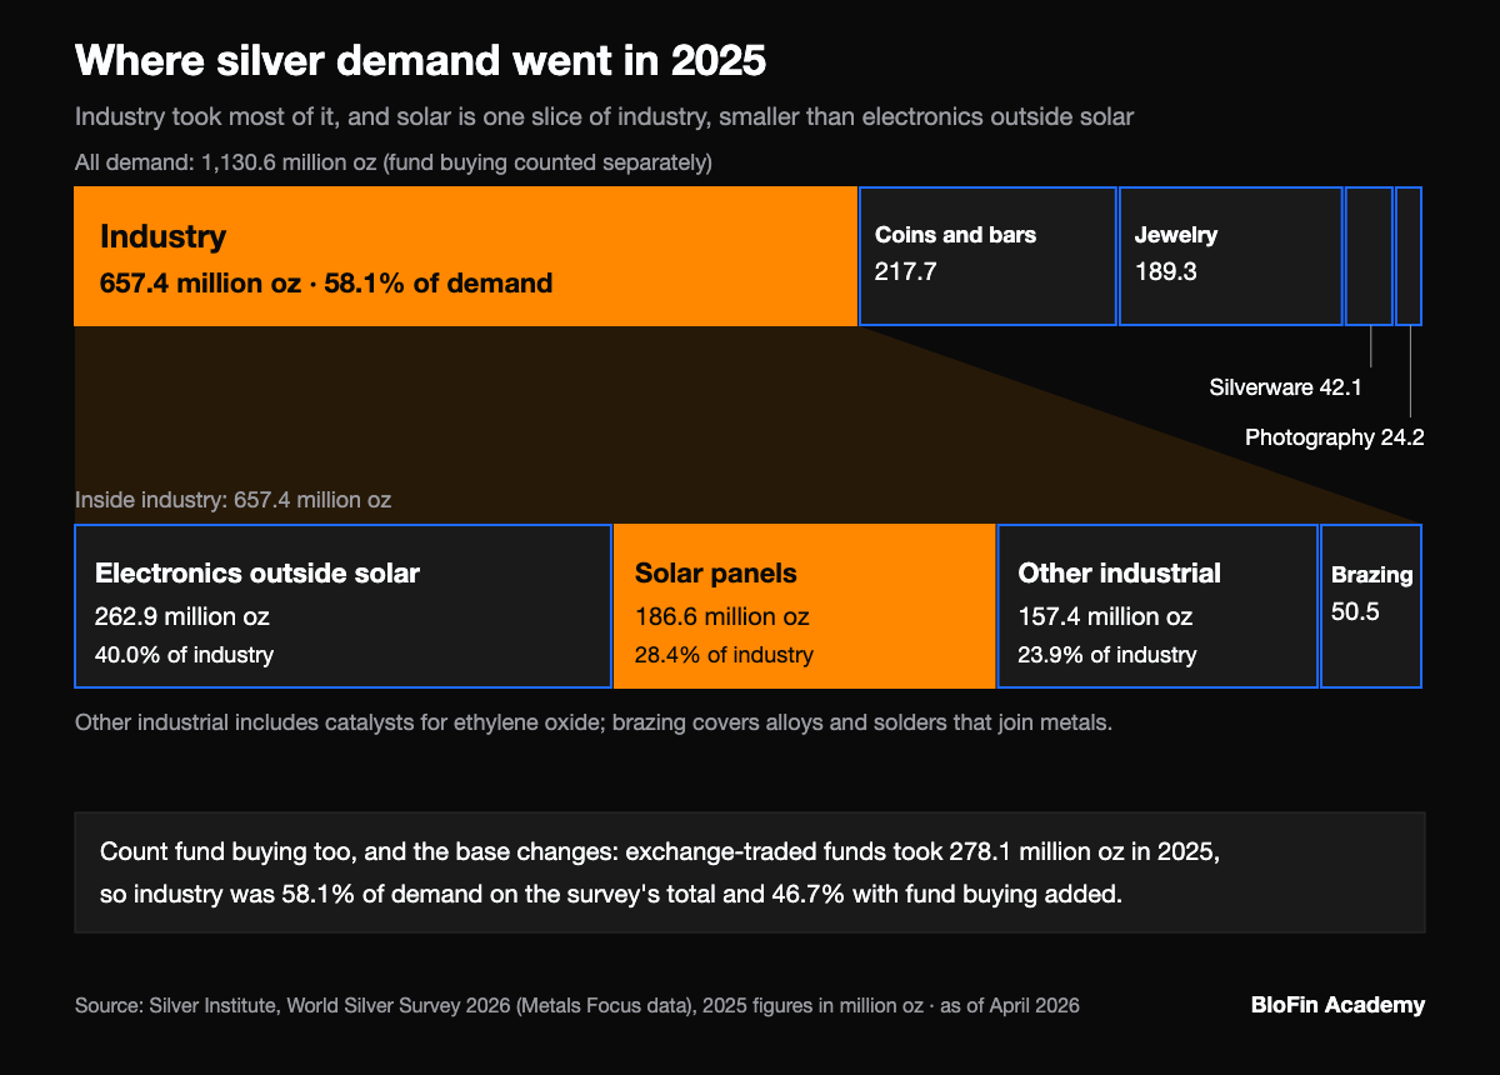
Solar is large, but it ranks fourth among all uses, and electronics outside solar takes about 41% more silver. Coins and bars beat both jewelry and solar. The April forecast also has coins and bars rising 18% in 2026, while solar, jewelry and silverware all fall (source: Silver Institute, World Silver Survey 2026).
The order shifts with the economy and with the price. Electronics outside solar barely moved from 2024 to 2025, going from 263.4 to 262.9 million ounces. Over the same year solar fell 5.5% and jewelry 7.7%. The uses tied to a buyer's taste, or to one fast-changing technology, swing far more than the steady electrical base (source: Silver Institute, World Silver Survey 2026).
Why industry uses silver
Industry uses silver because it conducts electricity better than any other metal, reflects light well and fights bacteria, so a little of it goes a long way. The Silver Institute says these traits make silver nearly impossible to replace in many uses, from switches to catalysts and medical gear (source: Silver Institute, Silver in Industry, US Geological Survey, silver).
Silver is also durable, so it coats the electrical contacts in switches and circuit boards. Printed silver ink carries current across non-metal surfaces without a wire. That is how many radio-frequency identification (RFID) tags get their tiny antennas (source: Silver Institute, Silver in Industry). The US Geological Survey (USGS) names the traits that matter: silver can be drawn into wire and hammered into shape, it carries current well and it reflects light (source: US Geological Survey, silver).
Copper is the metal people compare silver with most, since both carry electricity. Copper works on a far bigger scale, though. World mines dug up about 23 million tonnes of copper in 2025 and about 26,000 tonnes of silver, so copper output was roughly 900 times larger (source: US Geological Survey, copper, US Geological Survey, silver). Copper does the heavy wiring in homes, cars and power grids, while silver goes into thin contacts, pastes and coatings.
The two metals now compete head to head in one product, the solar cell. As silver got dearer, panel makers cut the silver in each cell, with thinner lines and partly by swapping in copper. Those cuts are the main reason solar used less silver in 2025 (source: Silver Institute, World Silver Survey 2026).

Silver in solar panels
Silver in solar panels sits in a paste printed on each silicon cell, where it forms fine lines that carry away the power the cell makes. Solar used 186.6 million ounces in 2025, about 28% of industrial demand. The survey expects a 19% drop to 151.0 million in 2026, which would cut solar's share to about 24% (source: Silver Institute, Silver in Industry, World Silver Survey 2026).
Solar is why so much talk about silver demand became talk about solar. The survey's solar figure more than doubled between 2020 and 2024, from 82.8 million ounces to 197.5 million. Back in 2017, solar was under a fifth of industrial demand. Then 2025 brought the first fall since 2019, because makers cut the silver in each cell faster than they added cells (source: Silver Institute, World Silver Survey 2026).
How much silver one solar cell uses
A typical solar cell held 111 milligrams of silver in 2019, down from 521 milligrams in 2009, in research by CRU for the Silver Institute. Price was a key driver, CRU says: when it more than doubled from 2009 to 2011, the silver in an average cell fell from 521 to 327 milligrams (source: CRU for the Silver Institute, 2020).
Newer figures count silver per watt of a cell's power instead of per cell. The 2026 edition of the International Technology Roadmap for Photovoltaics (ITRPV) put use in 2025 at about 10 milligrams per watt for TOPCon cells. For heterojunction (HJT) cells it was about 12 milligrams. The roadmap expects about 6.3 and 4.3 milligrams by the mid-2030s. TOPCon is the cell design that took over 80% of the market in 2025, by the survey's count (source: pv magazine, June 25, 2026, Silver Institute, World Silver Survey 2026).
To see what that means for one panel, take a 400-watt panel of TOPCon cells at 10 milligrams per watt. It holds about 4 grams of silver, or about 0.129 troy ounces. At the XAGUSDT Perpetual's last price of 52.84 USDT at 5.02PM UTC on November 9, 2026, that silver was worth about 6.8 USDT. The survey expects mainstream cells to drop below 5 milligrams per watt by 2027, and at that level the same panel would hold less than half as much. That is a much faster path than the roadmap's 6.3 milligrams for TOPCon by the mid-2030s (source: pv magazine, June 25, 2026, Silver Institute, World Silver Survey 2026).
Two counts of solar's silver differ by a wide margin. ITRPV puts the silver used to make modules in 2025 at about 7,244 tonnes, or about 232.9 million ounces, which was 20% less than in 2024. The survey's solar line is 186.6 million ounces, down 5.5%. The gap is about 46 million ounces, so check whose count a solar figure comes from before you compare it with another (source: pv magazine, June 25, 2026, Silver Institute, World Silver Survey 2026).
Why solar is using less silver
Solar makers use less silver by printing thinner lines and mixing copper into the paste. Some lines are also testing copper plating, which could cut silver below 1 milligram per watt. The survey says these steps cut silver per unit by more than 15% in 2025. It expects a further cut of 15% to 20% per cell in 2026. Pastes with only 10% silver went into mass production in late 2025 (source: Silver Institute, World Silver Survey 2026).
Price drives part of it. By the survey's count, silver made up 8% to 10% of the cost of a solar cell at the start of 2025, and over 20% later in 2025 (source: Silver Institute, World Silver Survey 2026). Deutsche Bank measured the whole module instead, putting silver at more than 30% of making costs early in 2026 and about 14% by early October. The bank expects silver per cell to fall 17% in 2026, and solar's total silver use to drop by more than 20% (source: Mining.com, October 5, 2026).
In a Kitco interview published October 19, 2026, Matthew Piggott, who heads gold and silver research at Metals Focus, said solar had already passed the inflection point. Past that point, savings in each panel outweigh the growth in new panels. He said the savings come from small yearly gains in current methods, with no copper breakthrough needed. Metals Focus put 2026 industrial demand at about 640 million ounces, close to the April figure, and expects it to fall again in 2027 (source: Kitco, October 19, 2026, WisdomTree, October 22, 2026).
Piggott also said price is only part of the reason, because makers keep working to raise output and cut costs. The longer record fits that view. Silver per cell kept falling from 130 to 111 milligrams between 2016 and 2019, while the yearly average price stayed between $15.71 and $17.14 an ounce. The fall was slower, though, at about 5% a year, under half CRU's pace for 2009 to 2016. CRU says thrifting has its limits. It also says the pace of thrifting halved from 2012 to 2017 as the yearly average price fell from $31 to $17 an ounce (source: CRU for the Silver Institute, 2020, Silver Institute, World Silver Survey 2017, Silver Institute, World Silver Survey 2026).
Silver in electronics and electrical equipment
Electronics and electrical gear outside solar is silver's biggest single use, at 262.9 million ounces in 2025. Silver goes into switches, contacts, chip packaging, connectors and power modules. It also goes into grid gear such as breakers and offshore wind connectors. The survey's April forecasts imply growth of about 3.4% for this part of demand in 2026 (source: Silver Institute, World Silver Survey 2026).
That steady base is spread across a huge range of goods. The Silver Institute says almost every computer, mobile phone, car and home appliance contains silver. Often it is the coating on an electrical contact, or the ink that forms a circuit board's pathways (source: Silver Institute, Silver in Industry). Each device uses very little, so the total depends on how many devices the world makes.
Data centers and AI
Data centers use silver in chip packaging, in connectors and in the heat-transfer layers between chips and their coolers. The survey expects data centers alone to take more than 10% of electrical and electronics demand in 2027. It also names AI servers and high-bandwidth memory chips as sources of 2025 growth in China and South Korea (source: Silver Institute, World Silver Survey 2026).
Those gains were real, but in 2025 they were too small to make up for solar. The survey says electronics demand fell 2% that year, because thrifting in solar outweighed gains from AI and data centers, the same spending boom behind talk of an AI bubble in stocks. In October, Piggott said electric cars and data centers should make up part of solar's decline over the next 12 months, though not all of it (source: Kitco, October 19, 2026).
Electric vehicles
Battery electric cars generally hold more silver than petrol cars, the survey says. In Europe, battery electric cars rose from 15% to 22% of car production in 2025, which helped protect silver demand while total output fell. In the US, carmakers shifted back toward petrol and hybrid models, and North American light vehicle output fell 3.6% (source: Silver Institute, World Silver Survey 2026).
Silver also joins the power modules in high-voltage electric car platforms, which the survey credits for strong growth in silver brazing in China (source: Silver Institute, World Silver Survey 2026). So the electric car's pull on silver depends on how fast buyers switch, and the race between makers such as Tesla and BYD shapes that pace. In 2025, the shift stalled in one region while it sped up in another.
Solid-state battery claims
Solid-state batteries come up as a possible new use for silver, and one design that uses it is a Samsung research prototype. In a 2020 paper in Nature Energy, researchers at two Samsung labs, one in South Korea and one in Japan, described a prototype cell with a thin silver-carbon layer. They reported more than 900 watt-hours per liter and 1,000 charge cycles (source: Nature Energy, 2020).
That prototype was a 0.6 amp-hour pouch cell, far smaller than a car battery. The survey's 2026 tables have no line for solid-state batteries. So any ounces-per-car figure you see for them is a forecast by whoever publishes it (source: Nature Energy, 2020, Silver Institute, World Silver Survey 2026).
Brazing, catalysts and medical uses of silver
Brazing alloys and solders took 50.5 million ounces of silver in 2025, used to join metal parts in air conditioners, cars, ships and aircraft. The survey's other industrial line, at 157.4 million ounces, includes catalysts that make ethylene oxide, a chemical used in plastics, polyester and antifreeze. Silver also goes into medical products (source: Silver Institute, World Silver Survey 2026, Silver Institute, Silver in Industry).
Brazing grew 1% in 2025, helped by carmakers and aircraft makers. In China, air-conditioning makers moved to alloys with less silver (source: Silver Institute, World Silver Survey 2026). Brazing joins metals at more than 450 degrees Celsius, and soldering works at lower heat. Silver makes both kinds of joint stronger and better at carrying current (source: Silver Institute, Silver in Industry).
Catalysts behave differently from most uses, because the silver comes back almost fully after use. Demand depends on how fast chemical plants are built and refitted. The other industrial line fell 7% in 2025 as new ethylene oxide plants slowed. The survey expects a 5% rise in 2026 as more plants replace their catalysts (source: Silver Institute, Silver in Industry, World Silver Survey 2026).
Medical uses run from silver-coated catheters, breathing tubes and bone supports to bandages and ointments, all for silver's power to keep bacteria at bay (source: Silver Institute, Silver in Industry).
Coins, bars, jewelry and silverware
Coins, bars, jewelry and silverware took 449.1 million ounces in 2025, about 40% of demand. These buyers reacted to a rising price in opposite ways. Coin and bar demand rose 14% as investors bought a climbing metal. Jewelry fell 8% and silverware 21%, which the survey ties mostly to high prices hurting buyers in India (source: Silver Institute, World Silver Survey 2026).
The April forecasts for 2026 widen that split. Coins and bars are set to rise 18%, while jewelry drops 16% and silverware 20% (source: Silver Institute, World Silver Survey 2026). In India, high prices also cut the silver used in zari thread and in varakh, the edible silver leaf on sweets. The survey counts both under industry (source: Silver Institute, World Silver Survey 2026).
Fund buying sits beside these lines, and exchange-traded funds took in 278.1 million ounces in 2025, more than coins and bars did. The survey counts that apart from demand, which is why industry's share can be quoted two ways (source: Silver Institute, World Silver Survey 2026).
How much of silver demand is industrial?
Industrial demand made up about 58% of silver demand in 2025, or 657.4 million of 1,130.6 million ounces, on the Silver Institute's own total. That total leaves out the 278.1 million ounces bought by exchange-traded funds. Count fund buying as demand too, and industry's share drops to about 47% (source: Silver Institute, World Silver Survey 2026).
Industry's share also depends on how much everyone else buys. On the survey's base, industry took 46.1% of demand in 2022, the year coins, bars, jewelry and silverware all peaked. By 2024, after those lines fell back, its share was 58.7%. Industrial demand itself rose in both years (source: Silver Institute, World Silver Survey 2026).
A second count, for the United States alone, gives a similar picture. The USGS estimates that electrical and electronics took 25% of US silver use in 2025 and solar 15%. Other industrial uses and photography took 19%, and brazing and solder 3%. Together that is 62% (source: US Geological Survey, silver). It covers US use only and folds photography into other industrial uses, so it will not match the global survey line by line.
Industrial demand and the silver price
Industrial demand ties silver to factories and the business cycle, yet over short spans it has been a weak guide to the price. From 2018 to 2025, industrial demand and the yearly average London price moved the same way in only four of eight years, on the survey's own figures (source: Silver Institute, World Silver Survey 2026).
The misses run both ways: in 2022, industrial demand rose 5.0% while the yearly average price fell 13.6%. In 2025, industrial demand fell 3.2% while the yearly average price rose 41.6%, in a year when coin, bar and fund buying all rose. Across all eight years, the two series of yearly changes have a correlation of -0.25. With only eight data points, that is too weak to call a real link either way. On the 2017 edition's older count, which still included photography, the two moved the same way in six of nine years from 2008 to 2016. The two editions use different methods, so they cannot be joined into one series (source: Silver Institute, World Silver Survey 2017, World Silver Survey 2026).
Recessions have hit industrial use harder than the price. In 2009, industrial use fell 17.7% on the 2017 edition's wider count, which still included photography, while the yearly average price slipped only 2.1%. Both rebounded in 2010, industrial use by 20.0% and the yearly average price by 37.6% (source: Silver Institute, World Silver Survey 2017). In 2020, industrial demand fell 2.6% on the 2026 edition's count, yet the yearly average price rose 26.8% (source: Silver Institute, World Silver Survey 2026).
The survey itself treats industry as a soft spot for the price when growth slows. It says tariff fears pushed gold to a string of records in early 2025, while silver was left behind because of its industrial exposure. The gold:silver ratio, which tells you how many ounces of silver it takes to match the price of one ounce of gold, peaked at 107 to 1 in April. It then plunged to below 55 to 1 by December, as silver outperformed gold. The survey also warns that silver's industrial exposure leaves it open to fears of a global slowdown in 2026 (source: Silver Institute, World Silver Survey 2026).
Industry also feeds the yearly balance of supply and demand. That balance showed a 40.3 million ounce deficit in 2025. That was the smallest of five deficits in a row since 2021, in the survey's tally of silver supply and demand (source: Silver Institute, World Silver Survey 2026). From day to day, though, the silver price comes from trading in spot and futures markets, where a yearly demand count is one input among many.
To see how traders price these stories as they happen, open the XAGUSDT Perpetual page, where the live mark price sits beside the last trade.
Trading silver's industrial link on BloFin
Trading silver's industrial link means treating news about factories, solar orders and the business cycle as one input among several. Test it against the price before you act. BloFin's silver market is the XAGUSDT Perpetual, where each contract is worth 0.01 troy ounces of silver (XAG) and profit and loss settle in USDT.
BloFin lists no silver spot pair or silver token. A perpetual never expires, unlike a dated futures contract, and holding one is not the same as owning silver on a spot market. Silver is one of several commodities traded in crypto markets this way.
Industrial figures arrive slowly. The survey comes out each April, an interim review follows in many Novembers, and industry reports such as the yearly ITRPV roadmap land in between (source: Silver Institute, 2025 interim review, pv magazine, June 25, 2026). That makes factory demand a slow backdrop for silver trading strategies, each of which still needs its own entry, exit and position size.
Leverage cuts the time a slow story has to play out. BloFin liquidates a futures position once its mark price reaches the liquidation price. You can see an estimate of that level, labeled Liq. Price, on the order form before you trade. A sharp move on a quiet day can end a position long before a demand trend shows up in the yearly count.
Looking to trade silver? To get started, you'll need to first create a BloFin account, fund your account with cryptocurrency, and navigate to the XAGUSDT Perpetual trading page.

Frequently asked questions
Which country uses the most silver in industry?
China used 282.9 million ounces of silver in industry in 2025, about 43% of the world's industrial demand and 3% more than in 2024. The United States came next at 125.5 million. Japan's industrial use fell 27% to 68.8 million, which the survey puts down to competition from Chinese makers of silver powder and the drop in solar demand (source: Silver Institute, World Silver Survey 2026).
Is silver used in phones?
Phones carry silver in their contacts, circuit boards and switches, and the 5G networks they connect to rely on silver's conductivity too (source: Silver Institute, Silver in Industry). The survey says AI-enabled devices started a replacement cycle that helped PC and smartphone shipments recover in 2025. It expects consumer electronics to weaken in 2026 as tight memory supply pushes prices up (source: Silver Institute, World Silver Survey 2026).
Can copper replace silver in solar panels?
Partly, and the switch has started. Silver-coated copper paste is spreading in heterojunction cells and moving into TOPCon cells, and copper plating could cut silver below 1 milligram per watt. The survey says pure copper pastes still have yield and reliability problems, so mass production is unlikely in 2026. Silver stays essential in aerospace, offshore solar and premium cells (source: Silver Institute, World Silver Survey 2026).
How much industrial silver gets recycled?
Recycling from industry returned 110.1 million ounces of silver in 2025, slightly less than in 2024, because newer electronics hold less silver per device. Spent ethylene oxide catalysts were the growing source. The survey expects industrial recycling to rise 8% in 2026 to a 14-year high, while old solar panels still return very little (source: Silver Institute, World Silver Survey 2026).
Why is silver used in medicine?
Silver keeps bacteria at bay, which lets wounds heal faster. It has also worked against germs that have become resistant to drugs through overuse, such as the Staph germ known as MRSA. To fight it, many health facilities use equipment with silver built in, from surgical tools and needles to door handles and linens (source: Silver Institute, Silver in Industry).
Researched and written by the BloFin Academy editorial team with AI-assisted drafting. All facts independently verified. Primary sources include the Silver Institute's World Silver Surveys for 2026 and 2017, its 2025 interim review, its silver-in-industry pages and CRU's solar research. Other sources are the ITRPV roadmap as reported by pv magazine, the US Geological Survey, Nature Energy, Kitco, WisdomTree, Mining.com and BloFin's XAGUSDT Perpetual page, current as of November 10, 2026.
Nothing in this article constitutes financial advice, and nothing in it is a recommendation to buy, sell or hold silver in any form. Demand figures are estimates that get revised, the 2026 numbers are forecasts, and changes in factory use have often failed to predict the price. On the XAGUSDT Perpetual, leverage can magnify losses and lead to liquidation well before a slow trend in industrial demand plays out. Past performance does not indicate future results. Do your own research and consider your risk tolerance before you trade on BloFin.