- The S&P 500 trades at 28x trailing PE ratio, which reflects a premium that prices in decades of growing free cash flow;
- AI does not merely disrupt businesses, it disrupts the certainty that equity valuation depends on. And without certainty, the multiples that hold up today's market have no foundation;
- The strategy that defined a generation of investors, buying the S&P 500 on every dip, is no longer a viable long-term investment choice
Last month, two prominent voices in finance converged on the same argument from different directions. Chamath Palihapitiya published The Collapse of Terminal Value, asking what happens to equity markets if AI makes every competitive moat temporary. Jordi Visser's The Repricing of Time framed the same dynamic differently: AI does not merely disrupt businesses, it compresses the duration of competitive advantage, turning long-duration equity franchises into short-dated call options on execution speed.
Both essays point toward the same conclusion, AI does not merely disrupt businesses, it disrupts the certainty that equity valuation depends on. And without certainty, the multiples that hold up today's market have no foundation.
Stock Prices Are Mostly About the Future
When you buy a stock, you are not simply buying this year's earnings. You are buying a claim on all future earnings, discounted back to today. In financial practice, a stock price is the sum of all future cash flows a company is expected to generate, discounted back to today. The vast majority of equity value lives not in what the business earns this year or next, but in cash flows projected far into the future.
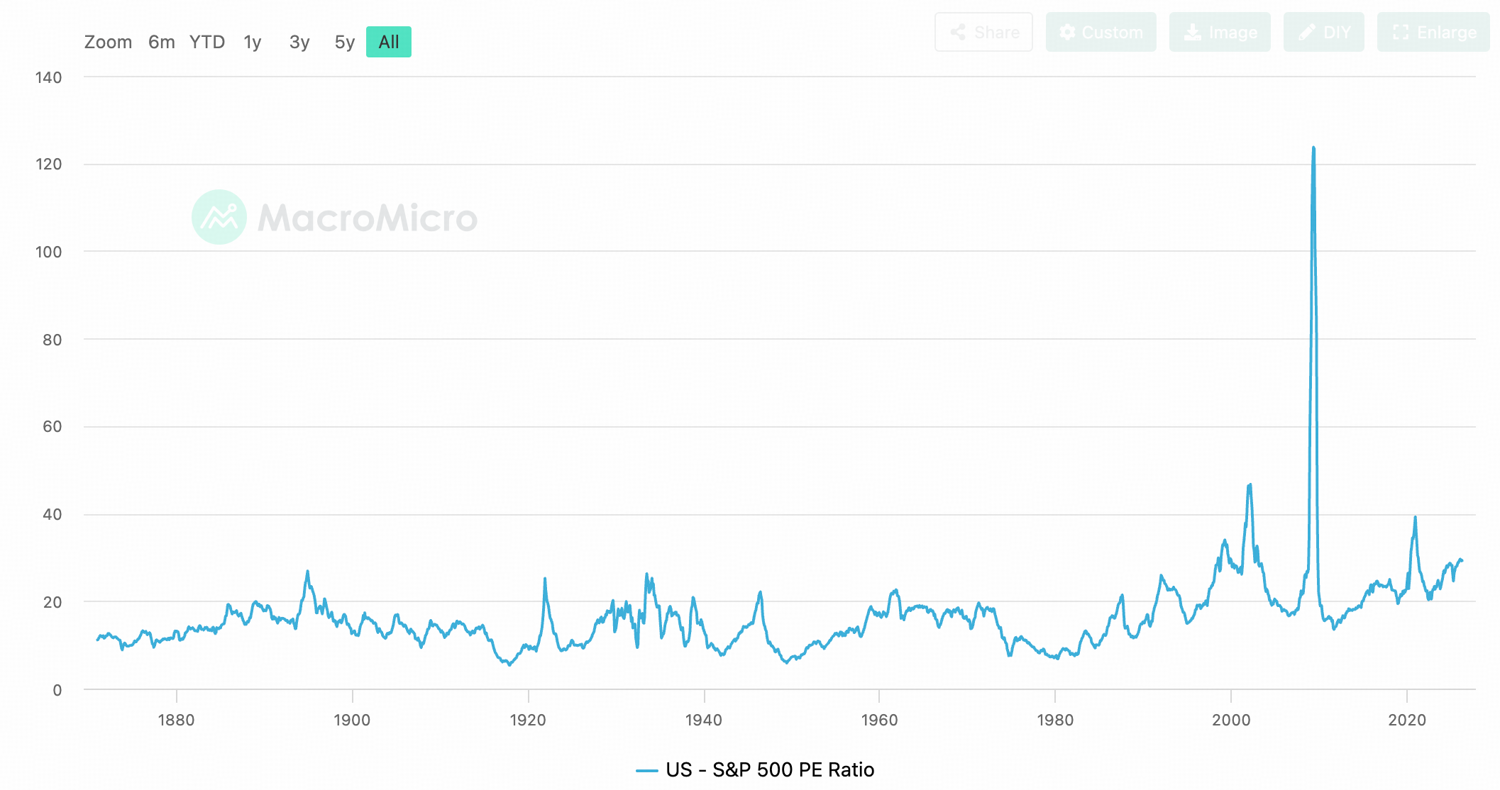
The S&P 500 currently trades at approximately 28x trailing earnings. The long-run historical average is roughly 19.7x. The gap between where markets trade today and where they have historically averaged reflects, in large part, investor confidence that today's dominant companies will sustain their competitive advantages for decades.
To understand what this means in practice, start with how stocks are valued.
Every stock price is, in theory, the sum of all future cash flows a company will generate, each discounted back to today's dollars. A dollar earned ten years from now is worth less than a dollar today, because you could invest that dollar today and earn a return. The rate used to do that discounting is the required rate of return: the minimum return an investor demands to take on the risk of owning that company instead of something safer.
That required rate has two components. The first is the risk-free rate, the return available with zero risk, approximated by the US 10-year Treasury yield, currently 4.5%. No rational investor accepts less from a risky asset than they could earn from a riskless one. The second is the equity risk premium: the additional return historically demanded for bearing the uncertainty of owning a business rather than a government bond, roughly 4–5% over the long run. Add them together and you get approximately 8.5–9.5% as the required return for a stable, durable company with no meaningful growth threats.
Invert that number, divide 1 by 0.09, and you get roughly 11x as the rational price for every dollar of annual free cash flow such a business generates. That is the baseline: what a boring, defensible business deserves to trade at in today's rate environment.
The logic is called a perpetuity valuation, it's one of the most fundamental ideas in finance.If a business generates $1 of free cash flow every year, forever, and you require a 9% annual return, then the most you'd rationally pay for that stream of cash today is the price at which your return equals exactly 9%.The math: Price × 9% = $1/year, so Price = $1 / 0.09 = $11.11.
At $11.11, your $1/year of cash flow represents a 9% return on your investment. Pay more than that, and your effective return drops below your required threshold. Pay less, and you're getting a bargain.
The 11x baseline assumes a business generates the same cash flow every year, forever, with no growth. But the S&P 500 is not priced as a flat, no-growth stream of cash. Markets believe the largest companies, Microsoft, Apple, Nvidia, Alphabet, will earn significantly more in the future than they do today. When future cash flows are expected to grow, investors rationally pay more than 11x today's earnings to own them.
The 28x multiple implies a required return of roughly 3.6% (1/28). That is below the risk-free rate of 4.5%, which would be irrational for a static business. The only way it makes sense is if the growth embedded in the price more than compensates, investors are effectively saying: "I'll accept a low yield today because the cash flows will be much larger in the future."
The premium reflects market confidence that these companies will keep growing and compounding cash flows far into the future. And this assumption is now challenged by AI.
AI Is Already Collapsing Moats in Real Time
The AI disruption is already happening, sector by sector, faster than most valuation models have yet to reflect.
The clearest early signal is SaaS. The business model that defined software for two decades, sell a narrow, deeply integrated tool, charge recurring subscription fees, defend the moat with switching costs and proprietary data, is under direct assault. Founders are rebuilding products that once required years of engineering and tens of millions in capital, in days, using frontier models. Valuations that were justified by the assumption of durable software moats are compressing accordingly.
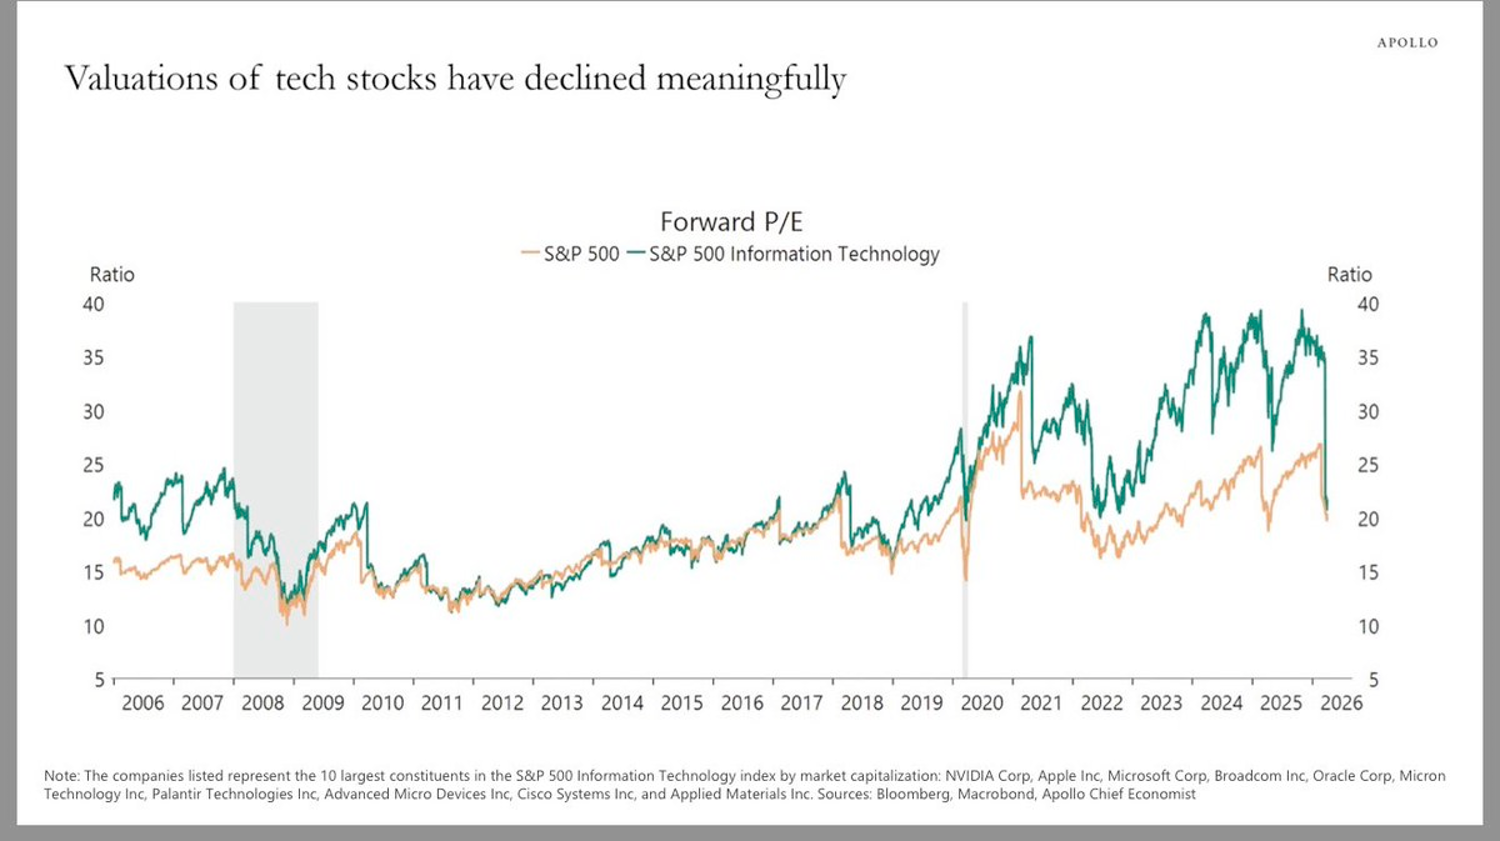
The Sudden Collapse of Software Business Valuation
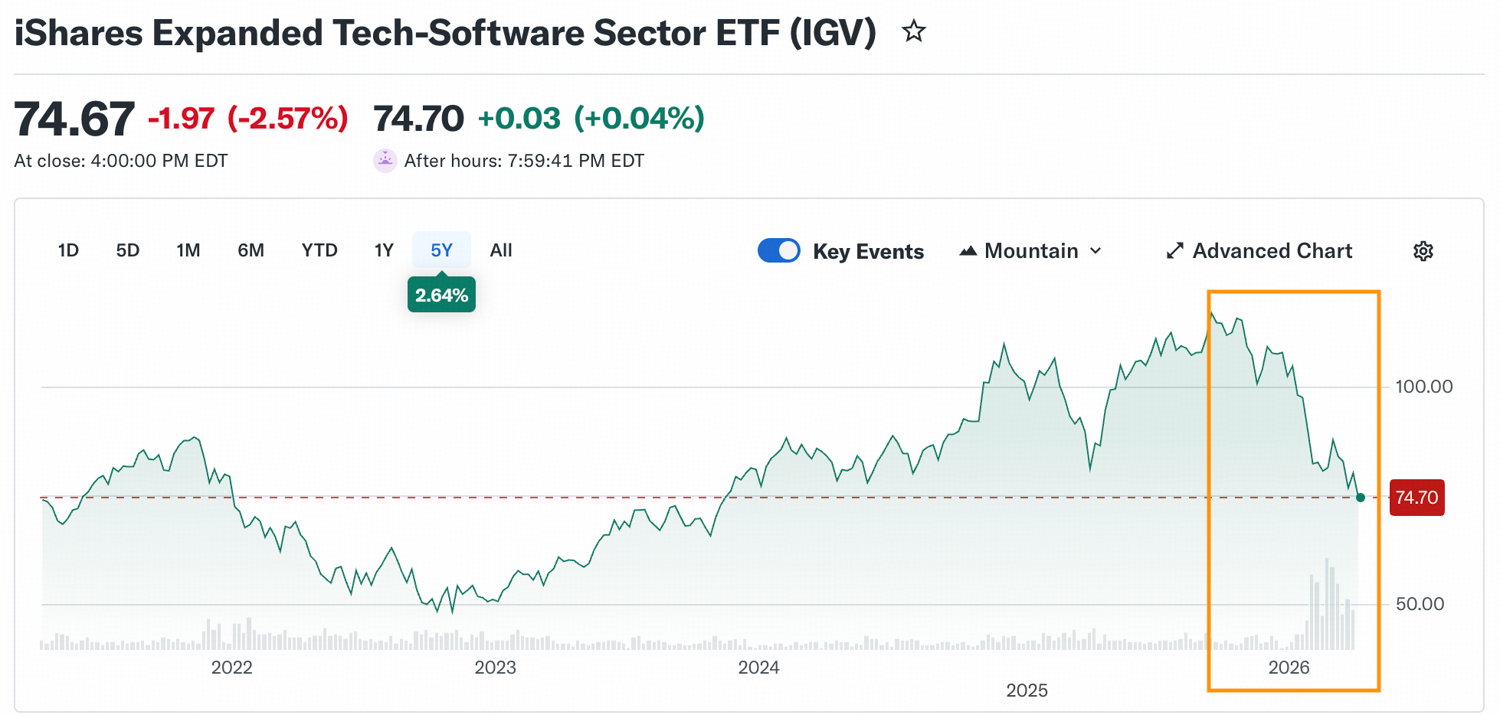
Forward P/E for the S&P 500 Information Technology sector has compressed from 40x to 20x
But SaaS is only the most visible front. The disruption is more structural than any single sector repricing suggests. One week it threatens internal software development workflows. The next it encroaches on legal research. The next it handles tax preparation and compliance summaries. The next it drafts financial disclosures.
When a single model can encroach on HR software, then tax software, then legal drafting, then customer support in rapid succession, the assumptions underlying discounted future cash flow estimates break down. You cannot project a ten-year cash flow stream for a business whose category may not exist as a distinct entity in three years.
The Sceanario that S&P 500 Drop 80%
Chamath formalizes this intuition into a valuation framework. The starting question is simple: if a business faces some annual probability of being rendered obsolete by AI, what is the rational multiple to pay for its current cash flows?
Assign a 20% annual probability of AI-driven obsolescence, which Chamath describes as "not an unreasonable assumption in fast-moving sectors", and the expected business lifespan falls to roughly five years.
Discount only five years of FCF at a 9% cost of equity and the rational multiple compresses to approximately 3.9x.
If a business has a 20% chance of being disrupted in any given year, that is equivalent to saying it has a 80% chance of surviving each year. In probability, when you have a fixed annual chance of "failure," the expected time until failure is simply 1 divided by that probability.Now you have a business generating, say, $1 per year for five years, and then nothing. How much would you pay for that today, if you require a 9% annual return?This is a standard annuity calculation. You cannot simply add up five dollars, because a dollar received in year five is worth less than a dollar today. You have to discount each year's cash flow back to present value:
The chart below is what happens to the S&P 500 index level purely as a result of multiple compression, that is, the market re-rating how much it is willing to pay per dollar of earnings, with no change to the earnings themselves.
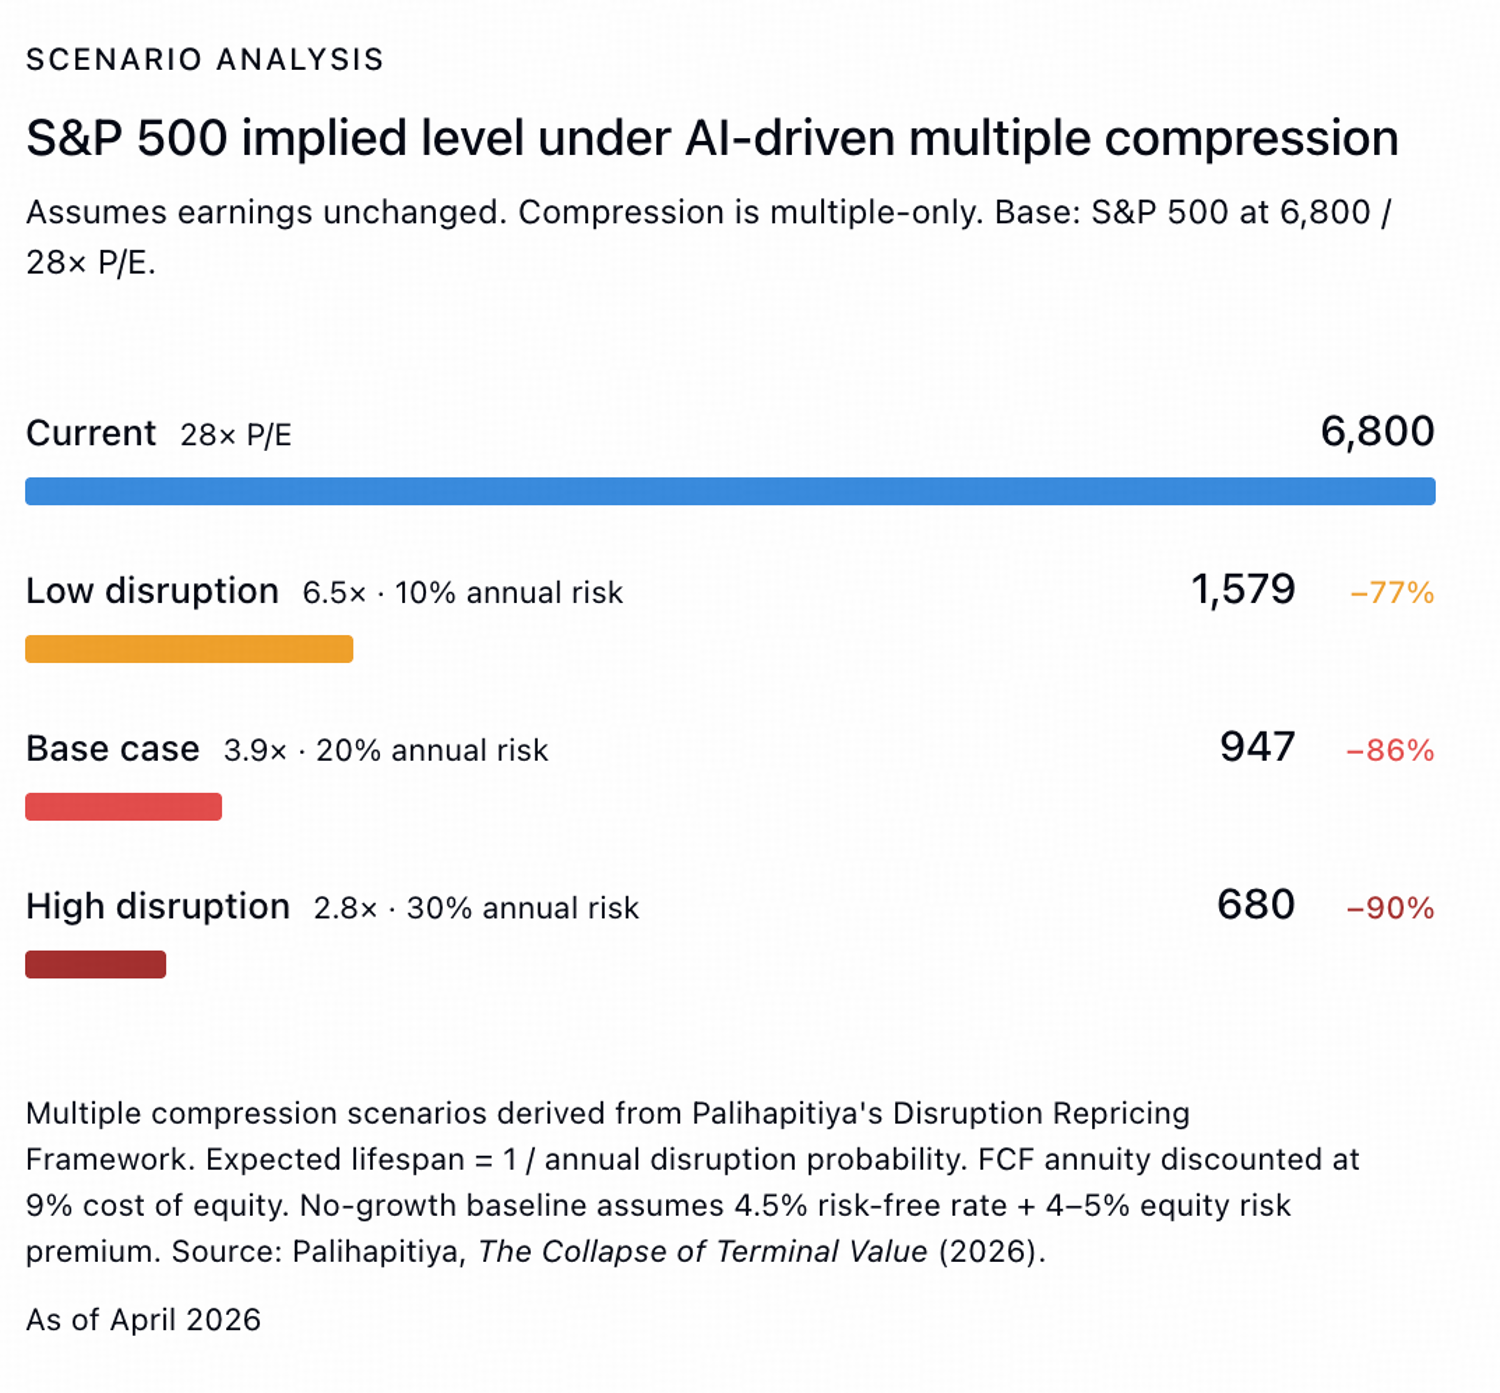
Starting from 6,800 at today's 28× P/E, the four scenarios are:
Current (28×) — the baseline. No disruption is priced in. Markets are paying a historically elevated multiple that assumes durable competitive advantages and decades of compounding cash flows ahead.
Low disruption (6.5×) — assumes a 10% annual probability that any given company is rendered obsolete by AI. That implies an expected business lifespan of roughly ten years. Discounting ten years of cash flows at 9% produces a 6.5× rational multiple, compressing the index to approximately 1,579, a 77% drawdown from today.
Base case (3.9×) — assumes a 20% annual disruption probability, implying a five-year expected lifespan. The rational multiple falls to 3.9×, sending the index to approximately 945, an 86% drawdown. This is Chamath's central scenario, and the one he describes as "not unreasonable" for fast-moving sectors.
High disruption (2.8×) — assumes a 30% annual disruption probability and a roughly three-year expected lifespan. The multiple compresses to 2.8×, implying an index level of around 679, a 90% drawdown.
These numbers are not a forecast. They are a stress test of the valuation logic embedded in current prices. In practice, disruption will be uneven, energy producers, utilities, commodity extractors, and physical infrastructure companies face meaningfully lower obsolescence risk than software platforms or professional services firms. A more precise analysis would assign different disruption probabilities sector by sector rather than applying a uniform rate across the entire index. The aggregate index drawdown would then depend heavily on how much weight the most vulnerable sectors carry.
The S&P 500 Is a Bet on Certainty That Is Becoming Uncertain
The conventional framing of the S&P 500 as a broad, diversified representation of the U.S. economy obscures what the index is actually pricing. It is a market-cap-weighted index, and market cap is a product of multiples, and multiples are a product of certainty. The sectors that have attracted the most capital are those where investors have historically felt most confident projecting cash flows a decade out.
As of April 6, 2026, Information Technology represents 32.3% of the index. Communication Services adds another 11.4%. Consumer Discretionary contributes a further 10%. Together, these three sectors account for over 53% of the S&P 500 by weight.
The important nuance is that this does not mean those companies in these sectors will not survive AI disruption, many of the largest, Apple, Alphabet, Microsoft, Amazon, are active builders of AI capability and may emerge stronger. The question is not survival. It is certainty of future cash flows, and what multiple a rational investor will pay when that certainty is in question.
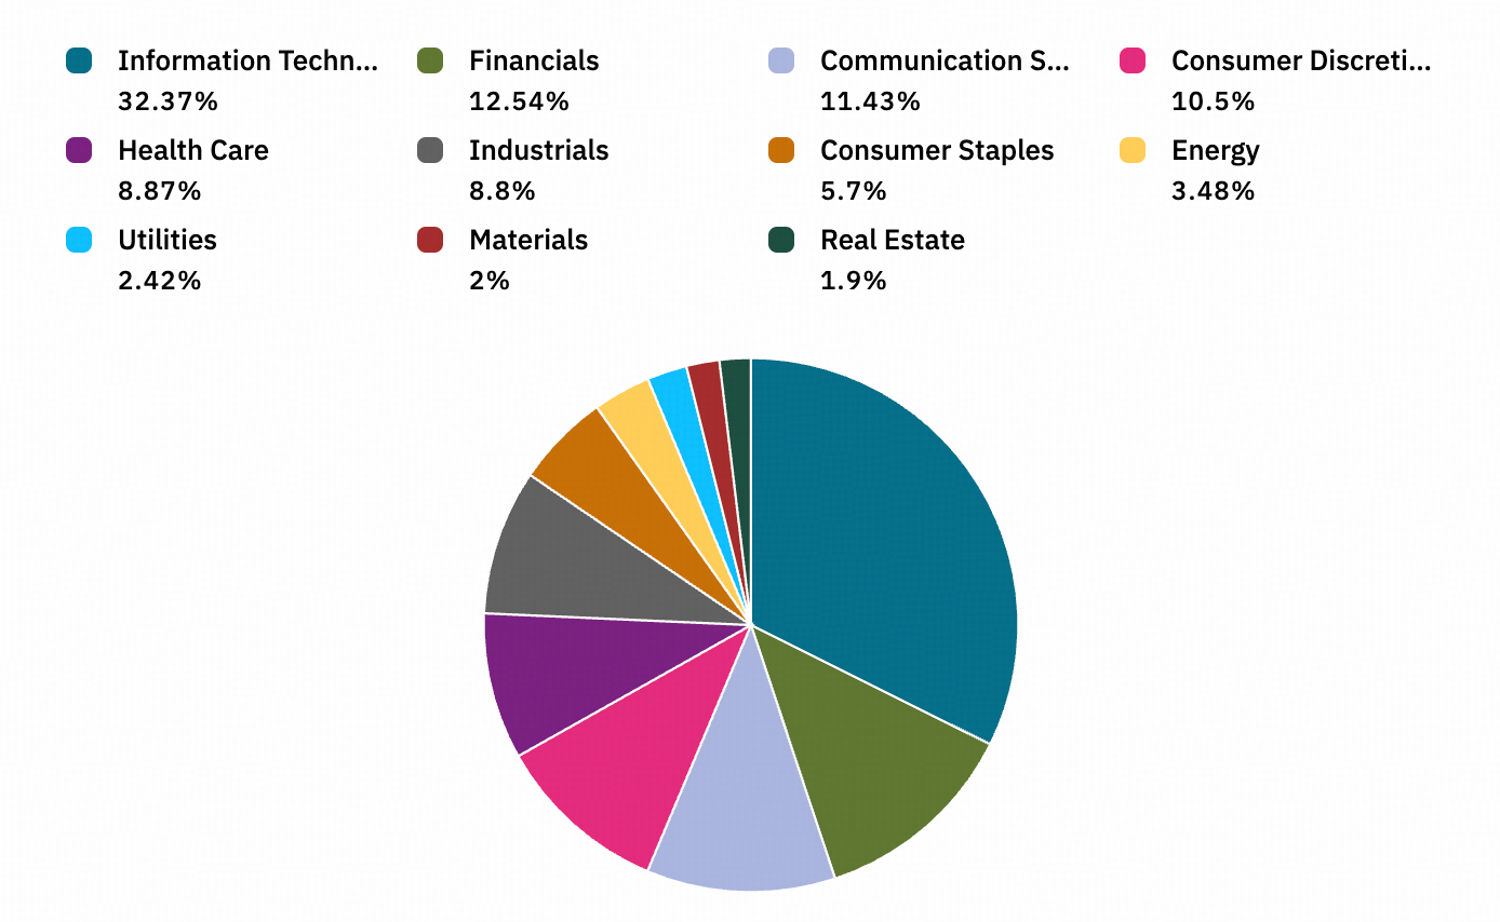
In this context, the scarcest asset in an AI-disrupted economy is not intelligence or software. It is predictability. The sectors most insulated from this uncertainty are physical ones, energy, materials, utilities, and infrastructure. Their cash flows are anchored in resource extraction, physical delivery, and inelastic demand that no model upgrade can disintermediate.
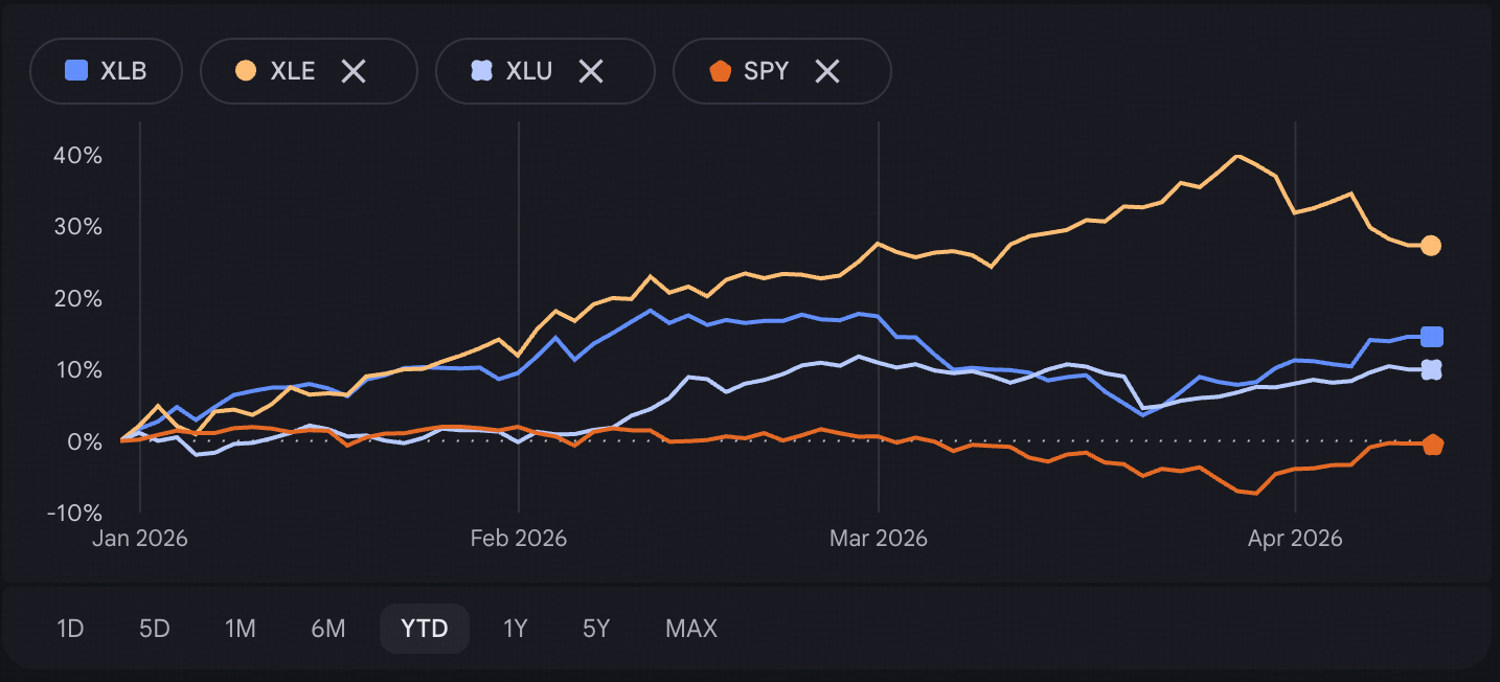
Energy, Materials, and Utilities represent just 3.4%, 2.0%, and 2.4% of the S&P 500 respectively, under 8% combined. All of them (for example, ETF such as XLB for Basic Materials, XLU for utility, and XLE for energy) have outperformed S&P 500 since beginning this year.
The Buy-the-Dip Era Is Over
The dominant retail investing playbook of the past two decades was straightforward: buy SPY (the S&P 500 ETF) on every significant dip. It worked because the index's concentration in technology and platform businesses amplified every bull cycle. Passive flows into index funds reinforced that concentration further, as capital mechanically flowed toward the largest holdings.
AI disruption does not need to trigger an 80% crash to make the S&P 500 a poor investment, the scenario analysis above is a stress test of the valuation logic, not a forecast. The more probable path is subtler and in some ways more frustrating for investors: a prolonged period of flat or negative real returns as two forces work against each other simultaneously.
On one side, the technology-heavy majority of the index faces gradual multiple compression as AI uncertainty accumulates. On the other, the physical sectors that deserve higher valuations in this environment, Energy, Materials, Utilities, are deeply underweighted at under 8% of the index combined. Even as capital begins rotating toward them, their small index weight means their appreciation cannot offset the drag from the larger sectors repricing lower.
The result is an index that appears stable on the surface, no dramatic crash, no obvious crisis, but quietly delivers nothing. A decade of 0% real returns.
Buying the S&P 500 dip is no longer the obvious trade it was. The question is what you are actually buying when you do.
Disclaimer: The information provided herein does not constitute investment advice, financial advice, trading advice, or any other sort of advice, and should not be treated as such. All content set out below is for informational purposes only.