
The 200-week moving average (200W MA) tracks Bitcoin’s average weekly closing price over roughly the past four years. Because it smooths out short-term volatility and entire bull-bear cycles, it is one of the clearest measures of Bitcoin’s structural long-term trend.
Historically, it has also served as one of Bitcoin’s most important bear-market reference levels. Since the indicator became available, Bitcoin has spent the overwhelming majority of its weekly closes above the 200W MA. Major cycle lows have repeatedly formed near it, except for the deep 2022 bear.
A Long-Term Trend That Has Only Risen
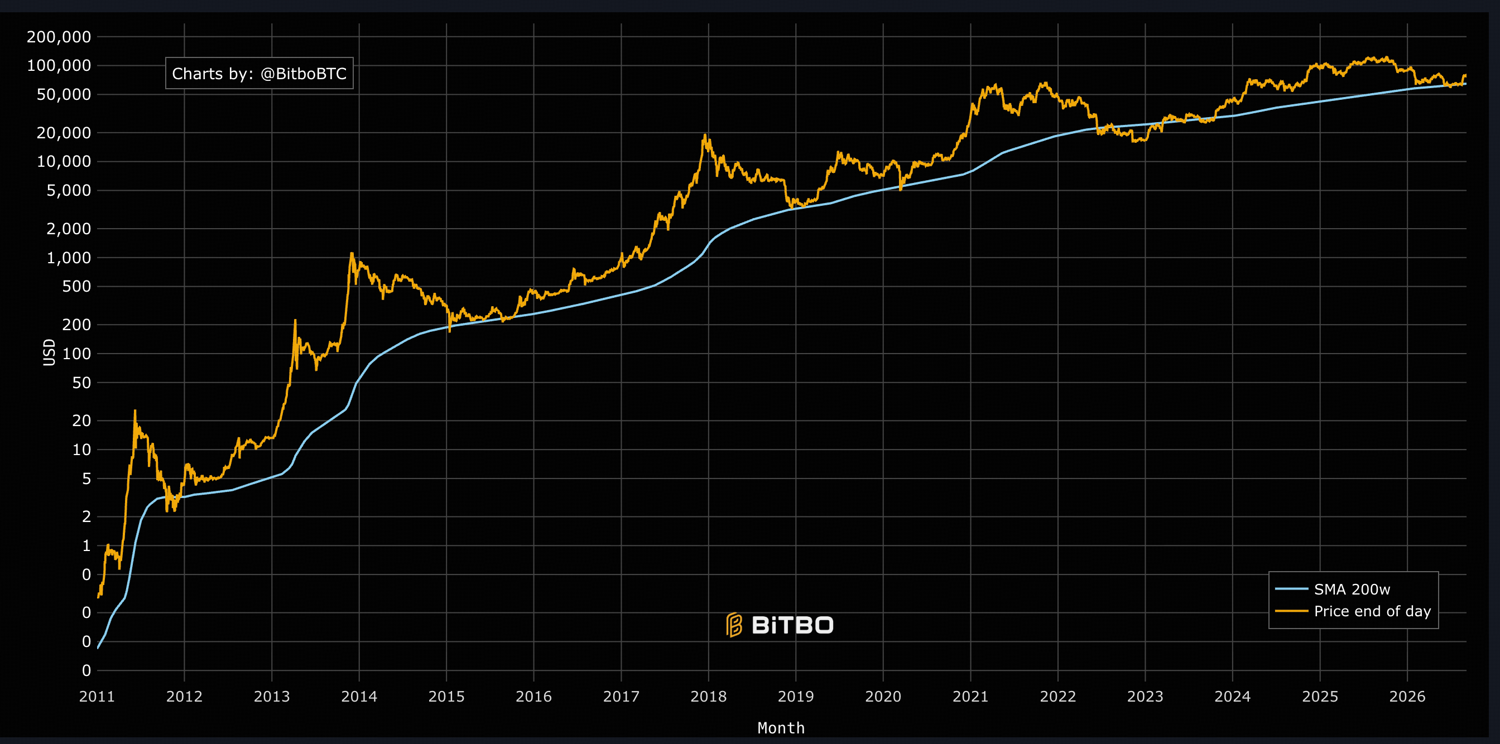
Bitcoin's 200-week moving average is unique because it has never declined on a weekly basis in its entire history, it has only ever gone up. That's because BTC's long-term growth has been so explosive that even its worst bear markets haven't lasted long enough to pull the four-year average lower.
Source: https://charts.bitbo.io/ma-200w/
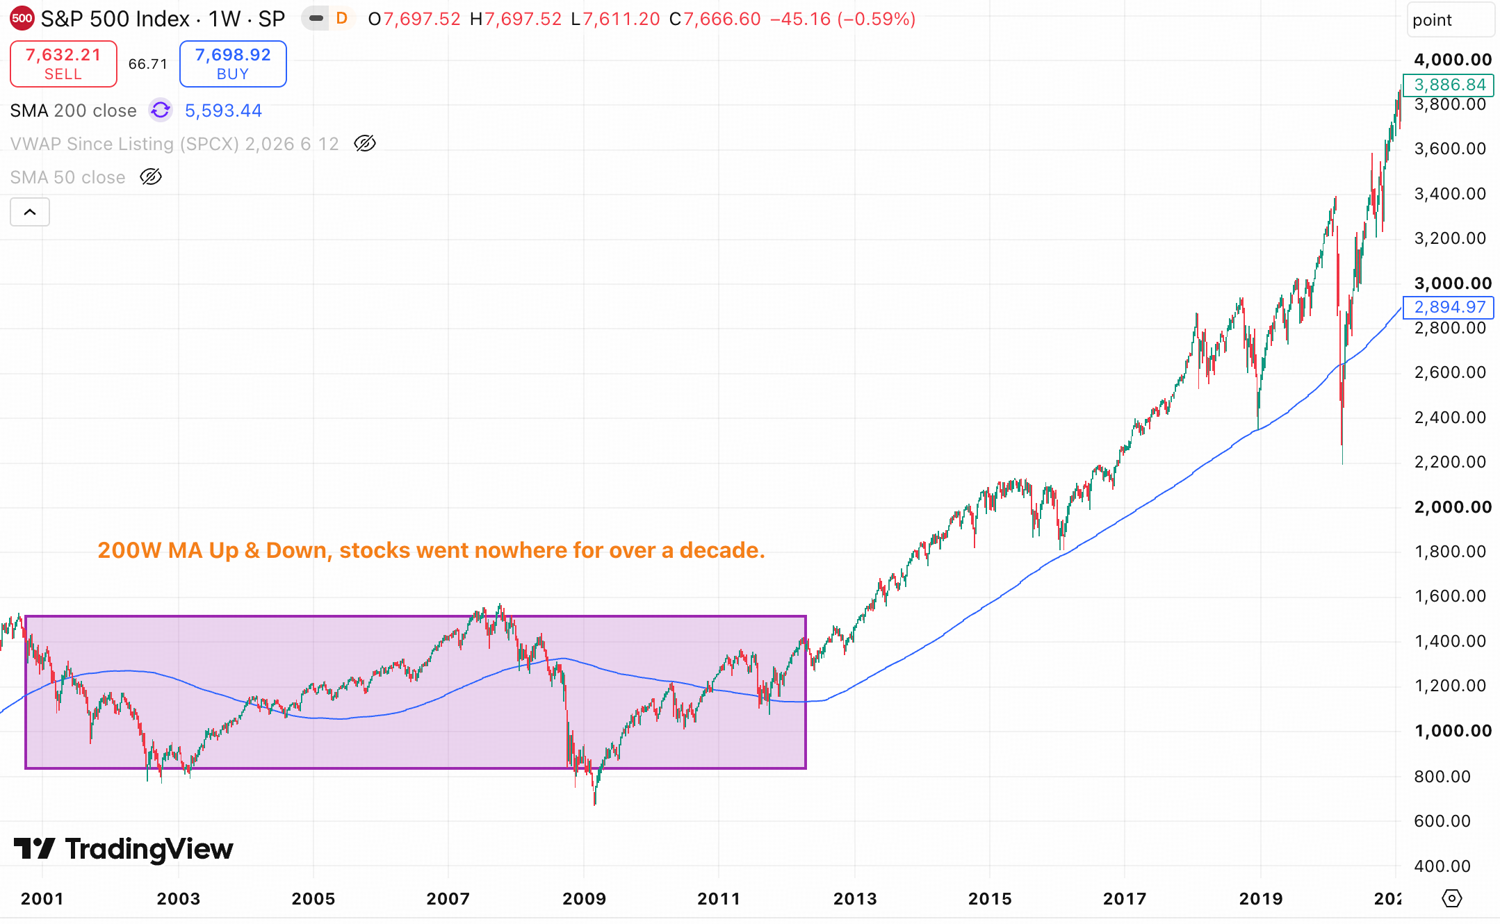
Traditional assets behave differently. The S&P 500’s 200-week moving average can flatten or decline during prolonged periods of weak returns. The index stagnated through the 1960s and 1970s as high inflation, rising interest rates, oil shocks, and weak economic growth compressed corporate valuations. It also struggled from 2000 to 2012, when the dot-com crash, the 2008 global financial crisis, and the subsequent slow recovery produced two major drawdowns within a decade.
S&P 500 went nowhere for over a decade
Source: TradingView
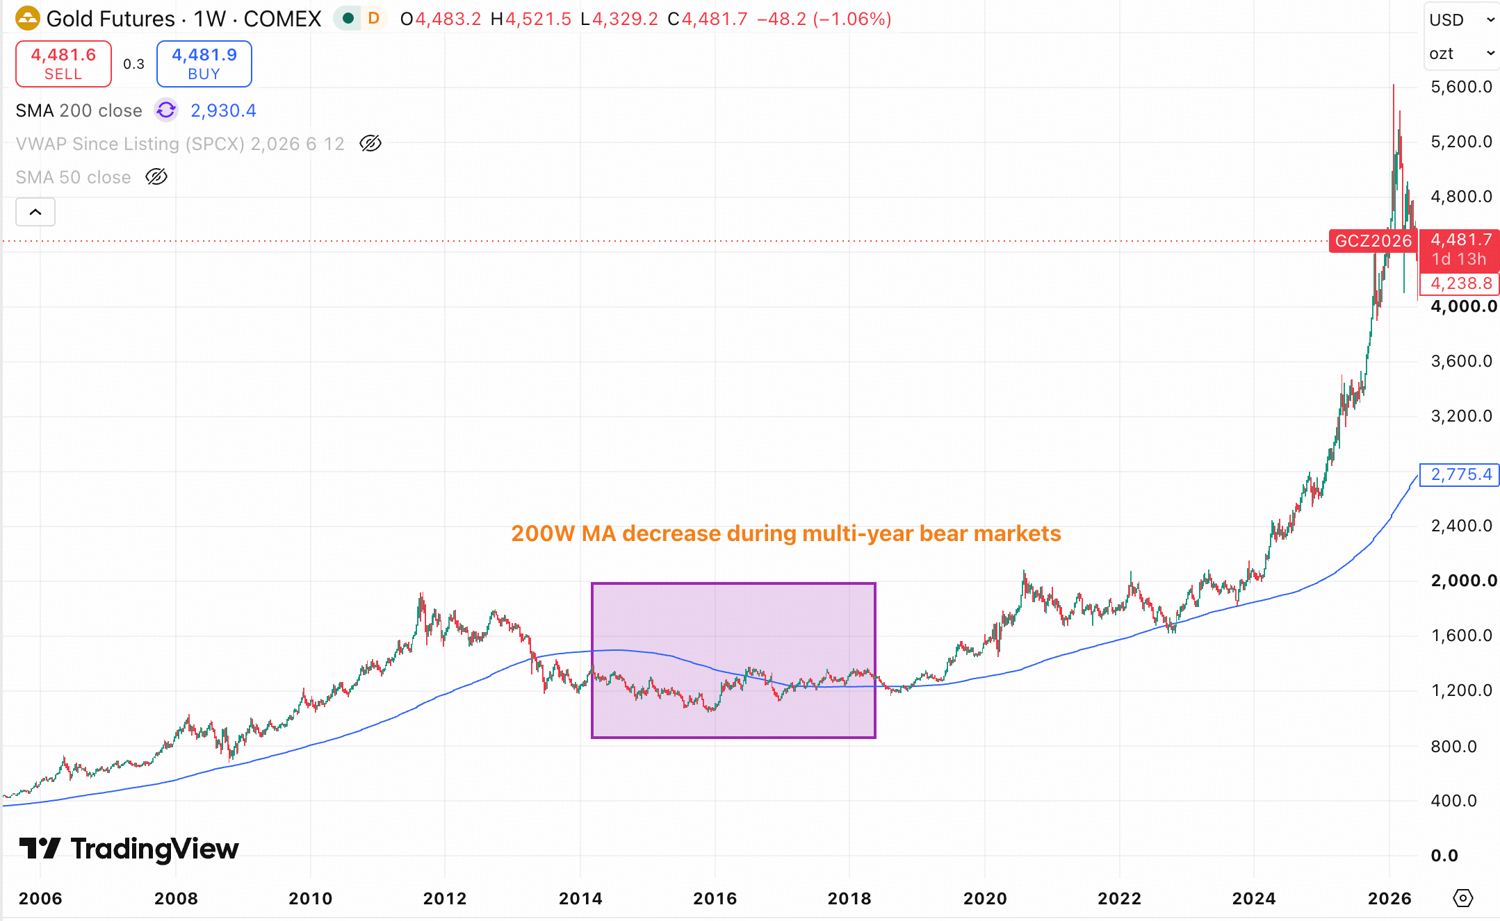
Gold shows the same behavior during extended bear markets. After peaking in 2011, gold declined for several years as the U.S. economy recovered from the financial crisis, real interest rates became less negative, the dollar strengthened, and investors reduced demand for crisis hedges. These forces kept gold below its previous highs and caused its 200-week moving average to flatten before eventually turning lower.
Gold 200W MA turned lower during 2010s
Source: TradingView
The "Bitcoin only goes up" meme basically comes from this 200-week moving average. People saw that this long-term trend line has never gone down in Bitcoin's history, and it became a shorthand for "no matter how bad the crashes get, the four-year average price keeps rising." It's the chart that visually proves the ultra-long-term uptrend.
The 200-Week Moving Average Sets the Floor
Bitcoin has historically spent very little time below its 200W MA, making sustained breaks beneath it relatively rare.
More importantly, the level has repeatedly coincided with major bear-market bottoms. Bitcoin came close to the 200W MA around the 2015 cycle low, bottomed almost directly around it in 2018, and briefly tested the area during the March 2020 crash.
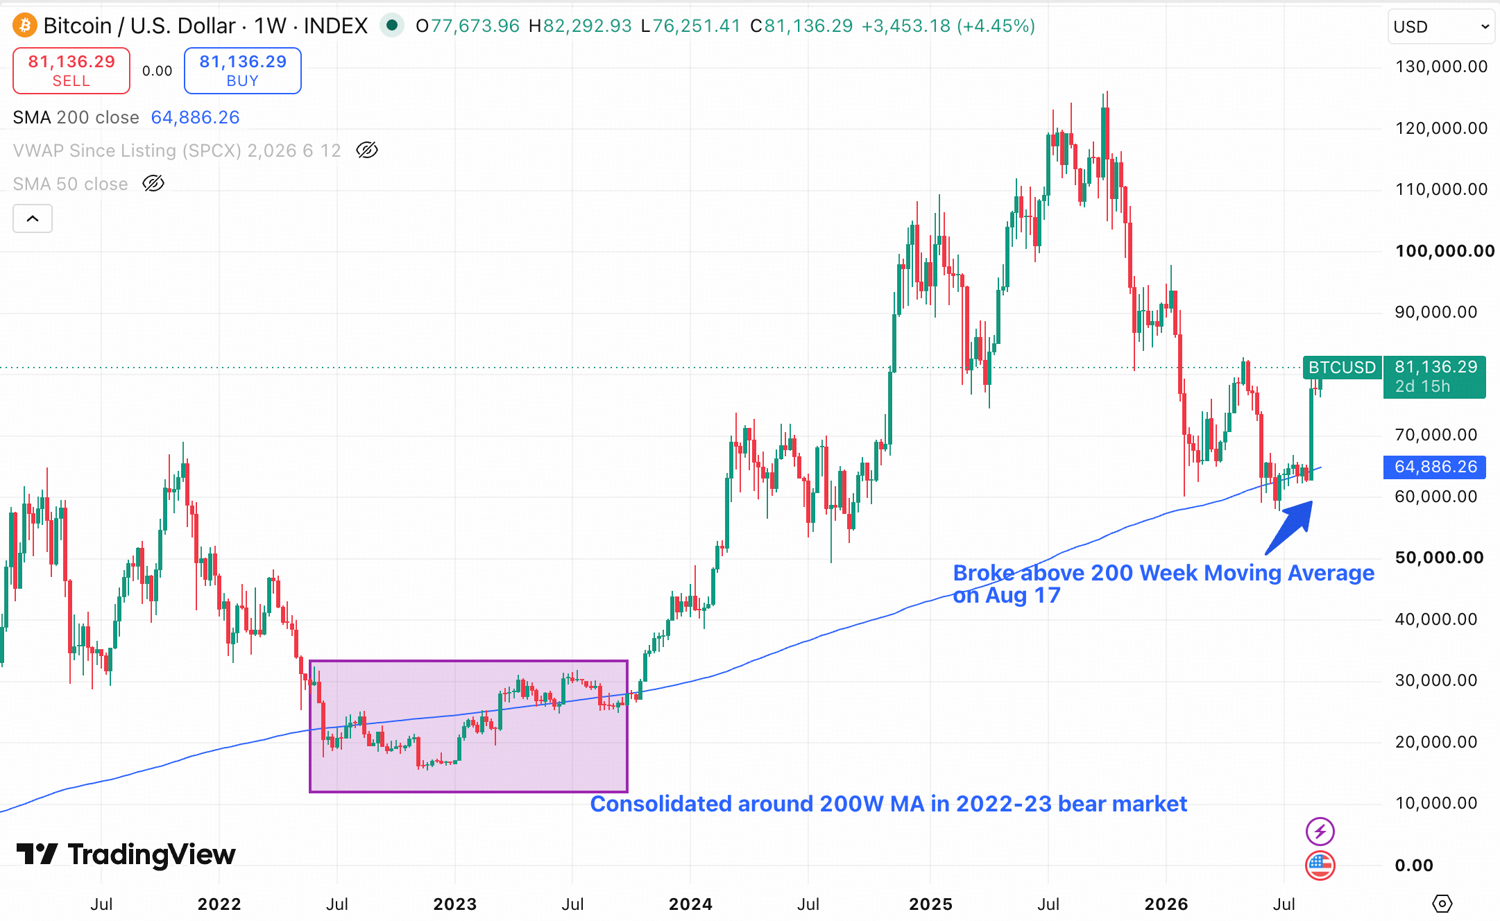
The 2022 bear market was the major stress test of this pattern. Bitcoin broke decisively below the 200W MA and remained below it for an extended period as the crypto industry moved through a series of deleveraging events and, eventually, the FTX collapse. The final cycle low formed below the moving average before Bitcoin ultimately reclaimed it.
Historically, when Bitcoin has reached the 200W MA and subsequently established a sustained recovery, the market has often been near the end of its broader bear-market process. The 2015, 2018, and 2020 tests were followed by powerful multi-year advances.
The timing, however, has varied considerably. A first touch does not necessarily mean the next bull market started. Bitcoin can consolidate around the level, retest it repeatedly, as 2022-2023 bear market demonstrated.
Source: TradingView
To confirm that a bear market has truly ended, however, another long-term trend line is equally important: the 50-week moving average.
The 50-Week MA: The Confirmation Signal
While the 200-week MA helps identify where a long-term bottom may form, the 50-week moving average (50W MA) is more useful for confirming when the bear market is actually ending.
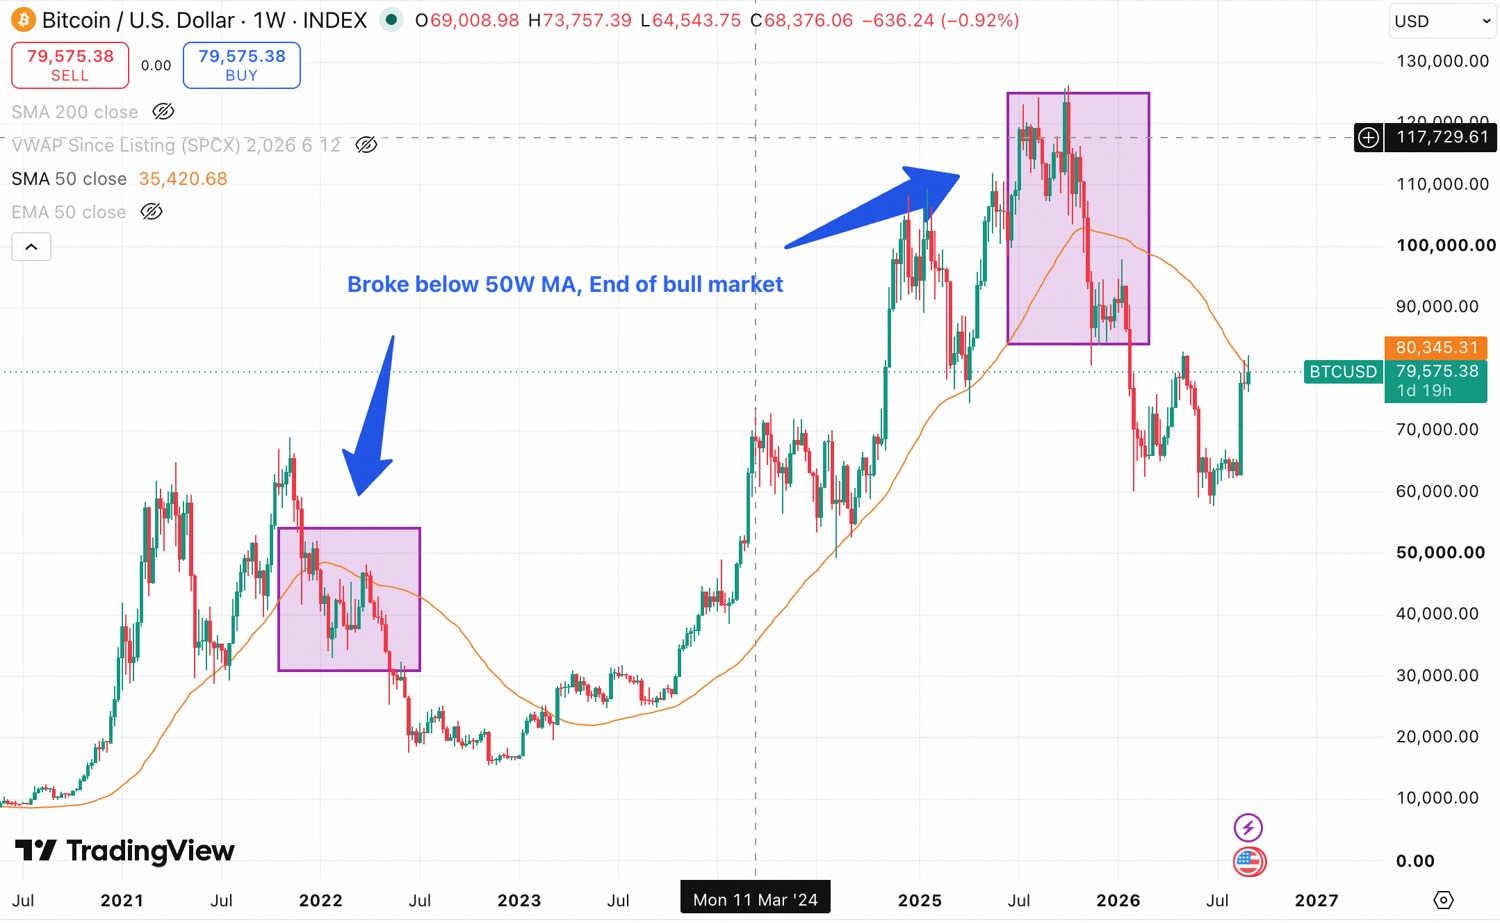
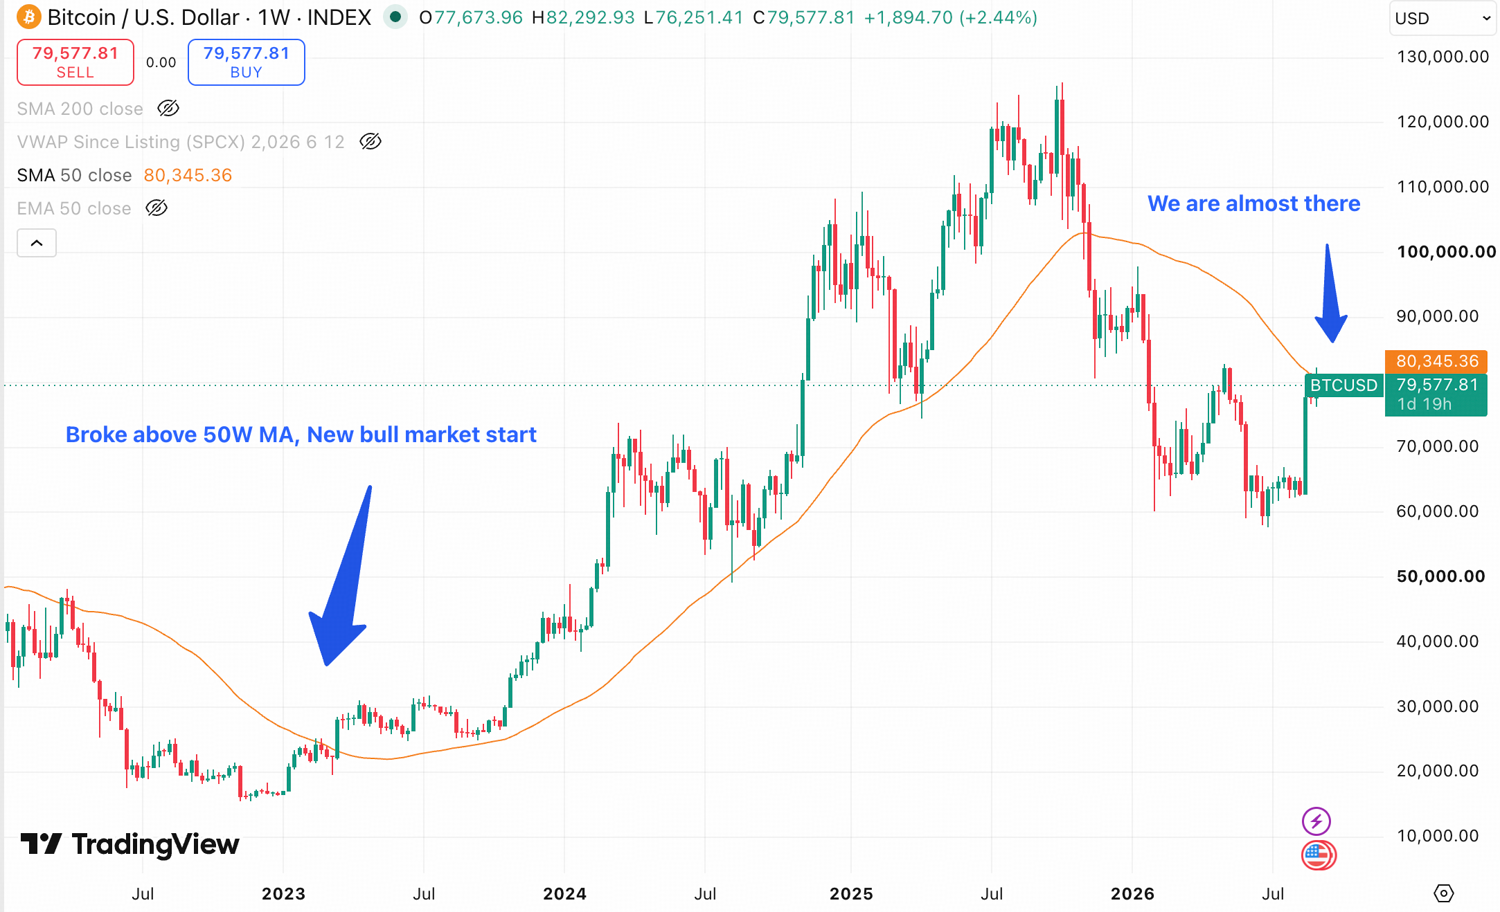
The 50W MA tracks roughly one year of price action, making it much more responsive to changes in market momentum. During bear markets, Bitcoin typically falls below the 50W MA and the moving average then becomes an important resistance level. Price may rally toward it several times, yet struggle to produce a sustained weekly close above it.
Historically, these breaks have aligned closely with Bitcoin’s major cycle transitions.
End of bull markets: Bitcoin’s loss of the 50W MA has accompanied the transition into major bear markets, including in 2014, 2018, late 2021, and late 2025.
Source: TradingView
Start of new bull markets: A sustained recovery above the 50W MA has historically provided much stronger evidence that the bear-market phase has ended. Similar transitions occurred in 2015, 2019, and 2023, when Bitcoin reclaimed the moving average after major drawdowns and subsequently established a new long-term uptrend.
Source: TradingView
This makes the 50W MA particularly useful as a confirmation indicator. While Bitcoin remains below it and repeatedly fails to reclaim it on a weekly closing basis, the broader bear-market structure remains intact. Once Bitcoin decisively closes back above the 50W MA and holds it as support, the probability that the cycle low has already been established rises substantially.
The trade-off is that this confirmation comes relatively late. By the time Bitcoin reclaims the 50W MA, price may already be well above the absolute bottom. The signal therefore sacrifices some upside in exchange for greater confidence that the underlying trend has changed.
Disclaimer: The information provided herein does not constitute investment advice, financial advice, trading advice, or any other sort of advice, and should not be treated as such. All content set out below is for informational purposes only.