
- Sentiment has reached extreme fear, while valuation and on-chain metrics sit above the levels recorded at the 2015, 2018, and 2022 lows.
- Every prior cycle bottomed below realized price. A move under roughly $54,000 is the minimum condition.
- The cycle bottom requires financial conditions to stop tightening: falling real yields, a weaker dollar, and receding Fed hike expectations.
Bitcoin fell to roughly $57,950 on July 1, 2026, its lowest level in about 21 months, and closed June down near 20%. The decline places price roughly 50% below the October 2025 peak.
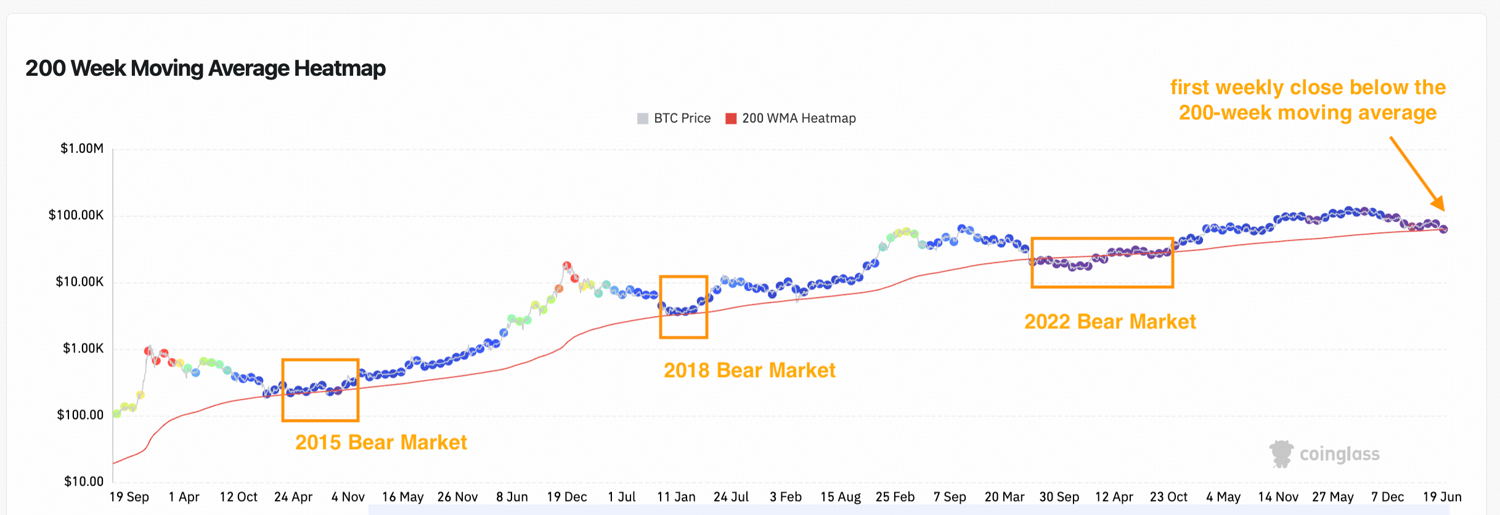
Late June also produced the first weekly close below the 200-week moving average. the average of the last 200 weekly closes, since 2023. The mood is bearish enough to feel like a bottom. The data says the bottom conditions are not in place.
The Technical Floor Sits Below Current Price
Three levels sit below current price: drawdown from the cycle high, the 200-week moving average, and realized price. None has reached its prior-bottom reading.
The first is drawdown from the cycle high, the percentage decline from the peak. The current decline of roughly 50% is shallow against prior cycle lows of 77% to 85%.
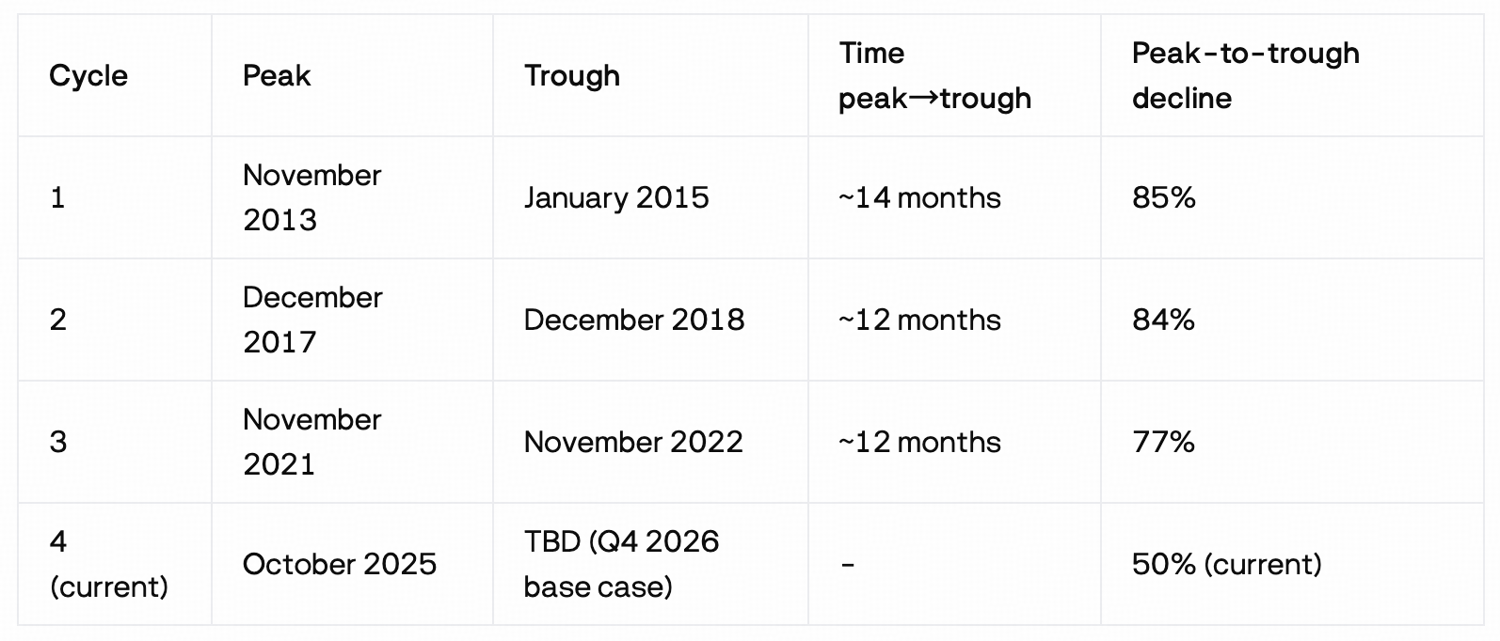
The second is the 200-week moving average, a long-term trend line that has historically acted as cycle bottom zone. This level marked the bottom at the 2015, 2018, and 2022 lows, and currently is in the $62K-$63K range. Price closed below it first time in late June 2026.
The 2015 and 2018 breaches were reatively brief. The 2022 cycle was the exception: price spent roughly 16 months below the line, from June 2022 to October 2023. The FTX collapse in November 2022 prolonged that stay, forcing sustained selling and turning the 200-week average into a resistance. This cycle carries no comparable credit event, so a breach of similar length is unlikely. But still, the break below 200W moving average will still extend beyond a single week.
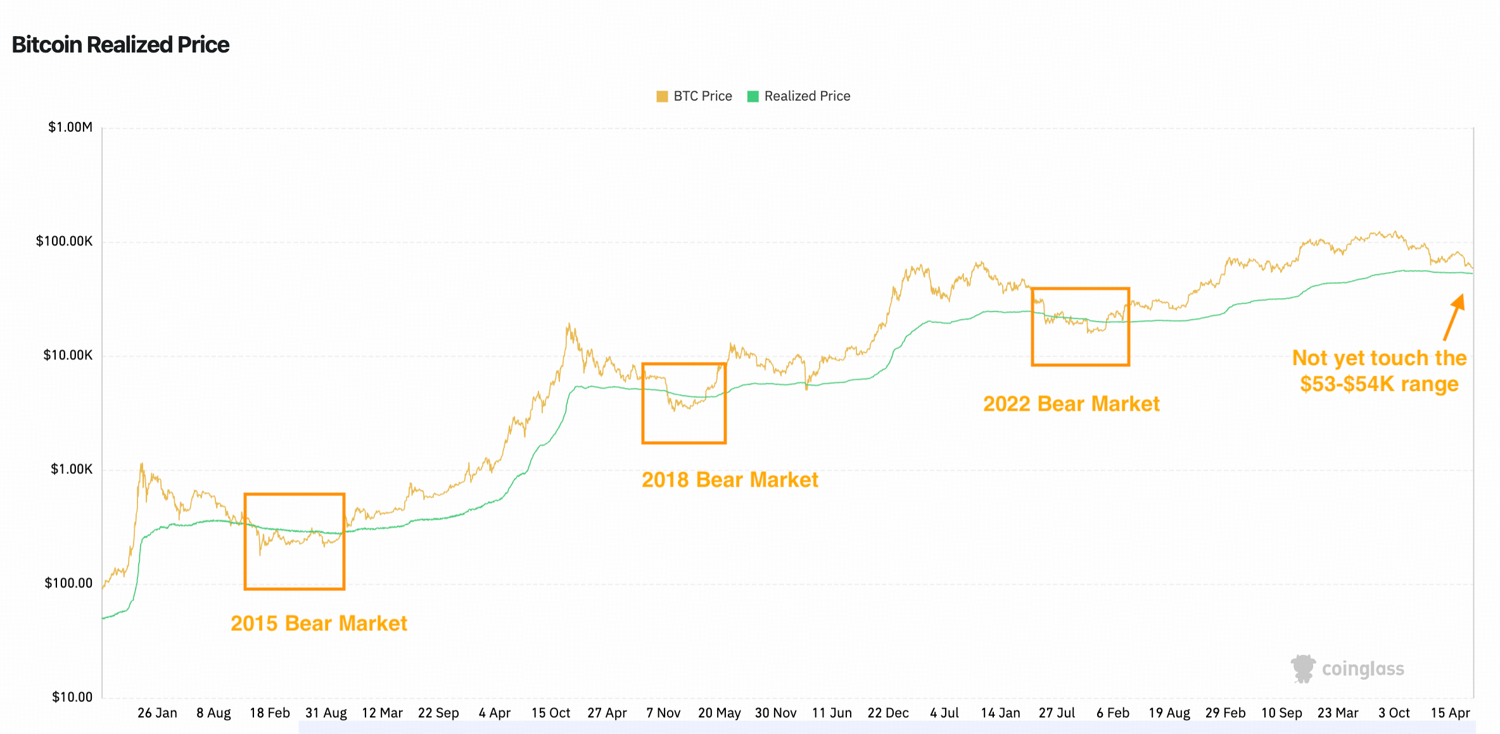
The third is realized price, the aggregate cost basis of the network, or the average price at which all coins last moved on-chain, which sits near $54,000 as of early July 2026. The metric matters because it converts price into a measure of aggregate profitability: when spot trades below realized price, the average coin is held at an unrealized loss, the condition of maximum holder stress that has historically exhausted forced selling and formed the base of each cycle.
Price has not yet touched this range. At every prior cycle bottom, it closed well below realized price. This is why many Bitcoin analysts have been flagging this level as a cycle-bottom target. The base case is a low that touches or modestly breaches the $53,000–$54,000 range, a shallow undercut in the low-$50,000s. That would be far milder than the 15%-28% realized price breaches seen in prior cycles. A deeper move toward the mid-$40,000s would require a forced-seller event on the 2022 FTX collapse scale. (We view this as a tail risk rather than the base case. The clearest candidate would be Strategy: if it were forced to liquidate Bitcoin to meet its debt, preferred equity, or other financing obligations, the resulting supply shock could produce a capitulation comparable to the 2022 FTX-driven selloff)
The Macro Floor Depends on Easing Financial Conditions
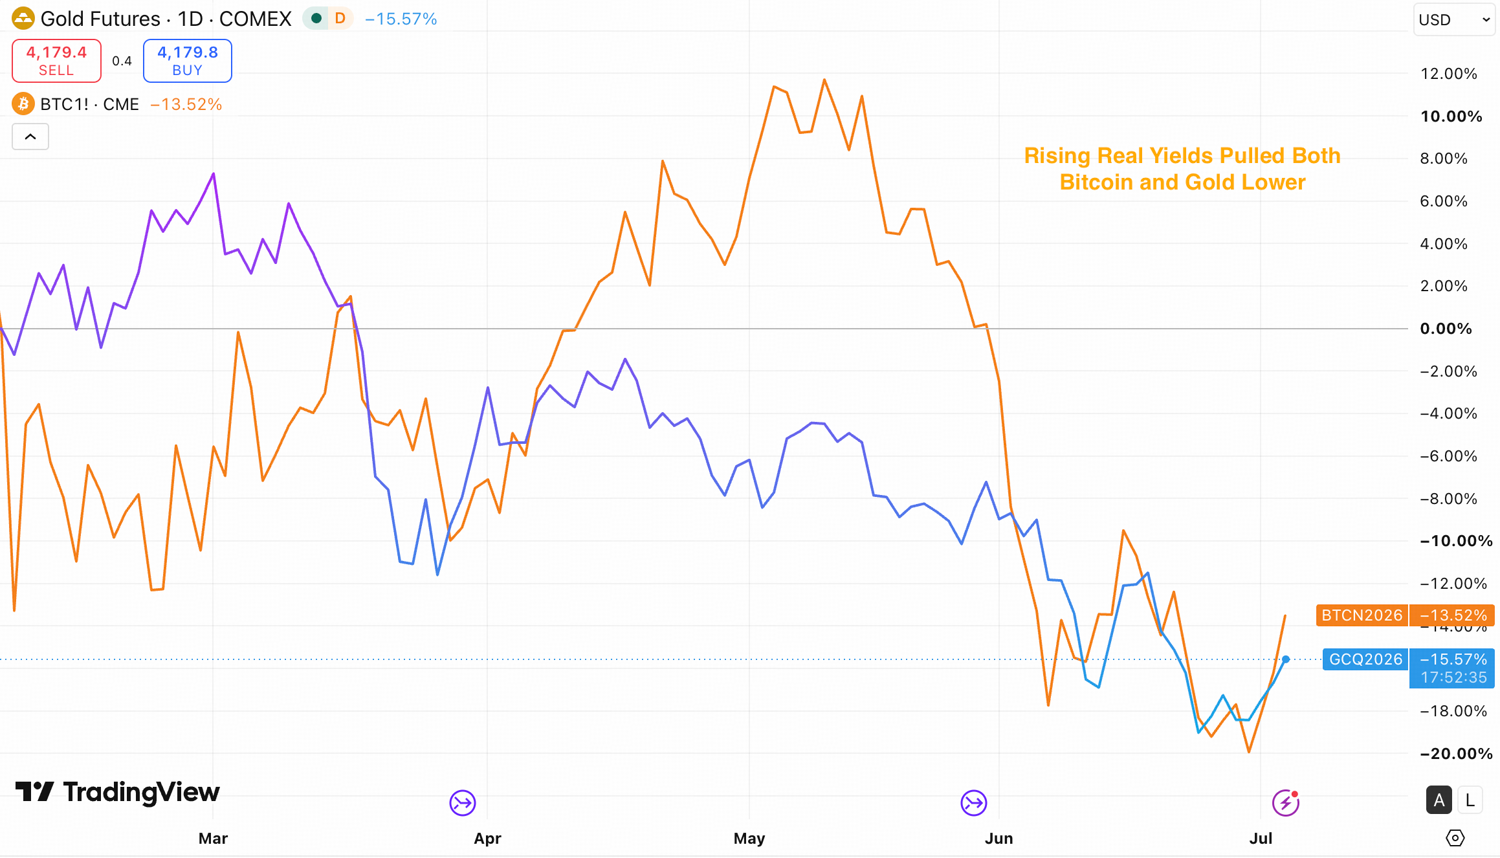
Price levels alone do not set the low. Macro conditions also matter, especially for non-yielding assets. Just like gold, bitcoin is also a non-yielding asset, which is both highly affected by the real interest rate. When real yield rises, the opportunity cost of holding a zero-yield asset rises. Both assets moved a similar path in the first half of 2026, gold posted its worst quarter since 2013 as real yield climbed, and bitcoin sold off alongside.
Real yields, measured by inflation-adjusted Treasury yields, remained restrictive through the first half of 2026. The 5-year TIPS yield rose from around 1.3% in early May to 1.98% in early July. The dollar index (DXY) held firm over the same period. Fed hike expectations turned restrictive: at Kevin Warsh's first meeting as chair on June 17, 2026, the committee held at 3.50–3.75% while the dot plot lifted the median year-end rate projection to 3.8%, up from 3.4% in March, and the market began pricing a hike by year-end.
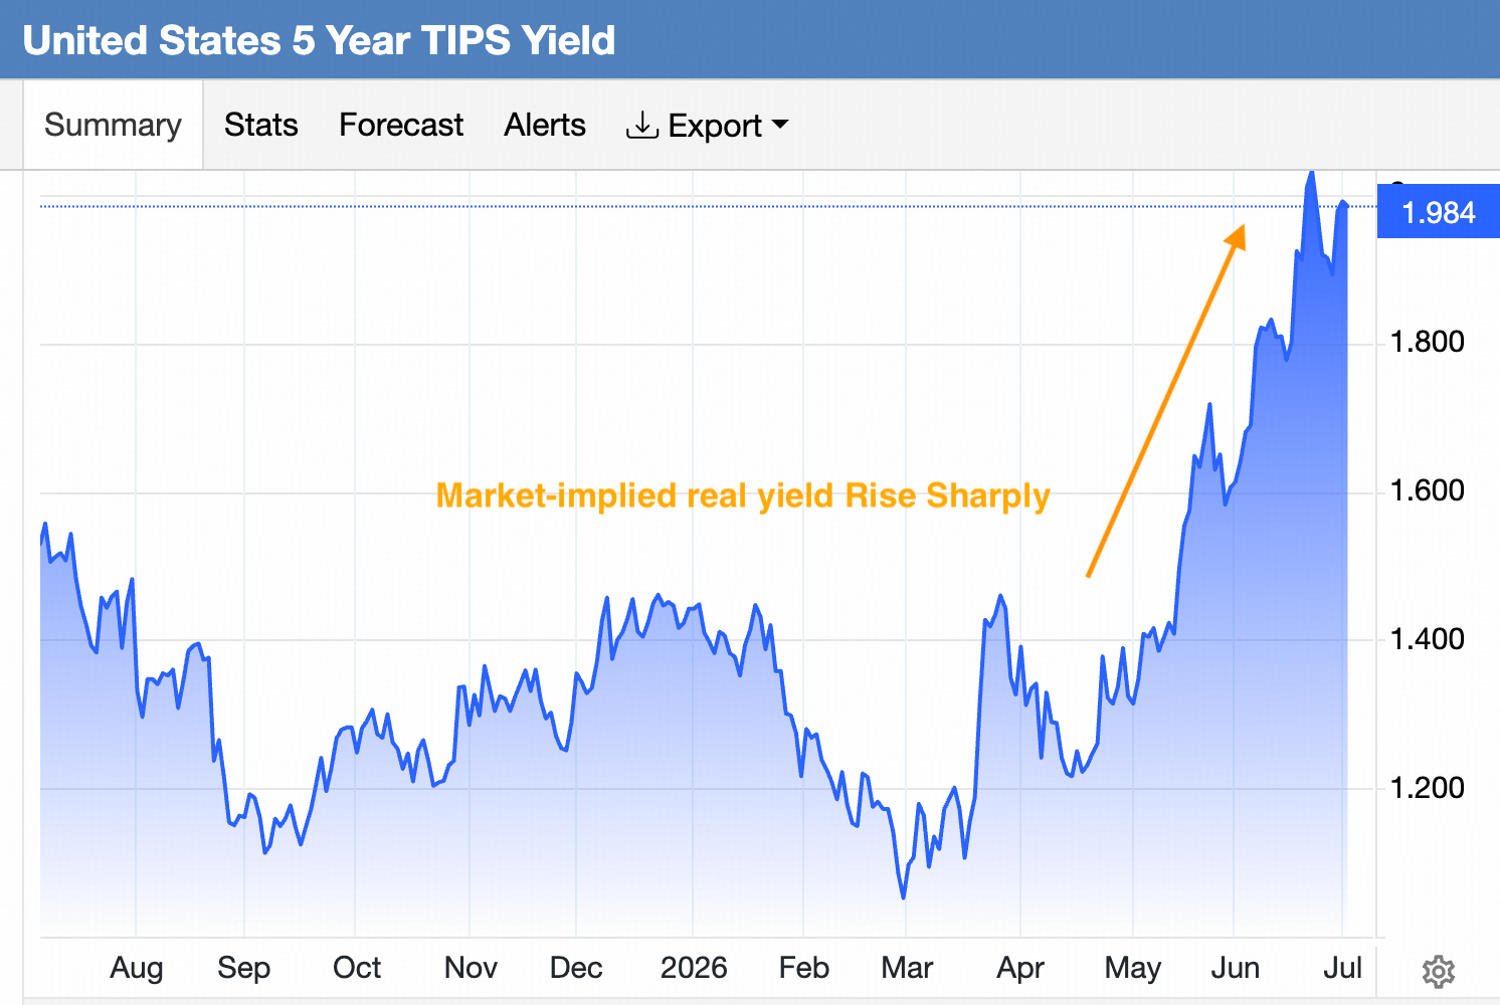
The sharp drop in Bitcoin coincided with the rise in real rates since May.
However, we view the dot plot's shift reflects an energy shock rather than broad price pressure. The 2026 Iran war and the closure of the Strait of Hormuz drove Brent crude above $120 at its spring peak and lifted May CPI to 4.2% year-on-year. That shock is now reversing: a US–Iran ceasefire has restored Strait shipping toward pre-war volumes, and Brent has fallen back near $70 as of early July 2026, close to its late-February level.
As the energy impulse fades through the second half of 2026, the rate-hike expectation embedded in the dot plot should fade with it.
Bottom Line
Bitcoin's June low near $58,000 does not meet the conditions that marked prior cycle bottoms. The minimum condition is a close below realized price, in the $53,000–$54,000 range, and history shows price can hold below that level for months. The timing of the bottom price will likely align with the Q4 2026 window and requires financial conditions to stop tightening.
In the near-term, real yields and rate-hike fears remain elevated, ETF flows are negative, and the on-chain indicators reset is incomplete. That combination points to a final leg of weakness that carries price below the $53,000–$54,000 realized-price range, and reset all on-chain indicators.
As the energy-driven inflation impulse fades through the second half of 2026, rate-hike expectations recede, the dollar softens, the debasement bid will returns to Bitcoin and gold.
Disclaimer: The information provided herein does not constitute investment advice, financial advice, trading advice, or any other sort of advice, and should not be treated as such. All content set out below is for informational purposes only.