
Summary
- Bitcoin is holding above $80K as selling pressure eases. Buyers have returned near this level, whales have shifted from selling to accumulation, and profit taking has slowed. These changes are helping Bitcoin hold up despite the broader market selloff.
- Fresh demand remains weak. Bitcoin’s apparent demand is still negative, ETF flows reversed with $635M in outflows on October 22, and CEX stablecoin reserves continue to decline. Spot buying and institutional demand have yet to show a sustained recovery.
- The next key test is $85K to $87.5K. Heavy spot sell orders and short liquidation clusters sit in this range. A drop below $80K could bring $77.6K into focus. The October 28 Fed decision will be next week’s main event.
It’s been a sea of red in the markets this week. AI stocks took a beating, and even spot gold fell below the $4,000 mark. But Bitcoin (BTC-USDT) is still holding above $80K.
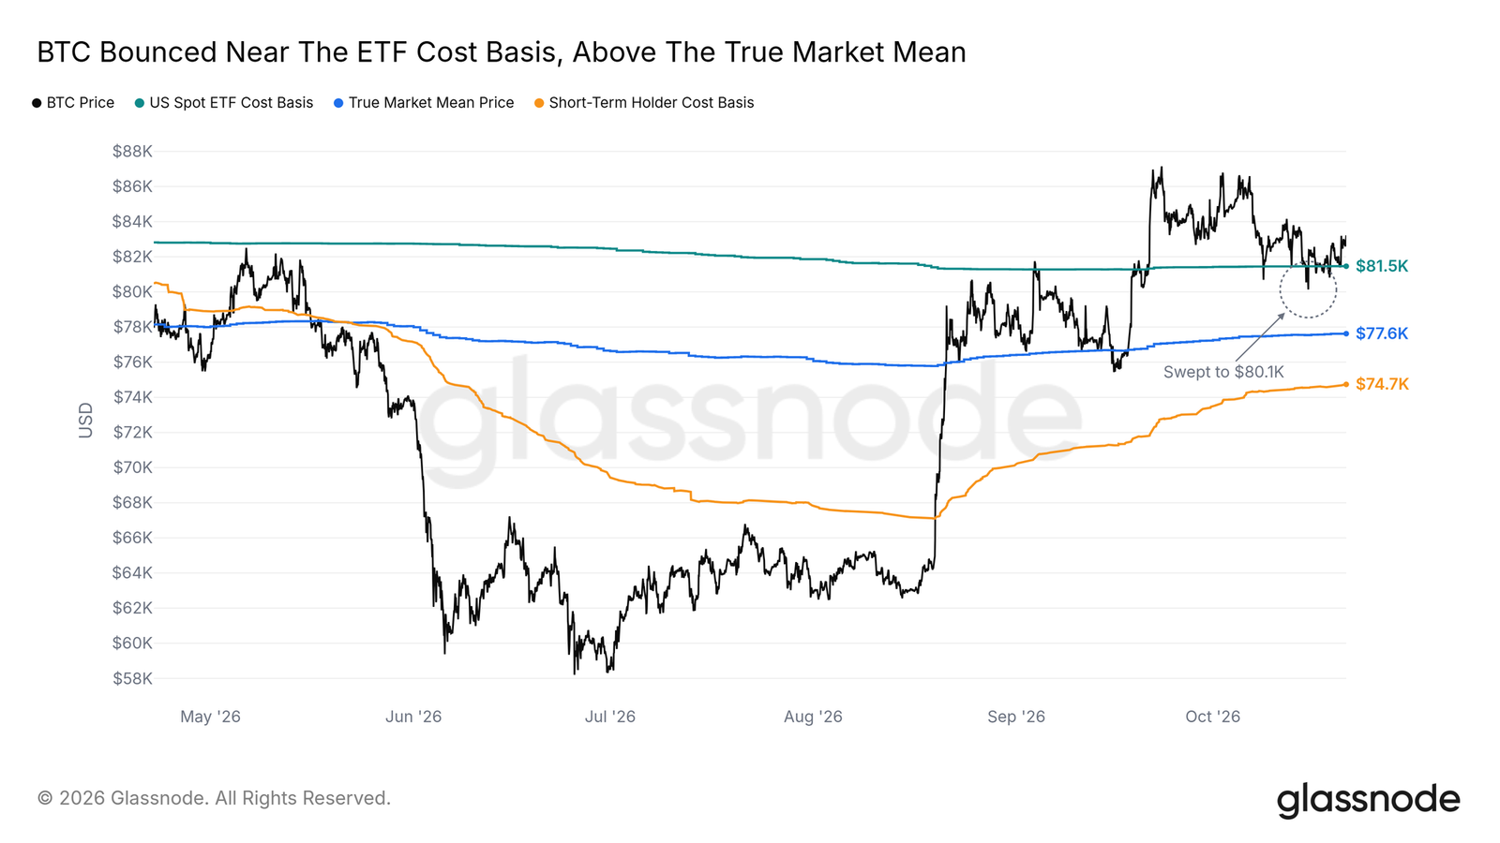
The $80K to $81.5K range is where U.S. spot Bitcoin ETFs and corporate Bitcoin holders have their average cost basis. Onchain data is also showing whales buying again and selling pressure easing. But fresh demand is still weak, and stablecoin reserves on major exchanges have been falling.
So what’s keeping Bitcoin afloat, and what will it take to push prices higher?
Why Is Bitcoin Holding Above $80K?
A few things stand out in the latest market data:
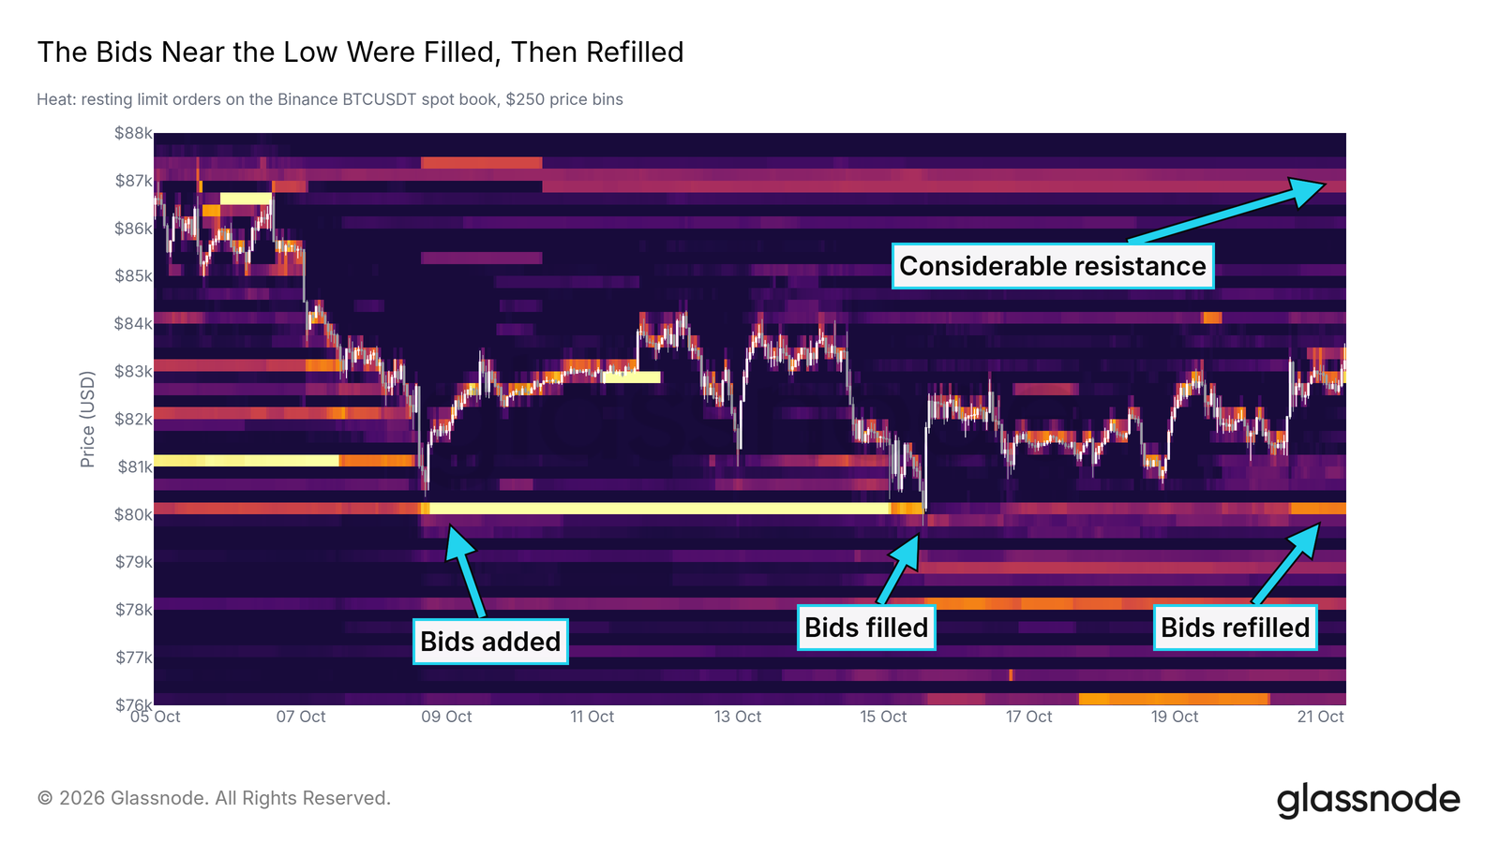
- Buyers are still willing to step in around $80K. As the chart below shows, the October 15 selloff wiped out most of the buy orders near this level. But by October 20, new orders had already appeared. The bids are smaller than before, but buyers haven’t walked away.
- Bitcoin whales are buying again. Holders with 1,000 to 10,000 BTC have shifted their 60 day net accumulation from negative 62,600 BTC to positive 5,230 BTC. Holders who bought Bitcoin 1 to 2 years ago have also slowed their selling, with daily BTC transfers falling to less than a third of their early October level.
- Profit taking is cooling down. Onchain realized profits over the past week have fallen to roughly half the level seen during September’s peak, as shown in the chart below. Fewer holders are rushing to lock in gains, helping ease the selling pressure on Bitcoin.
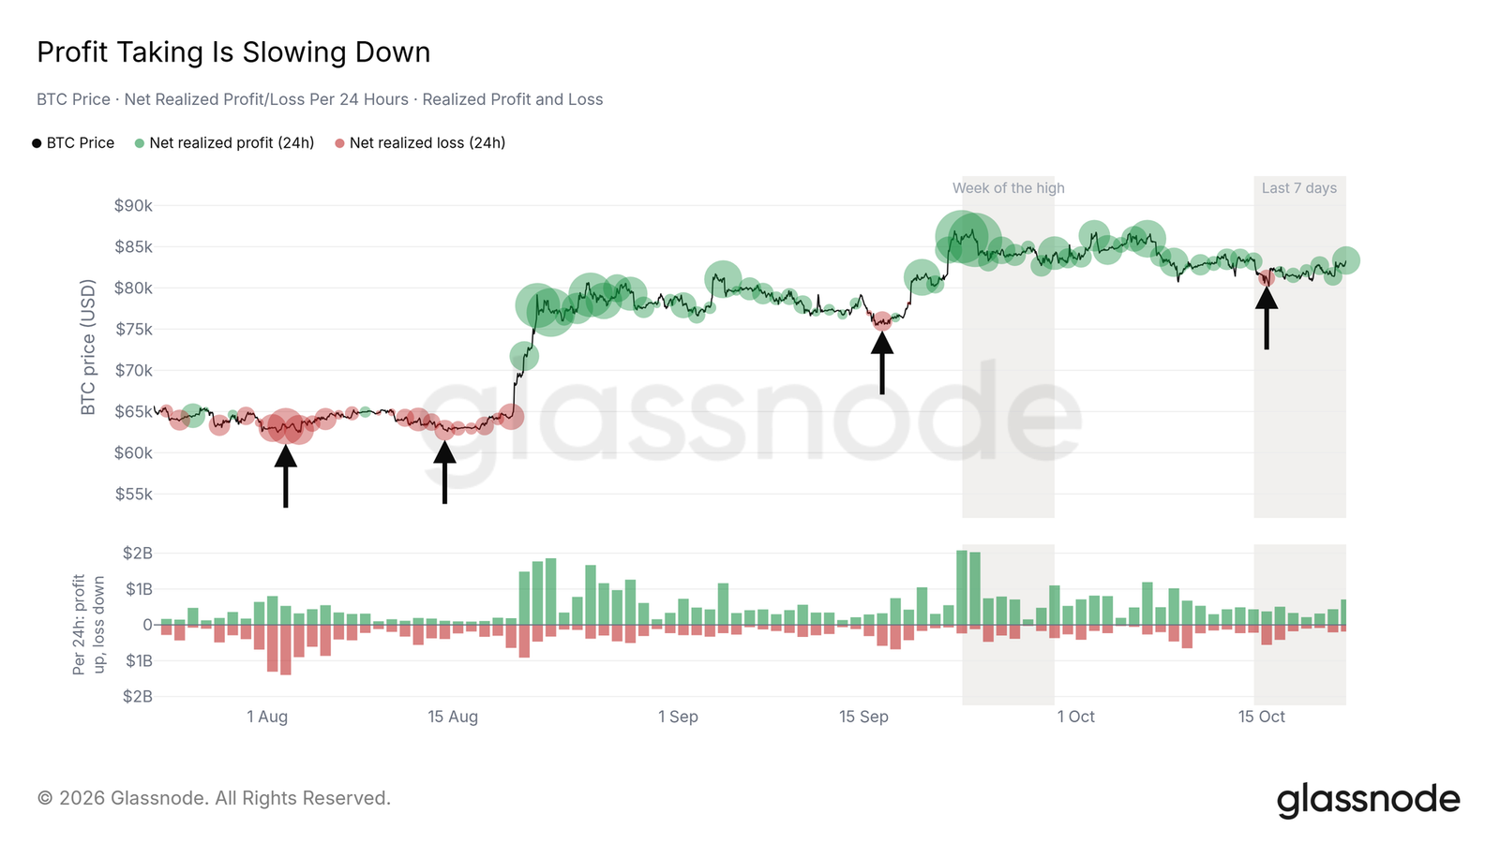
Bitcoin holders are selling less, and buyers are still stepping in around $80K. That’s helping prices stay afloat for now. But a market with fewer sellers still needs fresh buyers to move higher.
Where Are the Buyers?
Selling pressure is easing, but demand remains weak. The latest data shows that spot buying, ETF flows, and exchange liquidity are all struggling to recover.
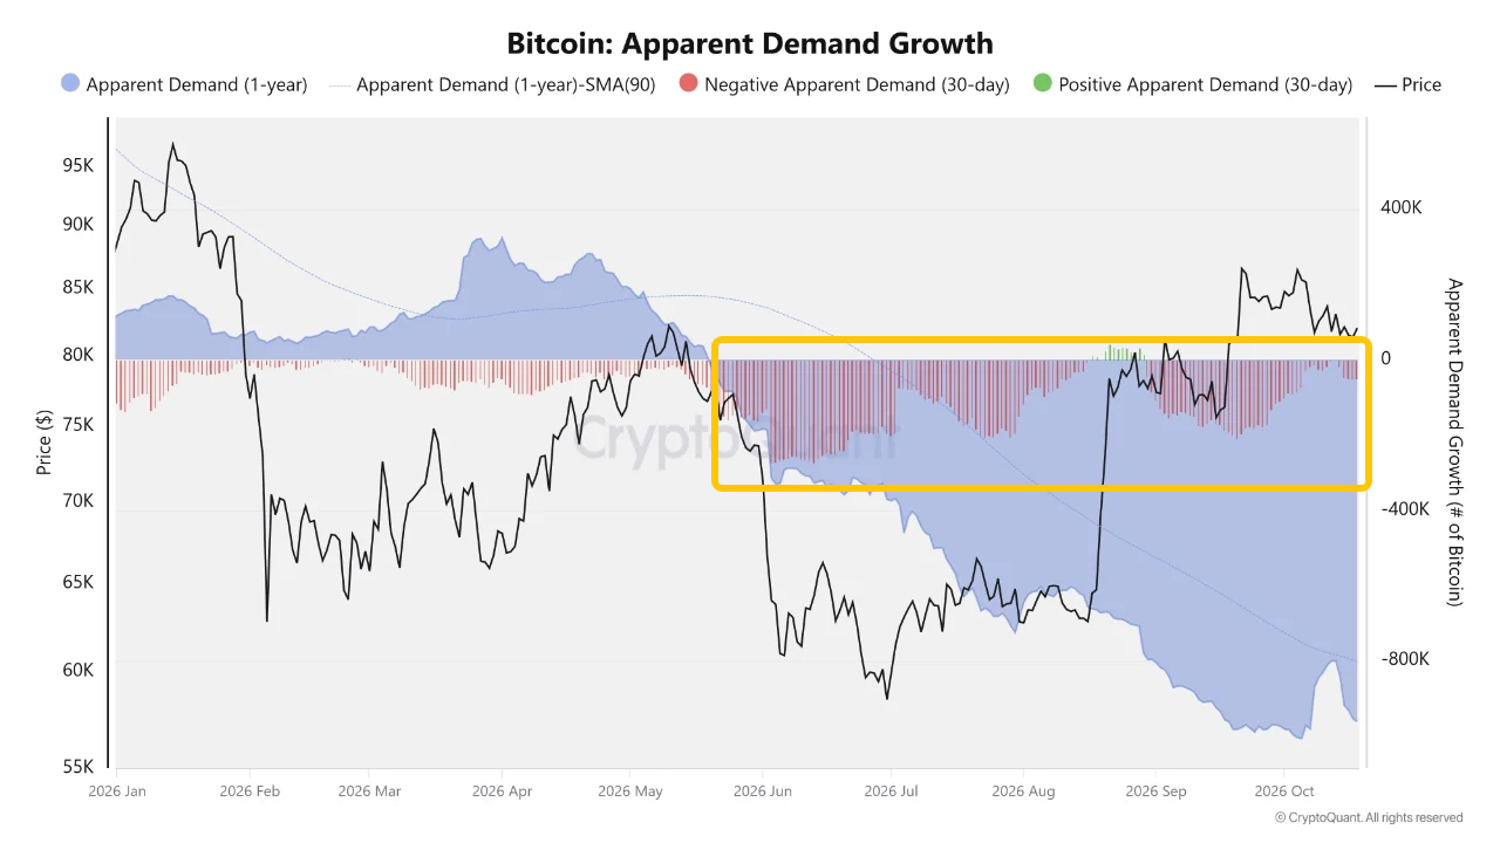
- Spot demand is still weak. As the chart below shows, Bitcoin’s 30 day apparent demand has improved but remains negative. The Coinbase Premium Index has also stayed below zero, showing that U.S. buying demand remains soft. Meanwhile, STH-SOPR is still just below 1, meaning short term holders are selling at small losses. Spot demand has yet to show a convincing recovery.
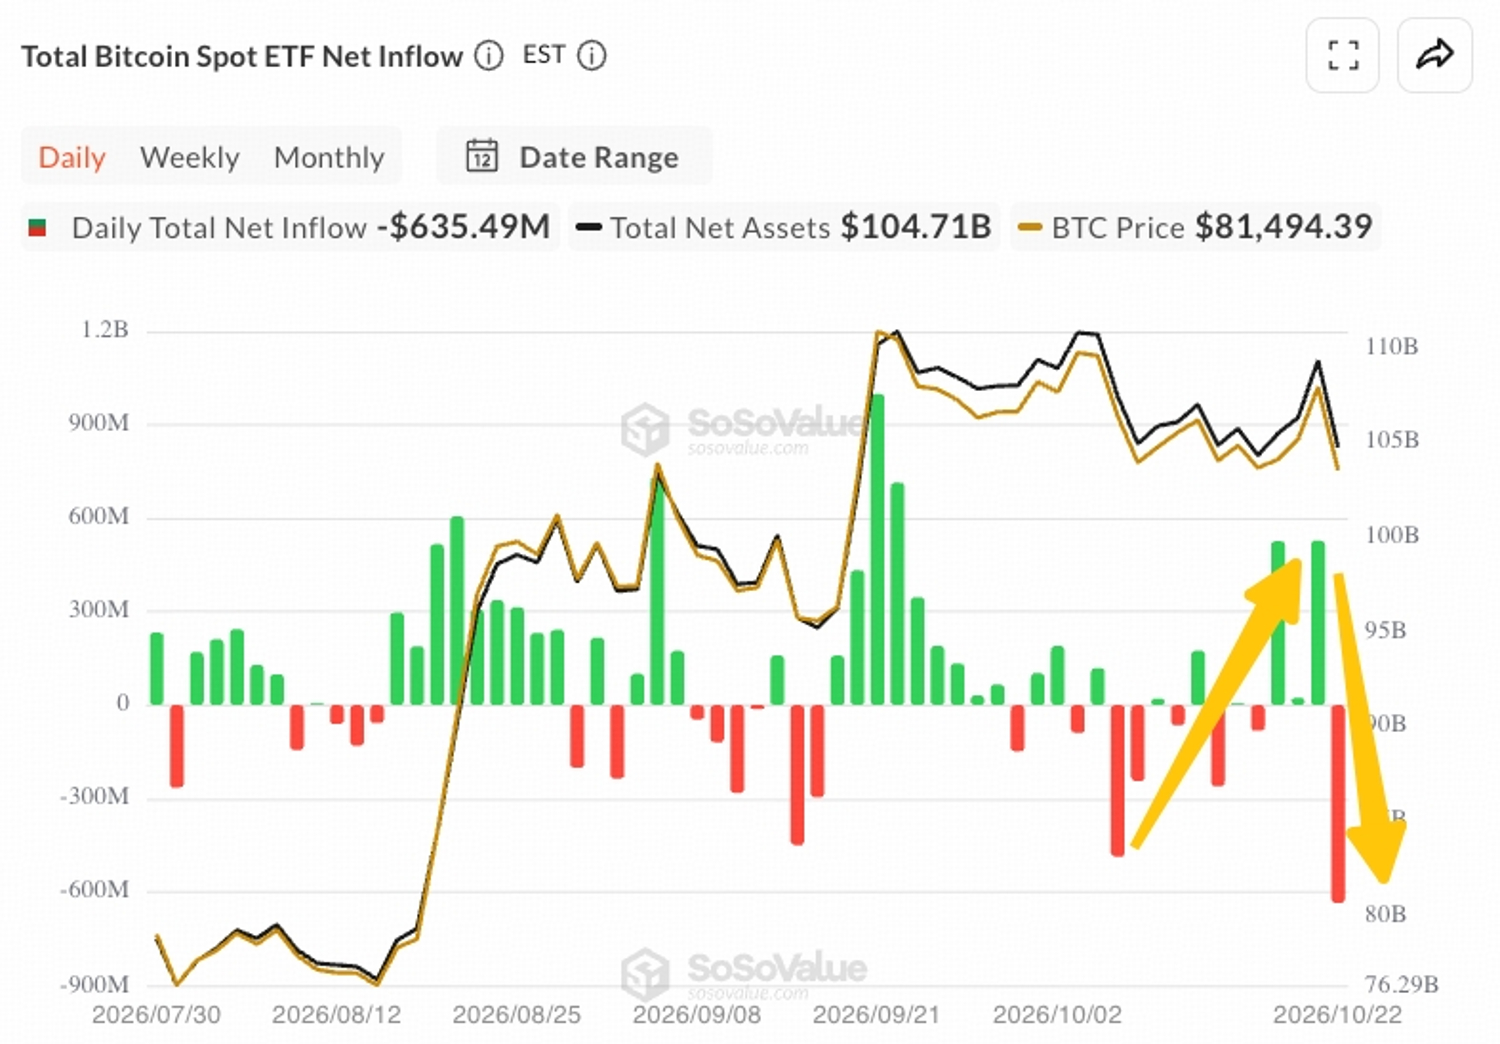
- ETF inflows have lost momentum. Bitcoin ETF flows had started to improve in October. But on October 22, Bitcoin ETFs saw roughly $635M in net outflows, their biggest daily loss since June 25. The recent inflows haven’t been consistent enough to signal a real recovery in institutional demand.
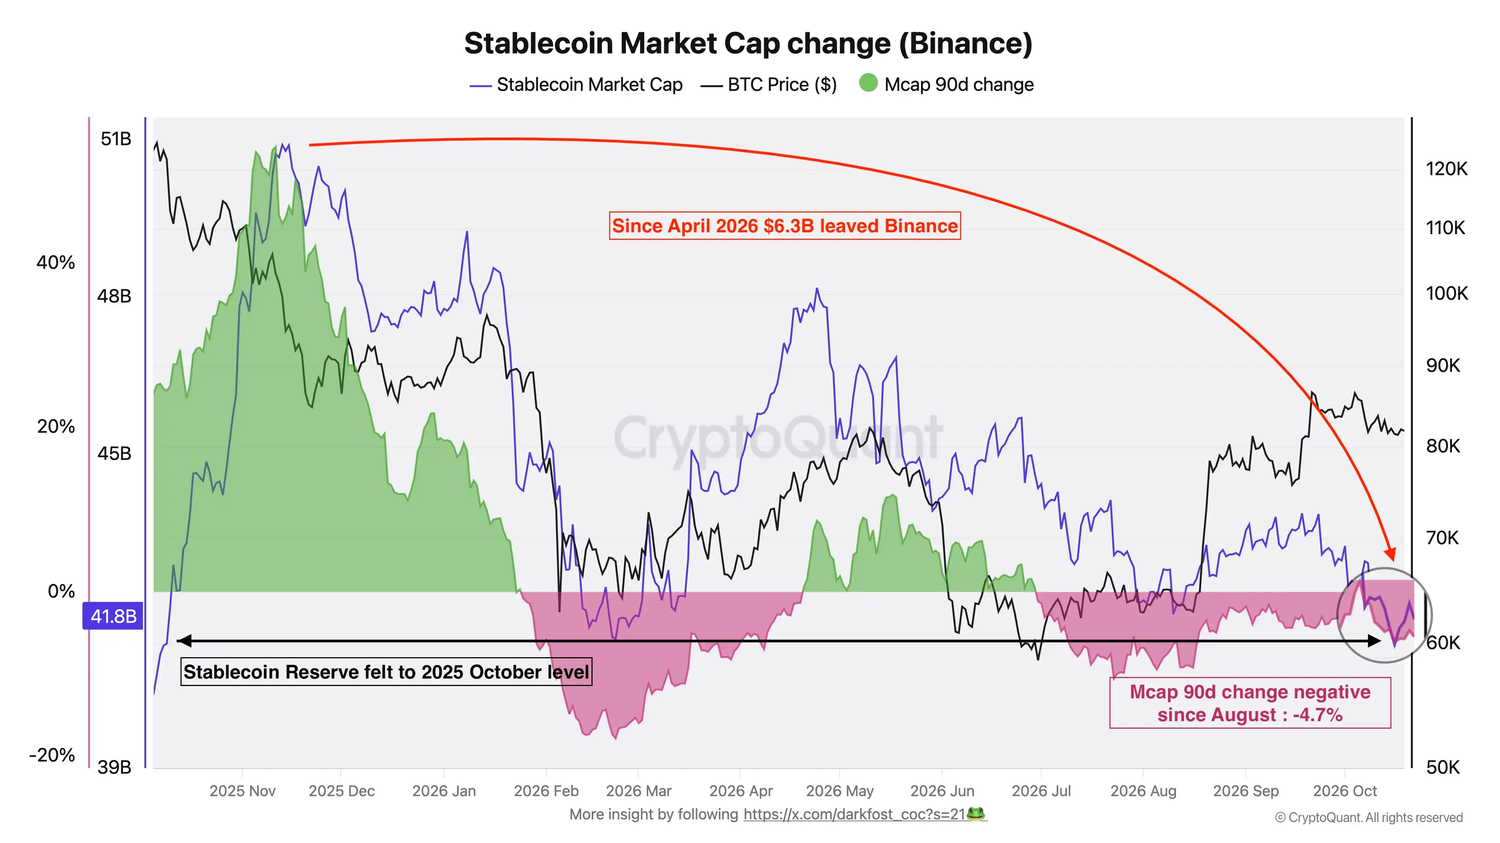
- Stablecoin reserves on CEXs are declining. Binance’s stablecoin reserves have fallen to $41.6B, their lowest level this year, down $6.3B since April. Other exchanges have also seen billions in stablecoin outflows, as shown below. The decline points to weaker liquidity available for spot buying on CEXs.
For now, the recovery in demand remains patchy, with no clear sign of sustained buying across spot markets, ETFs or exchanges.
What Will It Take to Break Higher?
Bitcoin (BTC-USDT) is now trading between 2 important price zones. Here’s what to watch on both sides:
Above $80K: The next resistance sits between $85K and $87.5K.
- $85K and $87K: The two largest short liquidation clusters. Short liquidations around these levels could give Bitcoin an extra push higher.
- $86.5K to $87.5K: Heavy spot sell orders are waiting here, adding resistance to any recovery.
- $86.7K: The average cost basis of investors who bought Bitcoin six to twelve months ago. A move above this level would bring these holders back to breakeven on average.
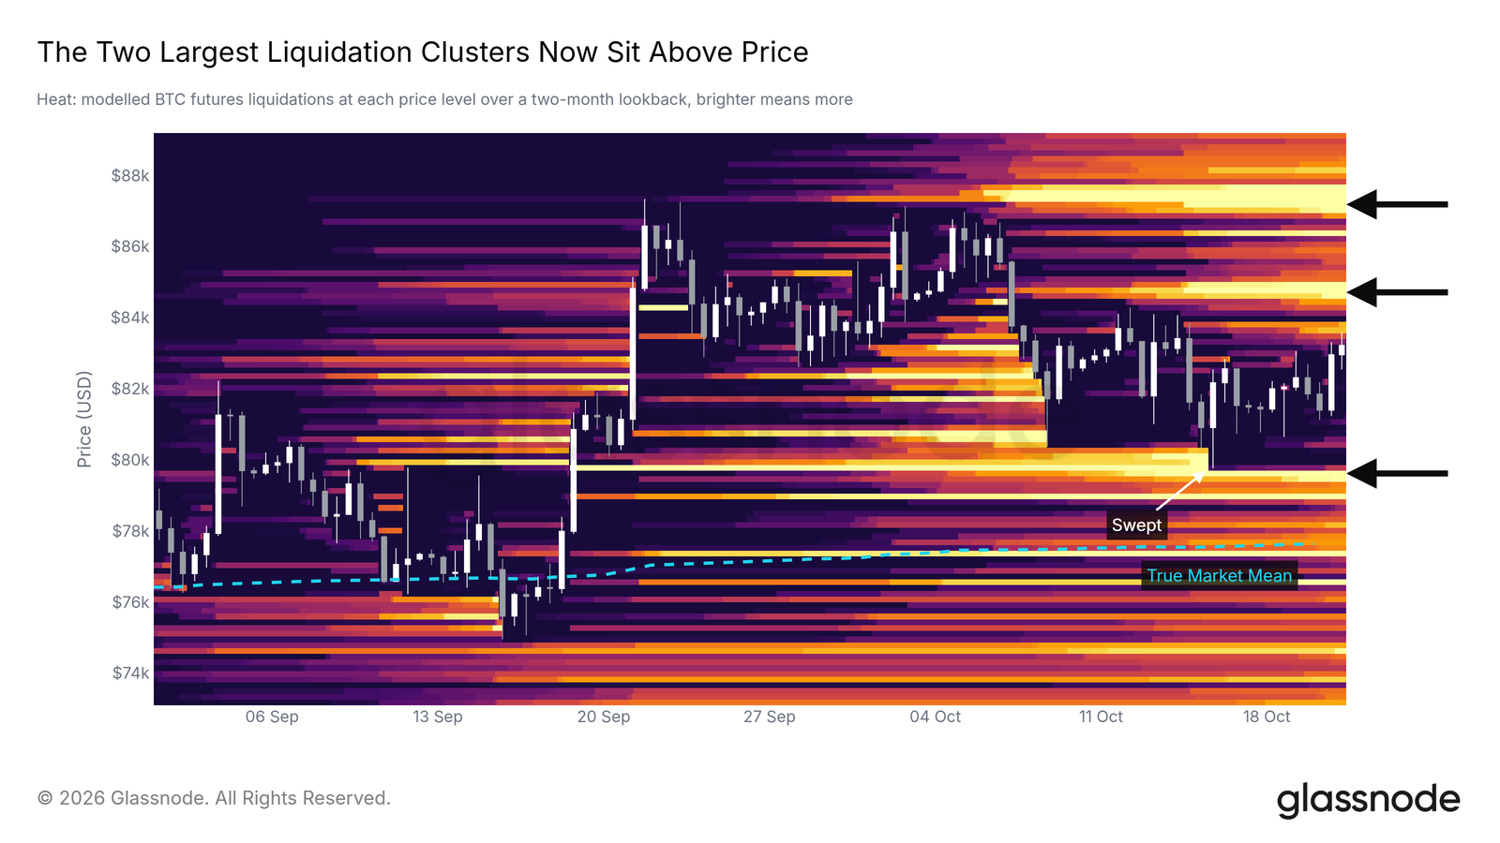
Below $80K: The next level to watch is $77.6K.
- $80K: A daily close below this level would put ETF and corporate Bitcoin holders back into losses on average.
- $77.6K: Bitcoin’s True Market Mean, which reflects the average cost basis of economically active coins. This could become the next area of focus if $80K fails.
Week Ahead
- Oct 28: FOMC Rate Decision
- Oct 29: US Q3 GDP
- Oct 29: US September PCE Inflation
The October 28 Fed decision could be the next major catalyst. Markets are pricing in over a 90% chance that the Fed will hold rates steady on October 28, but the odds of a December hike are already above 70%.
With September CPI coming in hotter than expected, the real focus will be on Fed Chair Kevin Warsh’s comments, especially whether another hike is coming in December and how the Fed views the inflation pressure from rising oil prices.
Disclaimer: The information provided herein does not constitute investment advice, financial advice, trading advice, or any other sort of advice, and should not be treated as such. All content set out above is for informational purposes only.