- Gold’s 27% drawdown from the January peak reflects a sharp unwind in the rate-sensitive layer of the market, the deeper structural bid has softened cyclically, but the core thesis remains intact.
- Real rates still matter for marginal pricing, especially when positioning is crowded, but fiscal dominance places a ceiling on how far rates can rise.
- The upside comes when markets recognize that the Fed’s real-rate ceiling is binding. At that point, gold will reassert its role as the hedge against the limits of policy credibility.
Gold fell to $4,081 on June 11 after the reignited higher-for-longer rate expectations, erasing year-to-date gains and placing the metal roughly 27% below its January 28 peak of $5,589. The drawdown is the largest of the post-2022 cycle. The question for cycle continuation is whether the two demand engines that drove the move from $1,800 to $5,500, first central banks, then Western & Asian ETFs, have weakened temporarily or fundamentally.
Two Bid Engines, Both Cyclically Compressed
The two-engine framework: central bank reserve diversification supplied the persistent baseline bid from 2022 onward; Western ETF inflows joined as a price-sensitive accelerator in 2024–early 2026. Both pillars have softened in the same time, which explains the depth of the pullback.
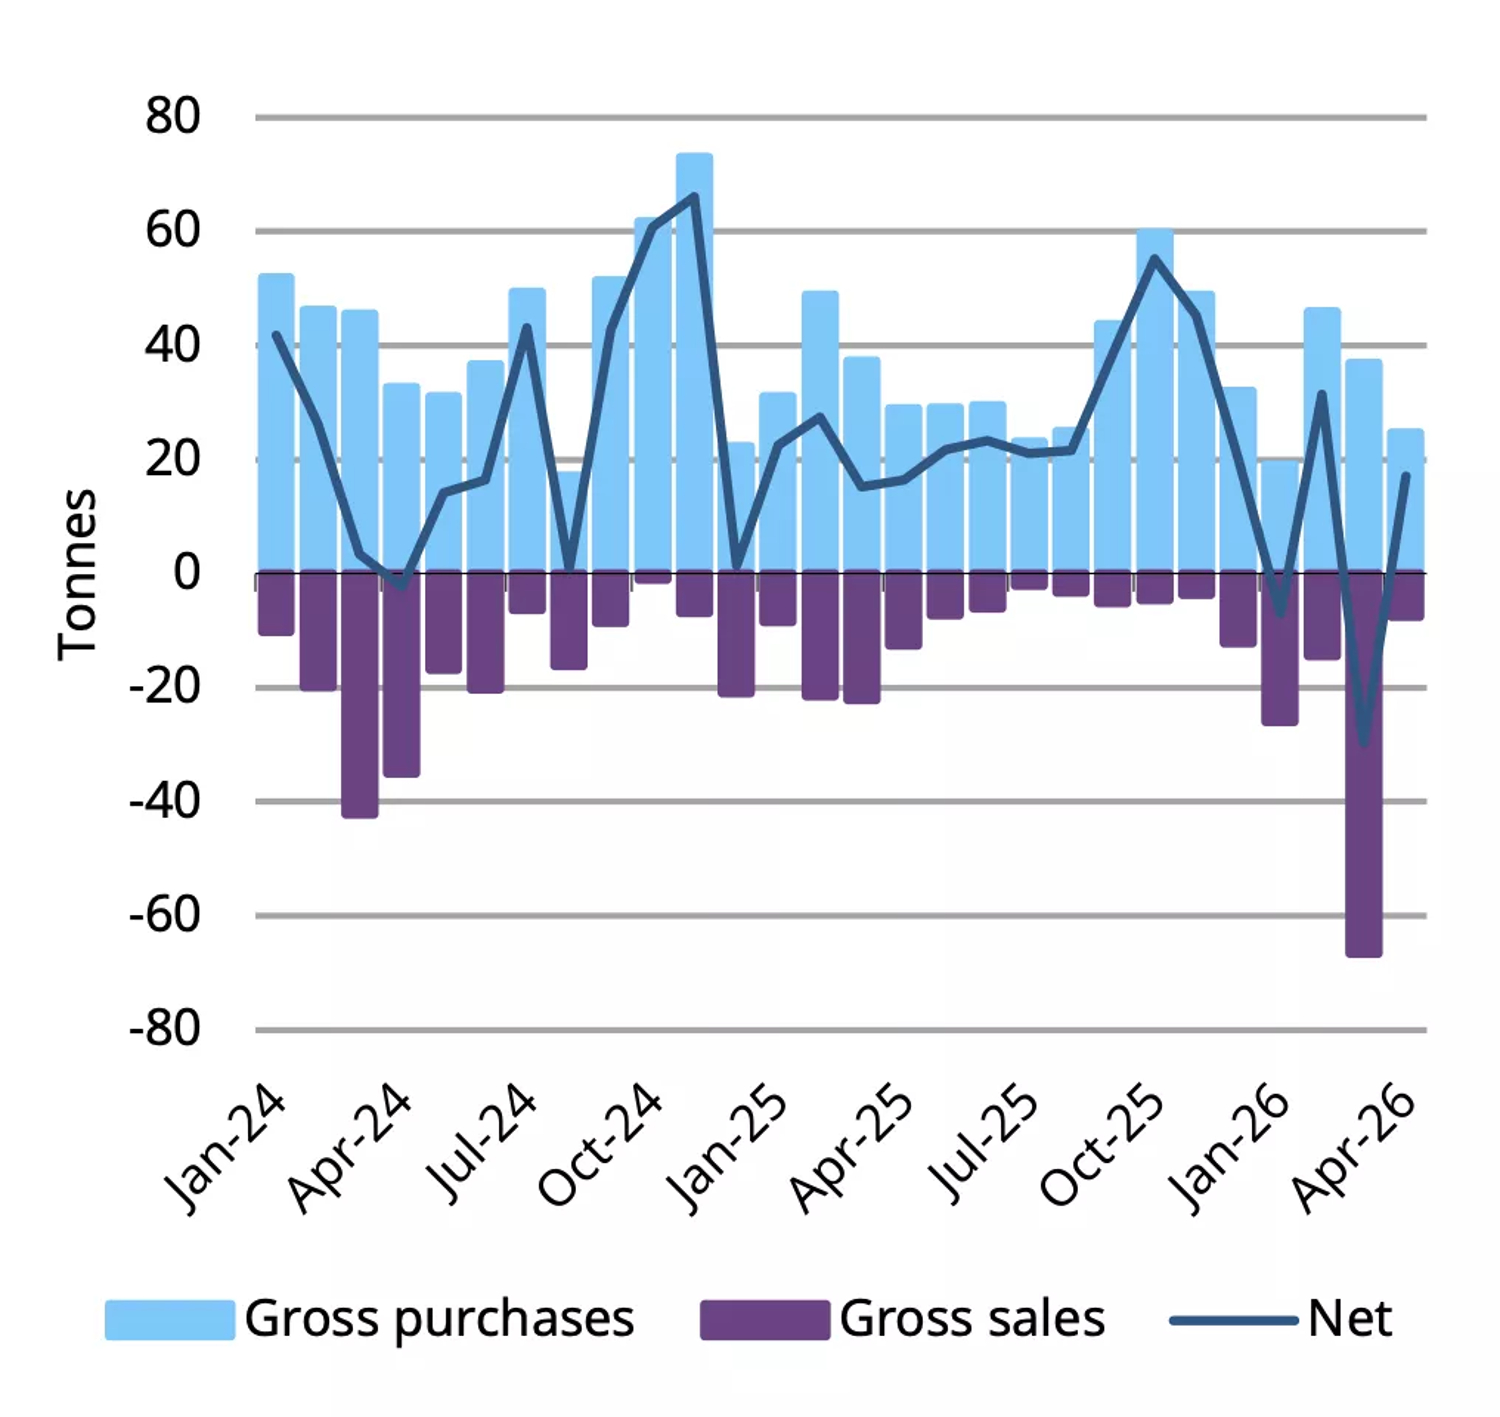
On the central bank side, April net purchases were 19t, a rebound from March net sales but well below the 29t monthly average of the past 36 months. Poland (14t), China (8t), and the Czech Republic (3t) continued accumulating. Turkey, March's largest seller, was flat in April after unwinding short-term gold/USD swaps used to defend the lira. Russia extended its sales streak to four months.
Central banks resume gold purchases in April
Year-to-date central bank gold activity
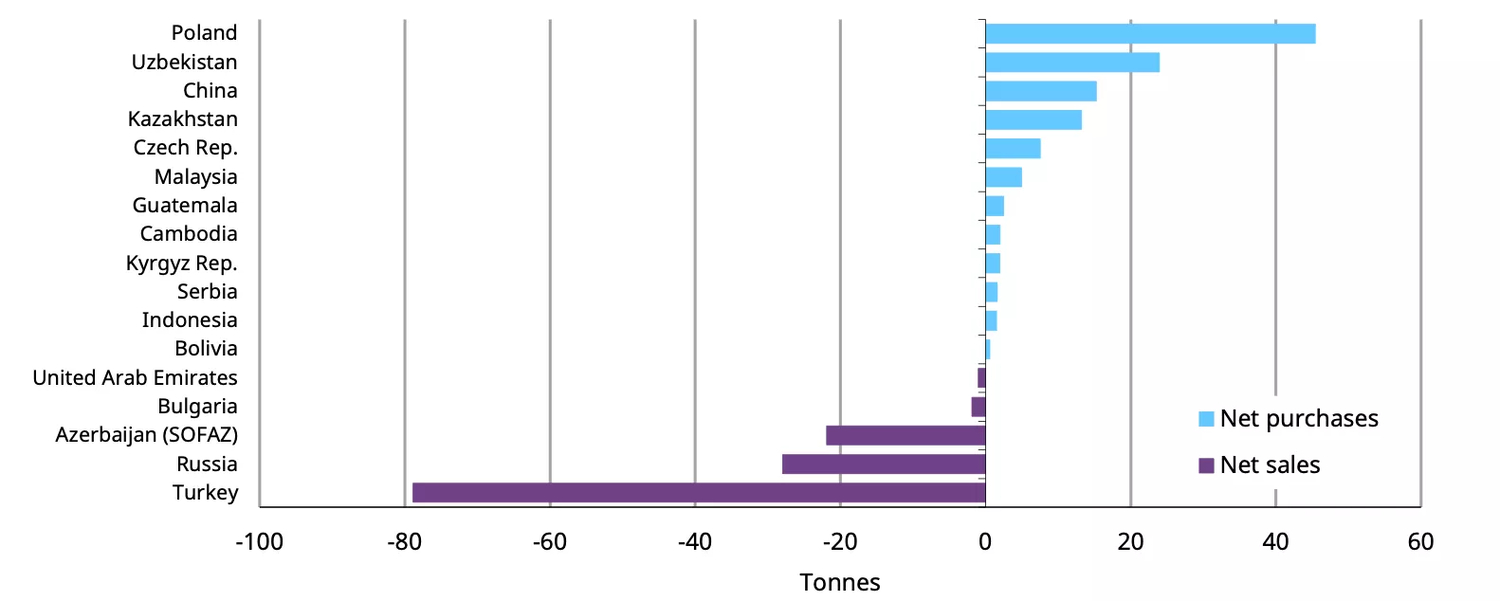
The slowdown is concentrated in reserve managers facing acute FX pressure, Turkey, Russia, parts of the Gulf, where gold is being mobilized to defend currencies. This is event-driven, tied to the Iran conflict and oil shock, not a reversal of the post-2022 reserve diversification thesis. The Eastern Europe and Asia core (Poland, China, Czech Republic, Kazakhstan) remains net buyers and accounts for the bulk of cumulative flows.
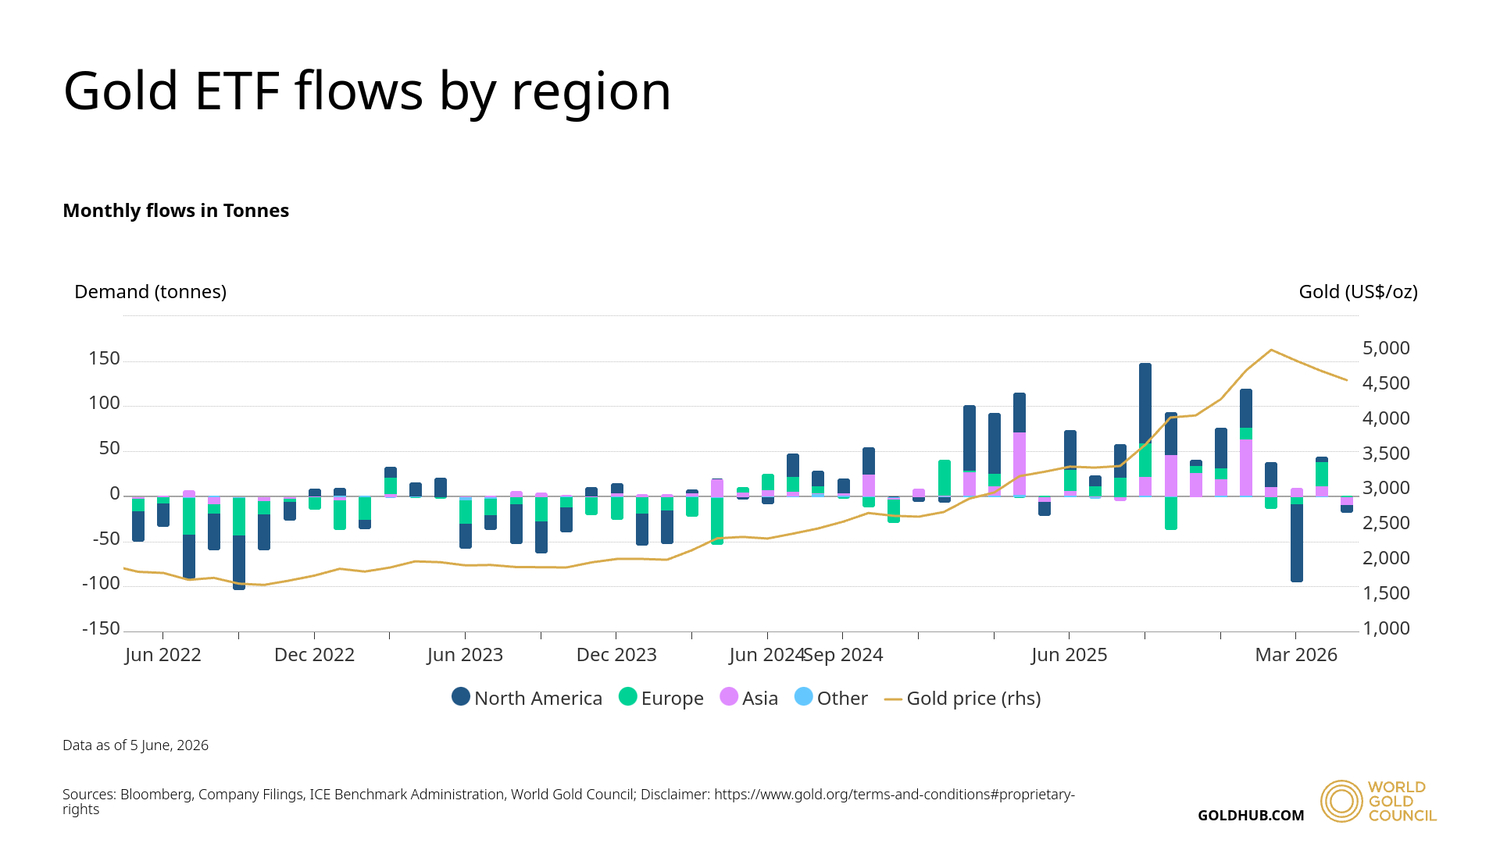
On the ETF side, March produced record global outflows of US$12bn, the largest monthly outflow on record. The pace has since moderated. US-listed ETFs added US$0.83bn in April; European funds added US$3.7bn. May reversed back to modest outflows of US$1.8bn globally, with Asian funds recording their first monthly outflow since August 2025.
The two bid pillars differ in time horizon. Central banks operate on multi-year reserve-diversification mandates and remain net accumulators; the exceptions (Turkey, Russia, parts of the Gulf) are countries mobilizing gold to defend currencies under acute FX pressure or fund budget deficit due to ongoing war, not a reversal of intent. ETF flows respond to price momentum and rate expectations on a monthly horizon.
The Real-Rate Relationship Has Been Broken Since 2022
Real rates, nominal bond yields adjusted for expected inflation, were once the primary long-run anchor for gold. Higher real yields raised the opportunity cost of holding a non-yielding asset and typically pressured gold prices, while lower real yields supported them.
Since 2022, however, that relationship has weakened materially. Gold continued to rise alongside higher real yields through 2022–2025, supported by strong central-bank buying, Asian physical demand, geopolitical hedging, and growing concern over persistent U.S. fiscal deficits.
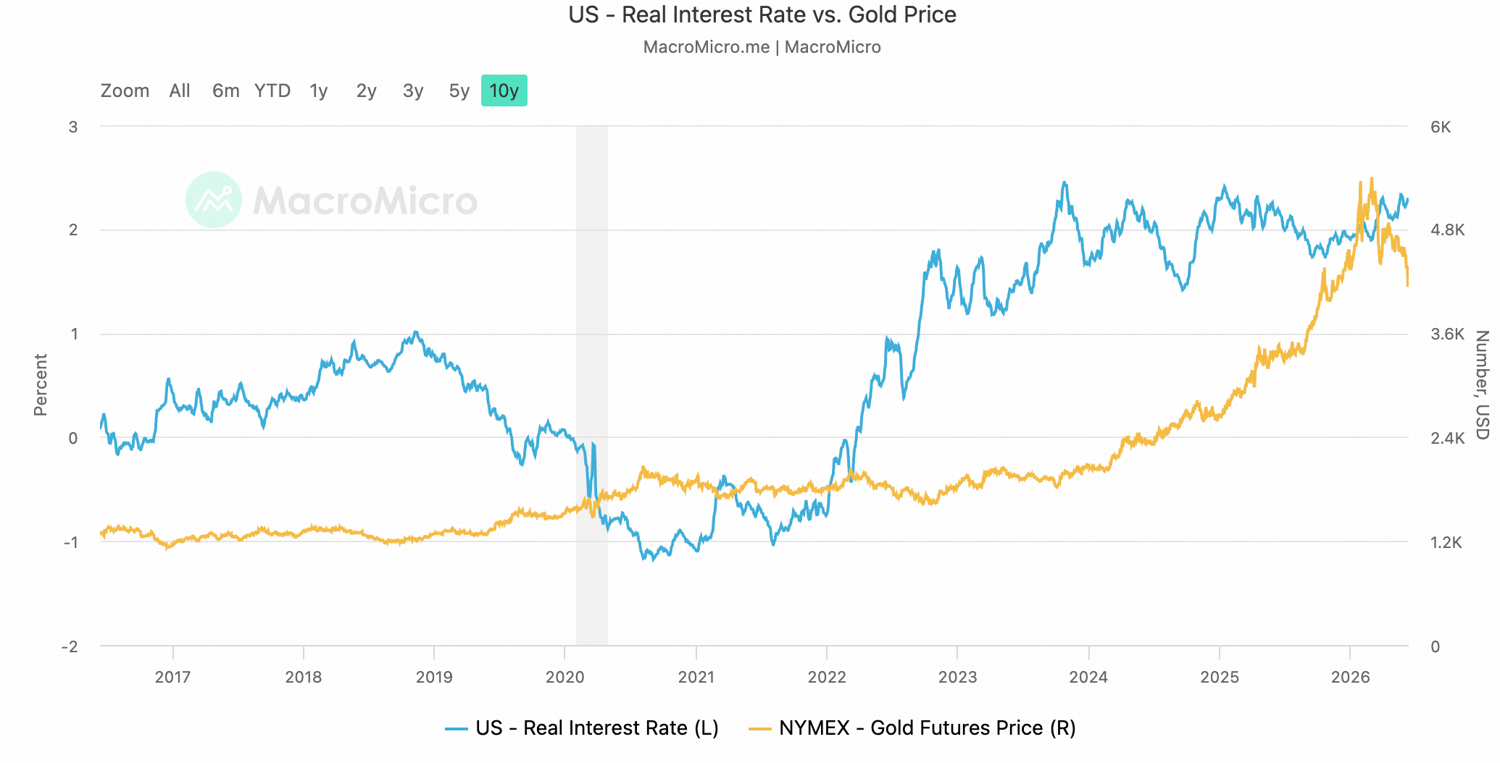
Source: MacroMicro
The current selloff appears to contradict the decoupling, gold dropped 27% on a rate-expectations shock.
Central-bank purchases and Asian physical demand are less sensitive to conventional opportunity-cost models. These flows are driven more by reserve diversification, currency-risk hedging, wealth preservation, and geopolitical considerations. That is the part of the market that has weakened gold’s historical dependence on real rates.
By contrast, the 2024–January 2026 rally also attracted both Western & Asian ETF inflows, futures positioning, and momentum-driven capital. Those holders are more rate-sensitive because they allocate through real-yield, dollar, and opportunity-cost frameworks. When rate expectations repriced, this marginal layer was vulnerable to a sharp unwind.
Real rates still matter for short-horizon price action, especially when positioning is crowded. But they no longer define gold’s structural floor in the way they did before 2022. Gold has become less a pure real-rate trade and more a hybrid asset.
Fiscal Dominance Caps the Real-Rate Ceiling
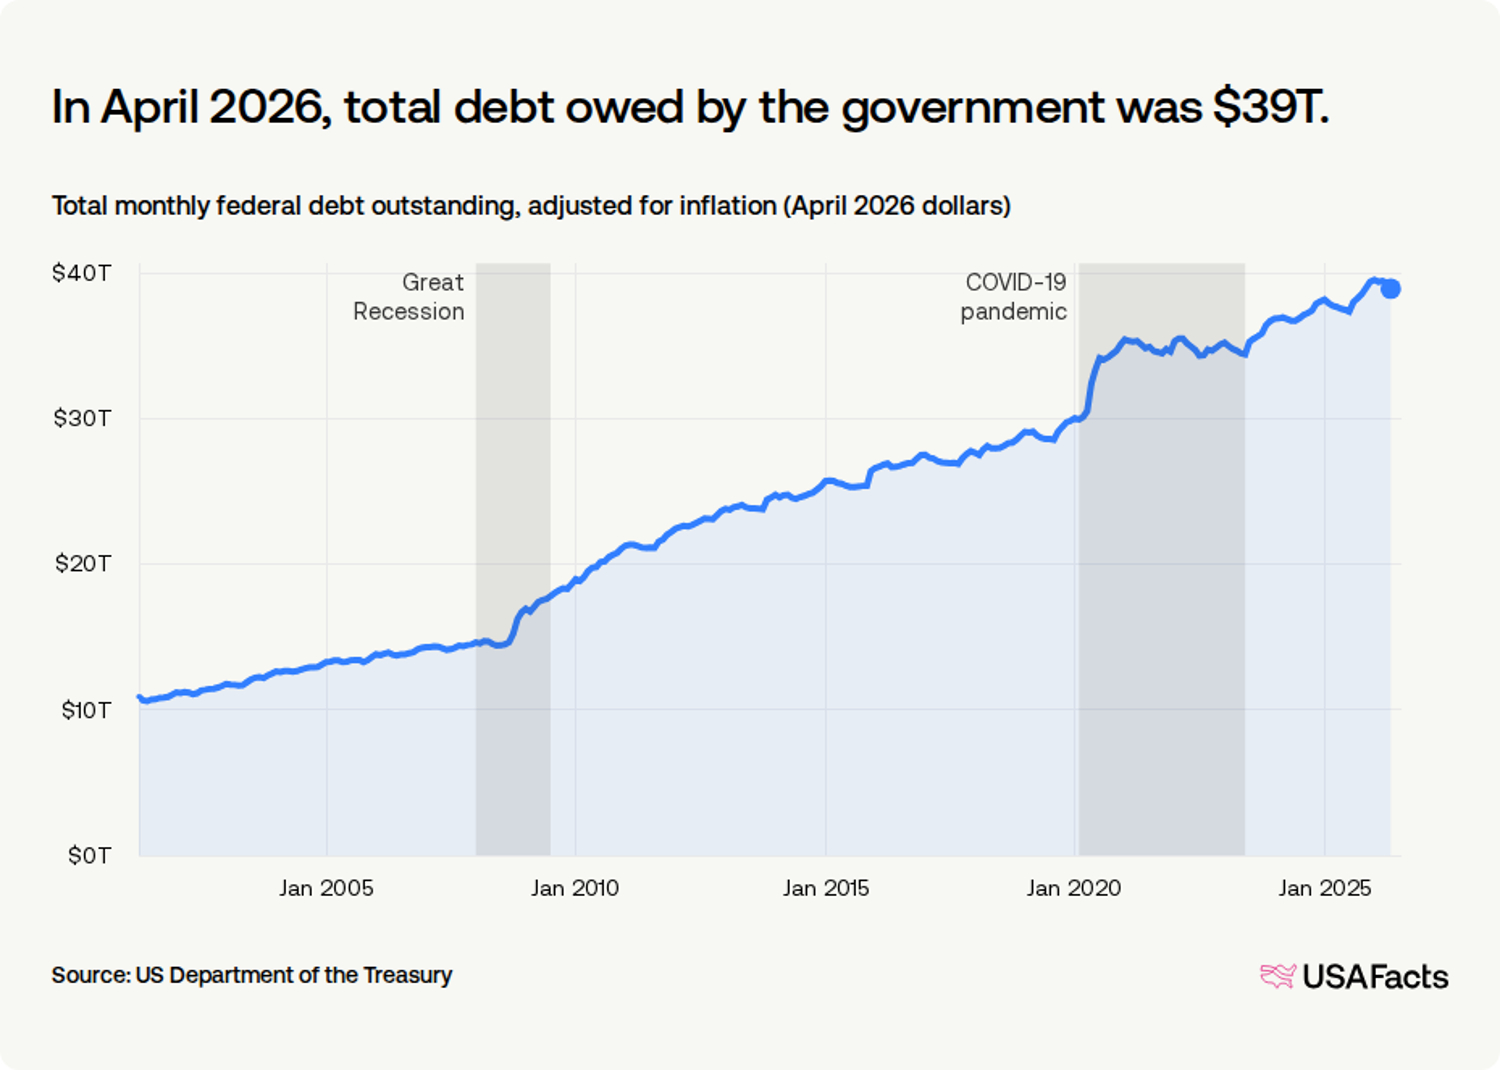
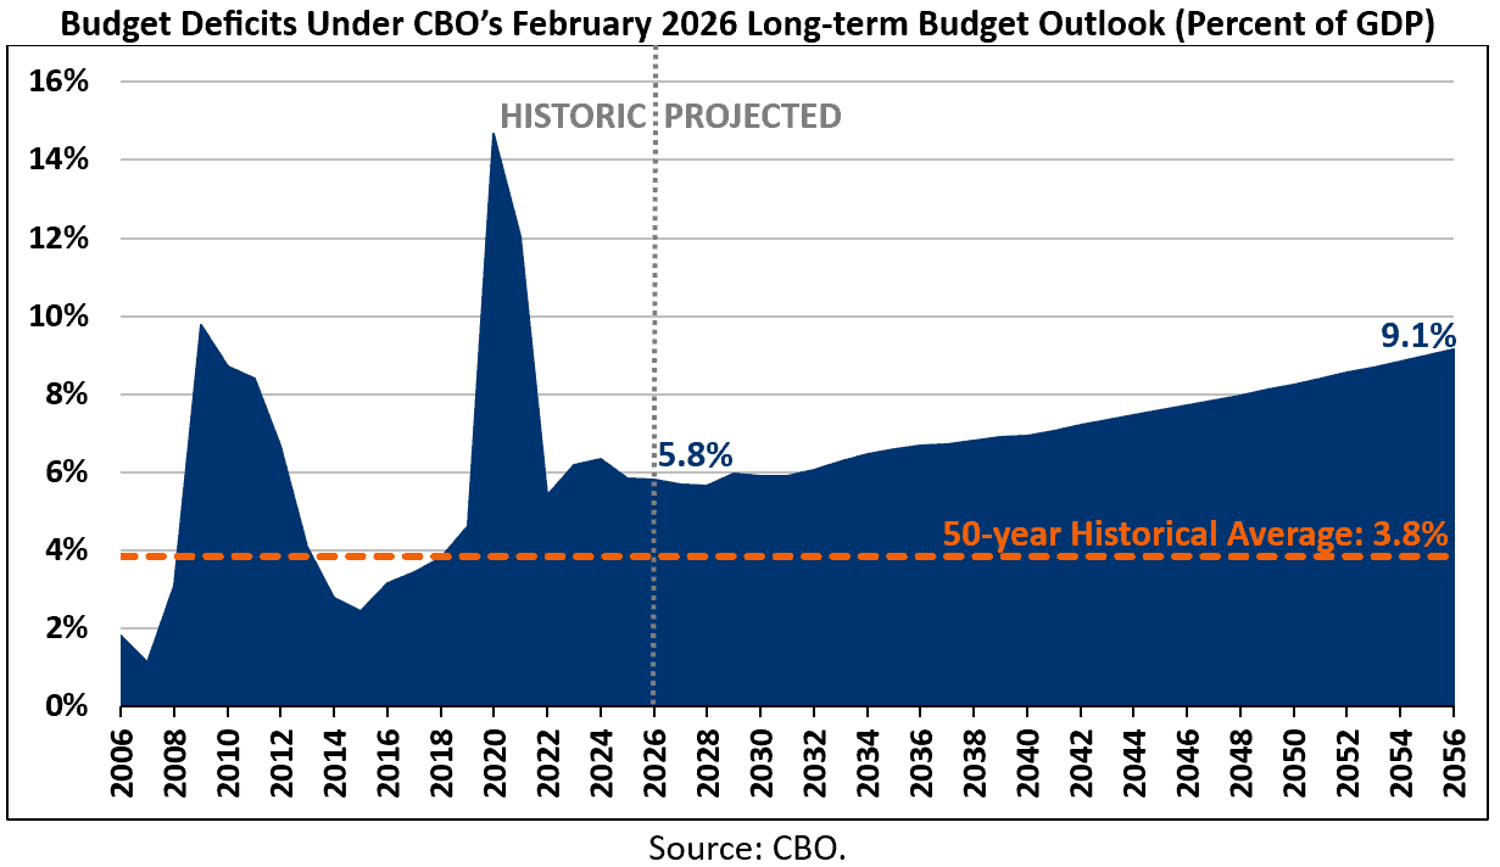
US federal debt is approximately $39T with interest expense already exceeding $1T annually. Every 100bp increase in the effective funding rate adds roughly $390B to interest expense over the refinancing cycle. Persistent deficits in the 6–7% of GDP range mean the Treasury issuance pipeline cannot tolerate prolonged high real yields.
This is the fiscal dominance constraint: monetary policy is bounded by the need to keep debt service viable. The Fed can raise nominal rates in response to inflation prints, but the extent of that posture is limited. The longer real yields stay elevated, the larger the debt-service burden becomes, the heavier the Treasury issuance requirement grows, and the greater the risk that fiscal stress starts to push back against monetary restraint.
The Next Repricing Comes When the Constraint Becomes Visible
The most likely path going forward is nominal rates remain high enough to defend dollar credibility and contain inflation expectations, while real rates are capped by Treasury issuance pressure, debt-service constraints, and the market’s limited tolerance for sustained term-premium stress. Liquidity conditions remain selectively accommodative whenever pressure at the long end threatens broader market functioning.
Under this path, gold is likely to consolidate rather than collapse. As the Iran shock unwinds and ETF flow stabilizes, the market can trade in a $4,000–$4,800 range into Q4. That range reflects a market where rising rate expectations keep pressuring, while the structural floor from central-bank demand, Asian physical buying, fiscal-risk hedging, and reserve diversification remains intact.
The asymmetric upside requires a clearer recognition event: markets must begin to price that the Fed cannot keep policy restrictive long enough to force inflation lower without making the debt-service arithmetic visibly unstable.
The trigger for the next repricing is therefore unlikely to be a simple rate-cut signal. It is the moment markets conclude that the Fed’s real-rate ceiling is real. Once that constraint becomes visible, gold will reassert its role as the hedge against the limits of monetary credibility.
Disclaimer: The information provided herein does not constitute investment advice, financial advice, trading advice, or any other sort of advice, and should not be treated as such. All content set out below is for informational purposes only.