
We think the overcrowded gold trade of early 2026 has largely cleared, and the balance of evidence now tilts back toward gold outperforming equities. Gold sits roughly 21% below its January record, the relative-valuation stretch against equities has dropped almost 40%, and the buyers who matter for a durable move, central banks and ETFs, added to positions while the price was falling.
A Long-term Look
Gold has no earnings, cash flow, or book value, so its dollar price alone cannot tell you whether it is cheap or expensive, and the chart in isolation shows only trend and level. To judge relative value we use the S&P 500-to-gold ratio, the index price divided by the gold price per ounce. A high ratio means equities have outrun gold and gold looks cheap against stocks; a low ratio means the reverse.
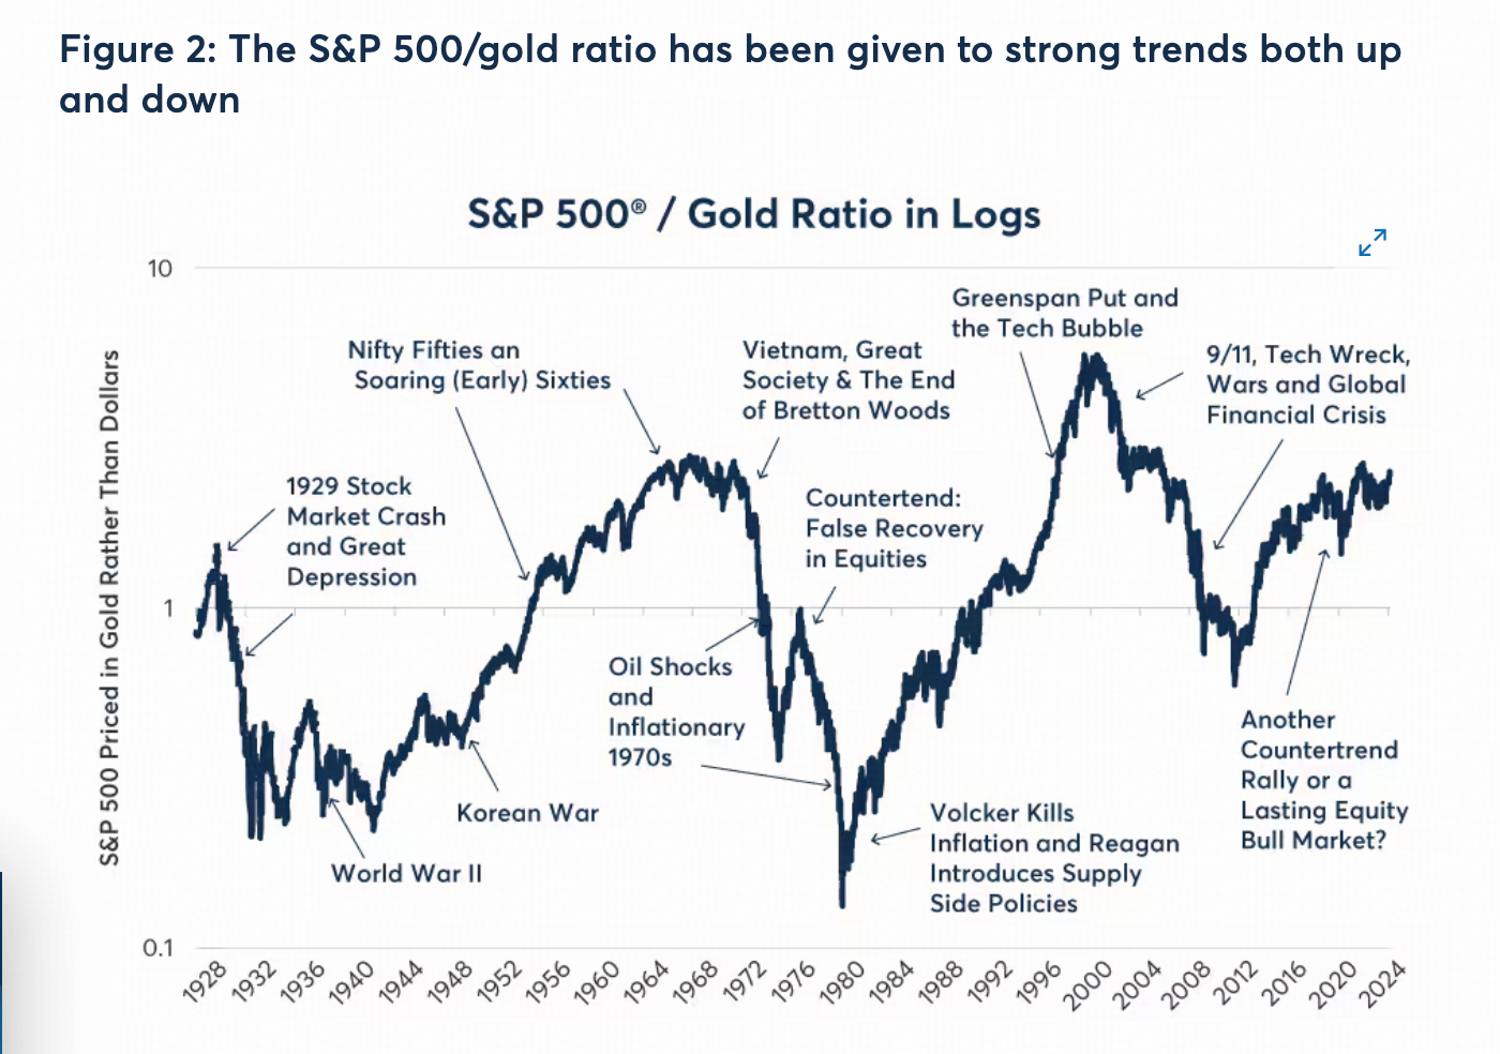
Generally, equities have done better than gold during periods of geopolitical stability, disinflation and steady economic growth, while gold tends to outperform during periods of instability. Switching from one circumstance to another can set off powerful trends in the S&P 500/gold ratio that can last for years, even decades.
From 1980 to 2000, the S&P 500-to-gold ratio rose through a long period of equity dominance. Disinflation, falling macroeconomic volatility, globalization and technology-led productivity growth supported corporate earnings and higher equity valuations. Gold gradually lost the large inflation and crisis premium accumulated during the 1970s. By the 2000 technology-market peak, equities traded at an exceptional premium to gold, leaving the ratio near a extreme high level.
From 2000 to 2011, the cycle reversed. The dot-com collapse, the 2001 recession, dollar weakness, the global commodity boom and the 2008 financial crisis weakened confidence in financial assets and increased demand for monetary protection. Aggressive rate cuts, quantitative easing and sovereign-debt concerns further strengthened gold, while the S&P 500 passed through two major bear markets. The ratio declined for more than a decade and reached a secular low around gold’s 2011 peak, when gold carried a substantial crisis and monetary-risk premium relative to equities.
From 2011 to 2020, U.S. equities regained relative leadership. Economic recovery, subdued inflation, stronger corporate profits and technology-sector growth supported the S&P 500, while gold’s post-crisis premium faded and Western investors reduced ETF exposure.
The Current Setup Favors Gold
The foundations of a renewed gold-led regime were laid after 2020, although the shift in relative performance became decisive only more recently. Pandemic-era balance-sheet expansion, the inflation shock, persistent fiscal pressure, geopolitical fragmentation and reserve diversification rebuilt gold’s monetary and strategic premium.
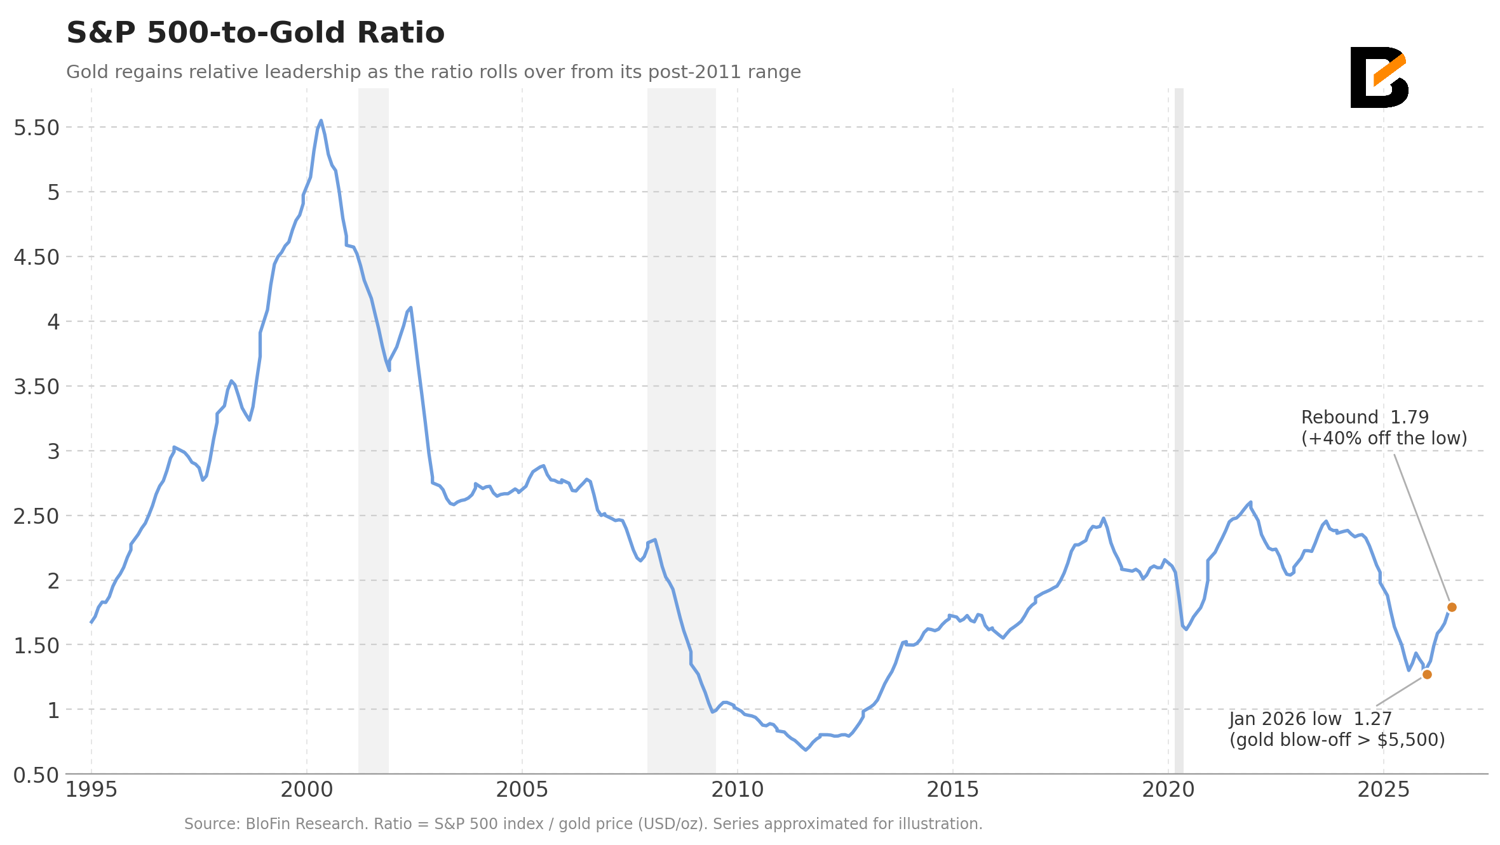
The S&P 500-to-gold ratio has rolled over from its elevated post-2011 range, showing that gold has regained relative leadership. Historical cycles suggest that these regimes can persist for many years, with sharp countertrend moves along the way.
The surge into January 2026 represented an acceleration within that broader trend. Gold’s final move above $5,500 compressed the ratio to a deep cyclical low and added a substantial momentum premium to the price. The subsequent correction leaving gold about 21% below its January peak. Over the same period, the S&P 500-to-gold ratio rebounded from approximately 1.27 to 1.79, a rise of roughly 40%. The adjustment removed much of the early-year relative-value excess while preserving the broader gold re-rating.
The correction also improved the market’s ownership structure. Momentum-sensitive and leveraged investors reduced exposure, lowering the market’s dependence on continued price chasing. Strategic buyers then increased their presence as prices weakened. Gold has consequently moved from a momentum-dominated phase toward a reaccumulation phase supported by capital with longer investment horizons.
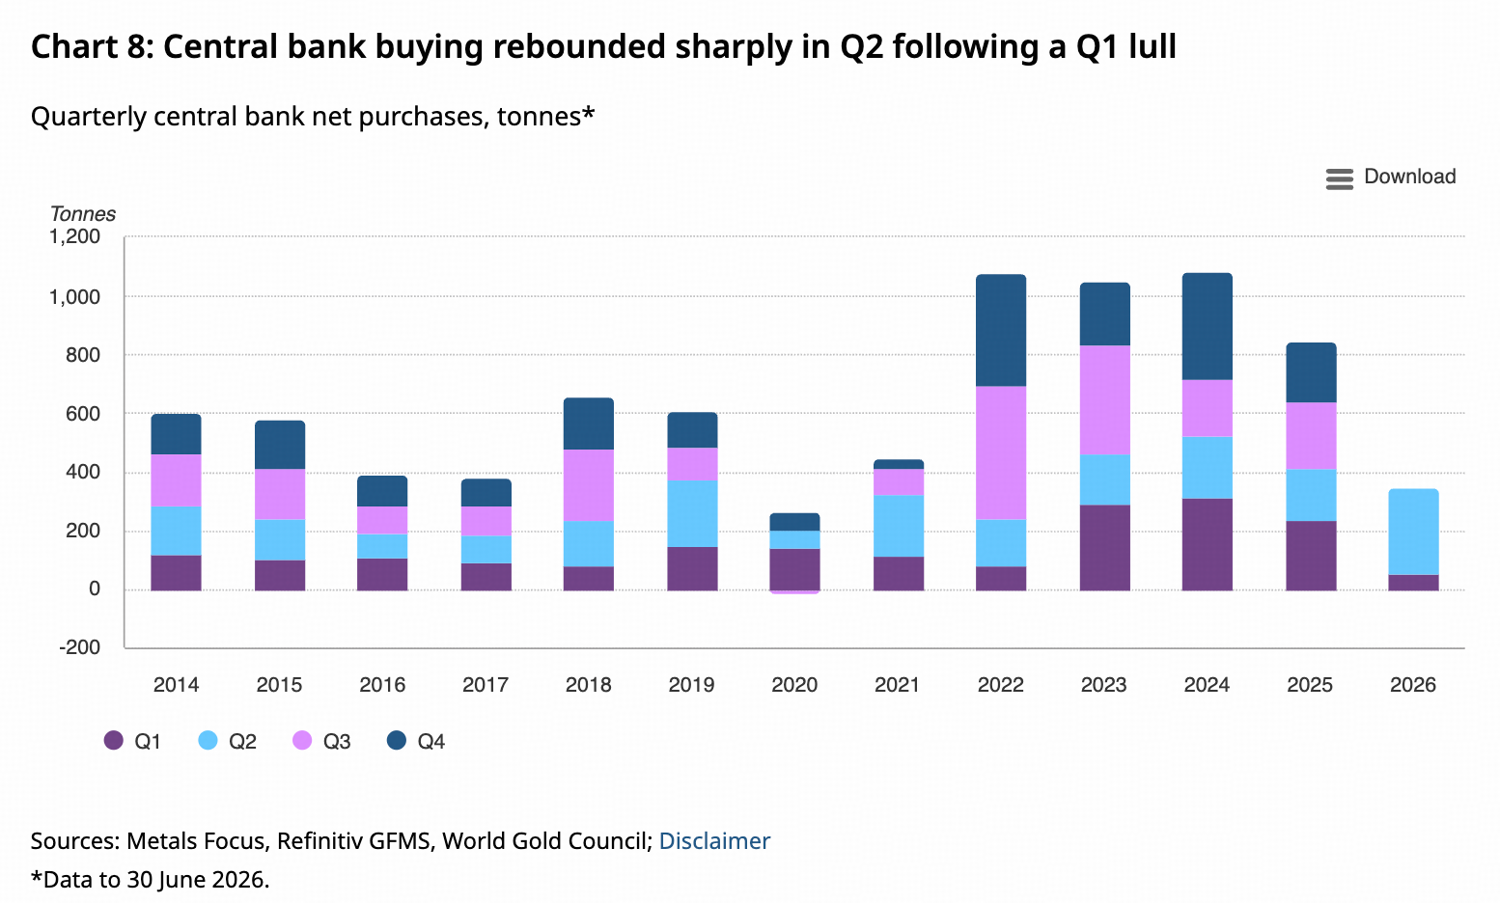
Central banks provide the clearest evidence. Official-sector net purchases reached 288.9 tonnes in the second quarter, a record for any second quarter, up 62% from a year earlier and five times the first-quarter total of 57 tonnes. Central banks increased accumulation while gold was undergoing its sharpest correction of the cycle, indicating that lower prices strengthened the strategic bid.
Source: https://www.gold.org/goldhub/research/gold-demand-trends/gold-demand-trends-q2-2026/central-banks
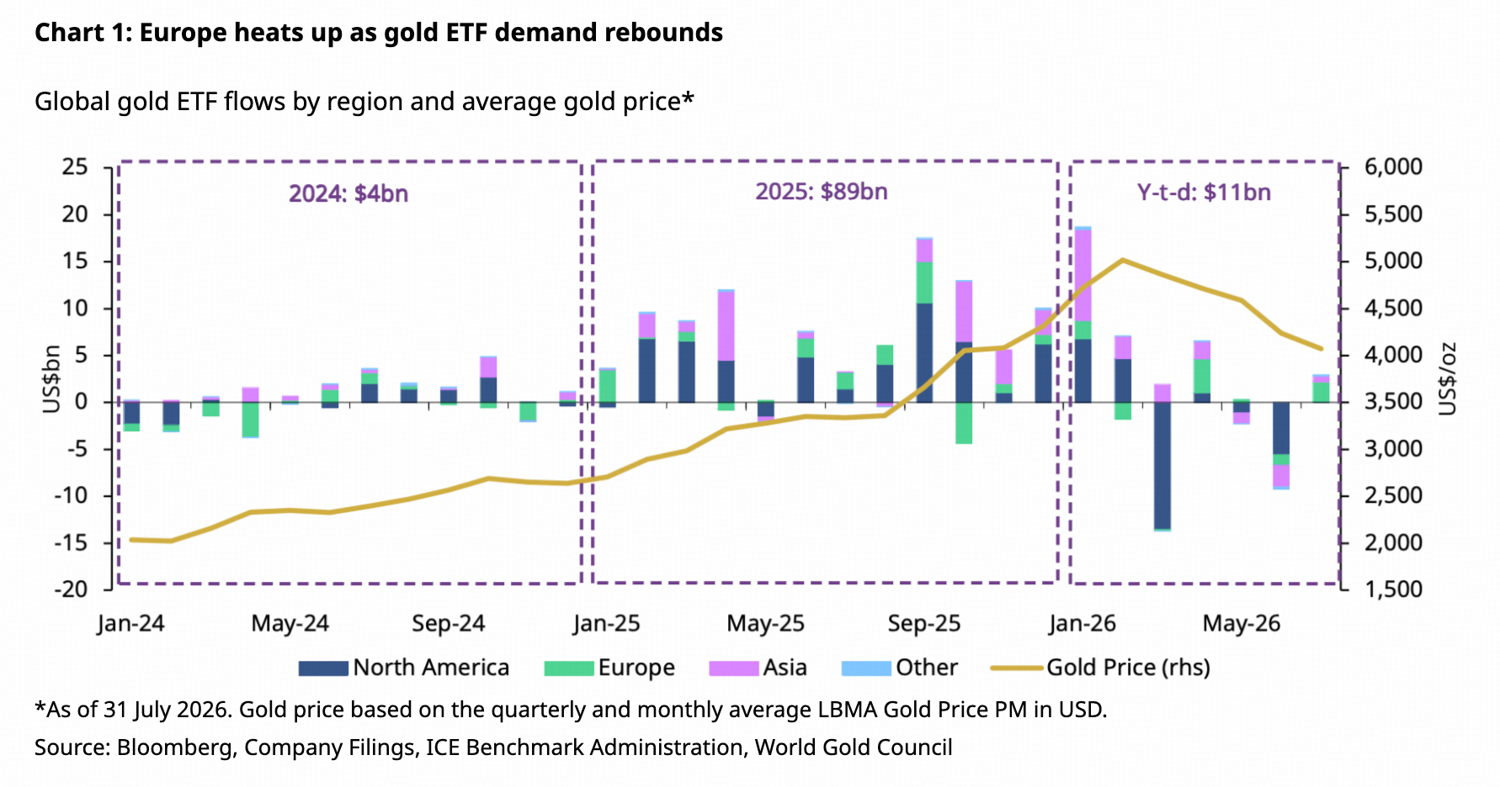
ETF flows show that private investment demand has entered an early stage of reaccumulation. Global gold ETFs received approximately $3 billion in July, reversing two consecutive months of outflows.
Taken together, the ratio reset, renewed central-bank accumulation and improving ETF flows are all constructive for gold. Historical cycles show that once relative leadership shifts toward gold, the S&P 500-to-gold ratio can trend lower for many years and travel far beyond its initial reset. The current reading remains well above the deepest troughs reached during previous gold-led cycles, leaving substantial room for further compression before the ratio approaches a extreme.
Disclaimer: The information provided herein does not constitute investment advice, financial advice, trading advice, or any other sort of advice, and should not be treated as such. All content set out below is for informational purposes only.