
Summary
- The treasury divide comes down to cash flow. Strategy sold another 1,638 BTC and issued shares to fund STRC buybacks and a $4B dividend buffer, while BitMine kept buying ETH toward its 5% supply target with $247M in annualized staking revenue covering the bill. One pays interest, the other collects it.
- Whales are accumulating into weakness. BTC whale wallets have grown from 2.87M to 3.06M coins since Dec 2025, ETH whale cohorts sit at record highs, and XRP order flow shows passive absorption.
- The stablecoin divergence is flashing for a third time. USDT+USDC supply keeps shrinking while BTC bounces off $58K, a setup that preceded a 36% drop early this year. The structure leans bearish until the divergence resolves.
Strategy vs BitMine: Opposite Signals
The two largest corporate crypto treasuries moved in opposite directions. Strategy disclosed another sale of 1,638 BTC while BitMine extended its weekly buying streak with 10,399 ETH. The divergence has widened over the past one to two months, and it comes down to cash flow.
Strategy's week:
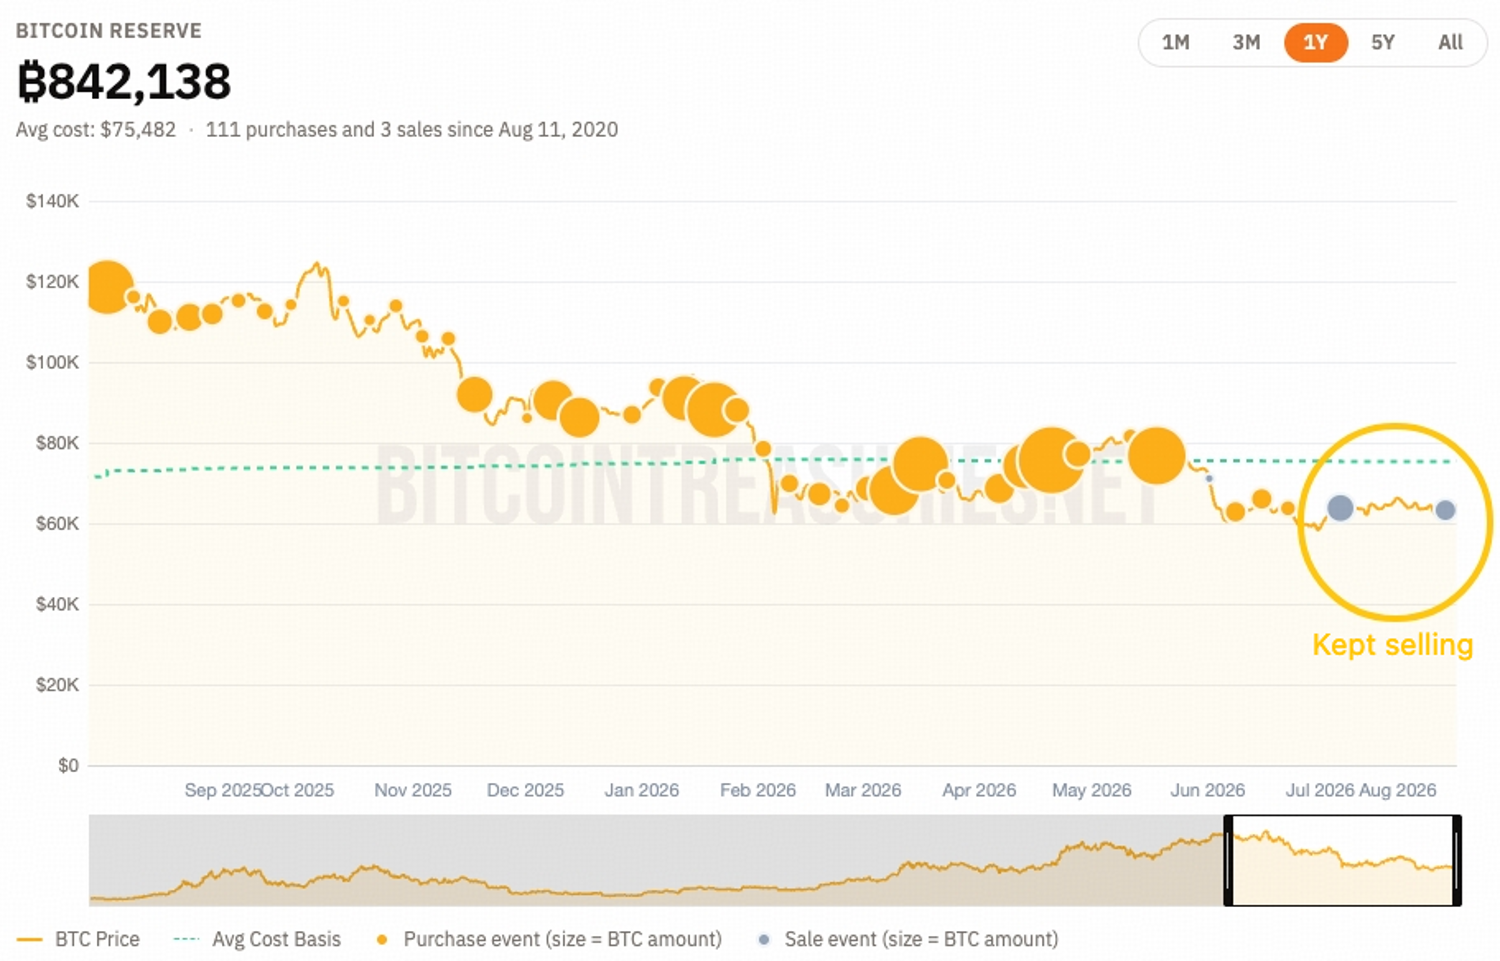
- Kept selling: disposed of 1,638 BTC and issued MSTR common shares, raising roughly $395M in total
- Defended the peg: cumulative STRC buybacks have topped $106M since late June; STRC has recovered more than 30% and is closing in on its $100 par target. The 12% rate stays in place for now
- Built the buffer: added $250M to cash reserves, bringing the USD buffer to roughly $4B, earmarked primarily for future STRC dividends
- Underwater on the book: holdings now stand at 842,138 BTC at an average entry of $75,419; with BTC around $64K, that is an unrealized loss of roughly 15%
BitMine's week:
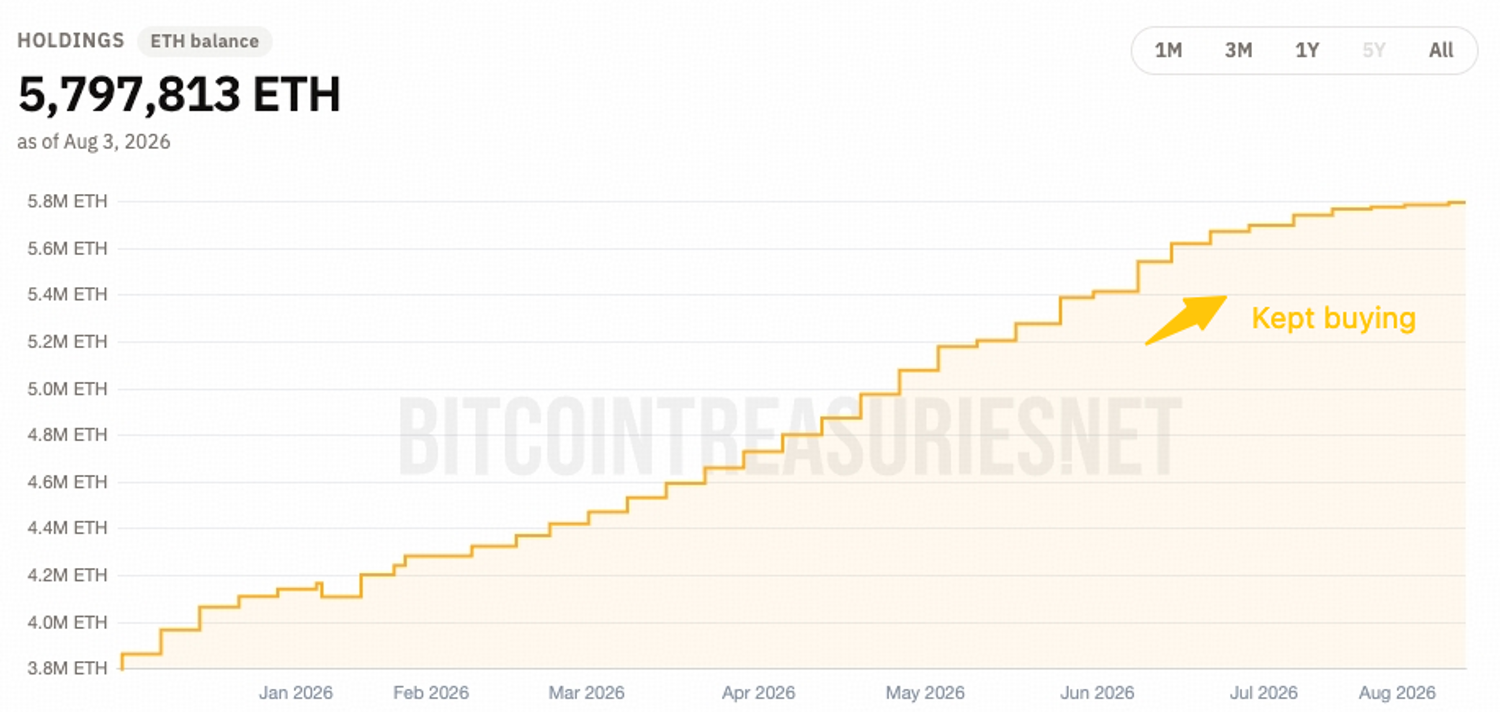
- Kept buying: added 10,399 ETH
- Closing in on target: total holdings now exceed 5.8M ETH, about 4.8% of circulating supply. In August, the 5% annual target is nearly done
- Buying back stock: repurchased 4.5M of its own shares
- Collecting yield: about 85% of holdings is staked, generating projected annualized revenue of $247M at a ~2.7% yield
The core difference is the direction of interest.
On the surface, one is selling and one is buying; one is issuing shares and diluting while the other is buying its own shares back.
In essence, Strategy pays interest while BitMine collects it. BTC generates no income, so STRC's 12% obligation must be serviced by selling coins, issuing equity, and stockpiling cash. ETH's staking yield gives BitMine a steady income stream that funds both accumulation and buybacks.
On DAT fundamentals, a yield-bearing treasury holds a structural advantage over a zero-yield one, and this week's opposite trades are that difference playing out in real time.
Whale Accumulation Accelerates
Bitcoin has been ranging around $64K for the past month. Beneath this quiet surface, large holders have been building positions for over a month, and on-chain data across BTC, ETH, and XRP shows smart money quietly accumulating blue-chip assets.
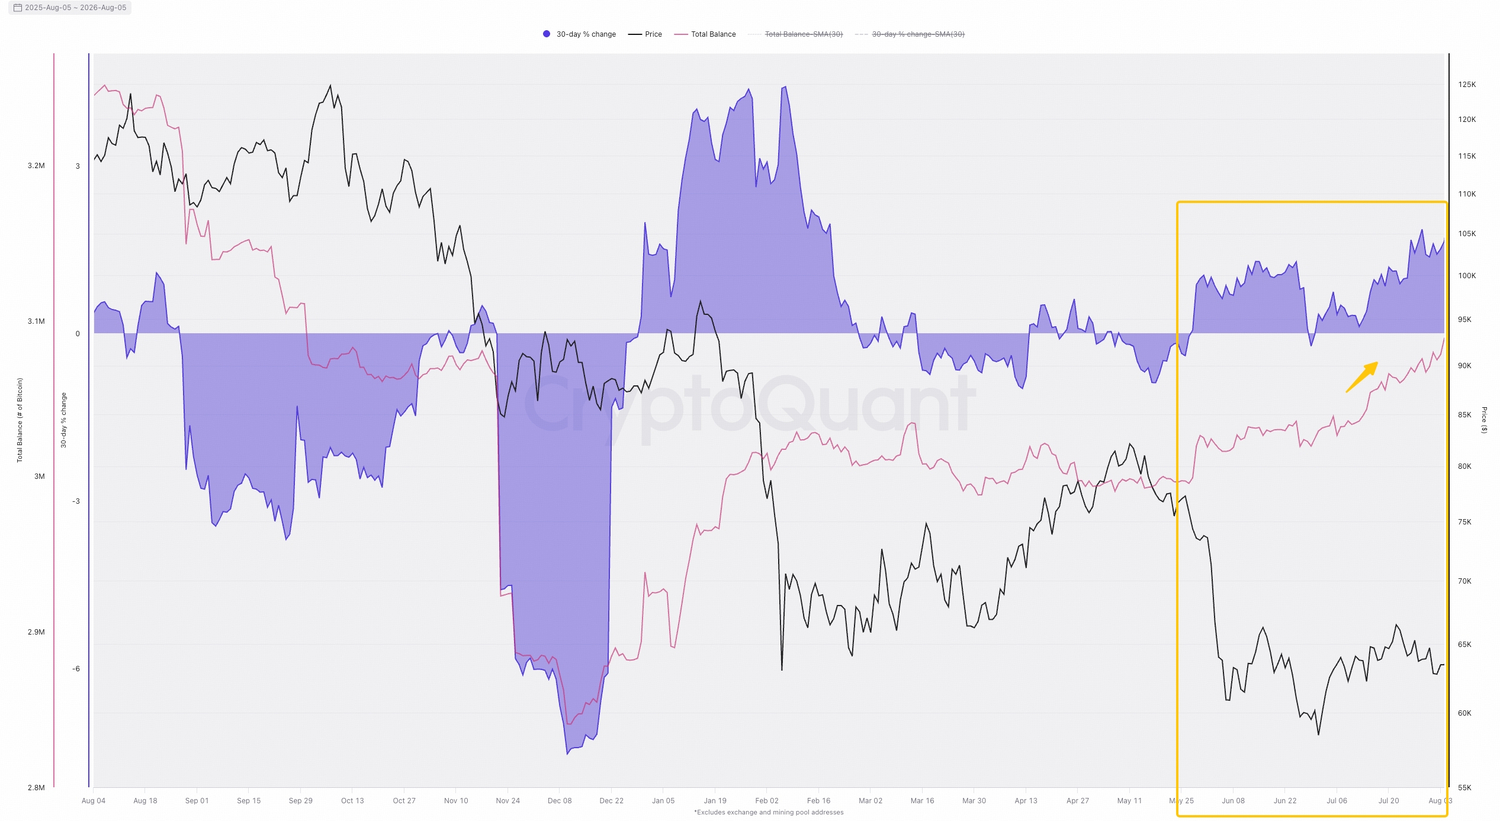
- BTC: Whale wallets now hold roughly 3.06M BTC, up from 2.87M in Dec 2025. The two heaviest accumulation waves over the past year both occurred when Bitcoin retraced to the $60K area, with the latest one accelerating after the June breakdown below that level.
- ETH: Wallets holding 10K–100K ETH have grown their positions to nearly 19.6M ETH, an all-time high for this cohort. Super-whale addresses holding over 100K ETH have added close to 2M ETH since mid-2025. Combined with the DAT-company bid, ETH supply is being absorbed by two structural buyers simultaneously.
- XRP: Average spot order sizes have stayed within the large-whale range as the token traded in the $1.00–1.20 band over the past 90 days, and taker cumulative volume delta points to passive absorption. Whales are quietly collecting into weakness.
Stablecoin Divergence Flashes Again
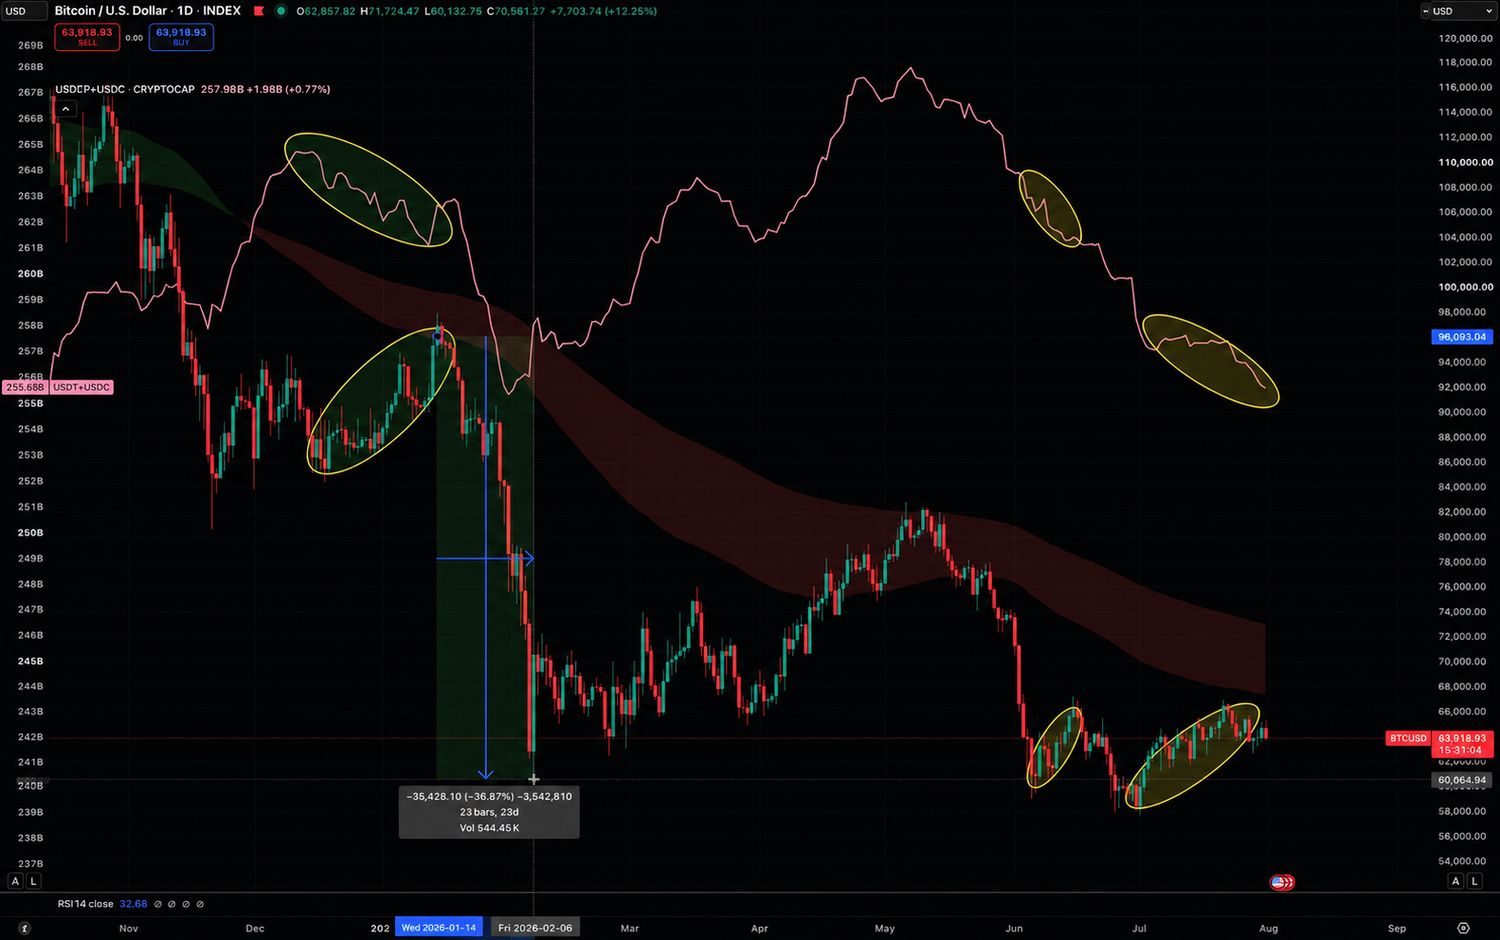
Stablecoin supply, the combined USDT+USDC market cap, has been in a steady downtrend while BTC has bounced from the $58K area, and this pattern has a track record worth taking seriously.
Falling stablecoin supply means real capital is leaving the market. When price rises against that backdrop, the rally is more likely driven by short liquidations than fresh inflows. Every squeezed short is a forced buyer, which fuels the bounce, but once the leverage is flushed out, the buying power behind the move is gone.
Source: @btclier
This divergence has appeared twice in the past year, and both times a sizable drawdown followed.
- Early this year, stablecoin supply fell while price pushed higher, and BTC subsequently dropped roughly 36%.
- A smaller divergence in May preceded a 13% decline.
A third divergence has now formed since July, and the stablecoin supply downtrend shows no sign of narrowing or turning up.
Two occurrences make a pattern, not a law. Still, with supply flows pointing down while price grinds higher on thin volume, the structure leans bearish until the divergence resolves, either through stablecoin supply turning up or price catching down.
Week Ahead
- Ongoing: Market repricing of the CLARITY Act outcome following the Senate's pre-recess vote window
- Aug 12: US July CPI
- Aug 13: US July PPI
- Ongoing: Middle East conflict and its impact on oil prices
This week Fed rhetoric turned hawkish. Governor Cook said she would support a hike if inflation fails to slow, while Kashkari called for gradual rate increases, and markets now price roughly a 55% probability of a Sept hike.
The upcoming CPI and PPI prints will therefore weigh heavily on the Sept rate decision. If the inflation data does not cool, rate-cut expectations can only be pushed further out, and a crypto market already trading on thin liquidity and fearful sentiment will likely remain in a holding pattern, waiting for a positive catalyst.
Disclaimer: The information provided herein does not constitute investment advice, financial advice, trading advice, or any other sort of advice, and should not be treated as such. All content set out above is for informational purposes only.