Trading Pairs: Base and Quote Currencies
Every trade on any exchange involves a trading pair, which is two assets you exchange. A trading pair is typically written as BASE/QUOTE.
The base currency is the first currency in the pair, and the quote currency is the second. For example, in the pair BTC/USDT, Bitcoin (BTC) is the base currency and Tether (USDT) is the quote currency. This means BTC is the asset being traded, and its price is quoted in USDT. In other words, the price displayed (say, BTC/USDT = 30,000) indicates how much of the quote currency (USDT) is required to purchase one unit of the base currency (1 BTC).
Trading pairs can be crypto-to-crypto, for example ETH/BTC. In this trading pair:
- Base asset is ETH: The asset you're buying (ETH in ETH/BTC).
- Quote asset is BTC: The asset you're spending (BTC in ETH/BTC).
So when the price of ETH/BTC is 0.05, it means 1 ETH = 0.05 BTC.
In crypto exchanges, most cryptocurrencies are often traded against stablecoins like USDT (as the quote currency) for stability. Always remember: the first symbol is what you’re buying or selling, and the second is what you’re paying or receiving in return.
Understanding the Order Book
An order book is a real-time, dynamic list of buy and sell orders placed by traders on an exchange. It acts like a marketplace bulletin board that displays who wants to buy or sell a particular asset, how much of it they want, and at what price. Exchanges like BloFin use this system to match buyers with sellers automatically, helping determine the current market price based on active supply and demand.
An order book is organized into two sides: bids (buy orders) and asks (sell orders). Bids represent the prices and amounts buyers are willing to pay for the base asset, while asks represent the prices and amounts sellers are willing to accept (i.e. what price they want for the base asset).
On BloFin's trading interface, you’ll typically see the order book as two colored lists – green for buy orders (bids) and red for sell orders (asks) – stacked around a central price. The highest bid (the top buyer price) and the lowest ask (the top seller price) sit at the center of the order book, and the difference between them is called the bid-ask spread.
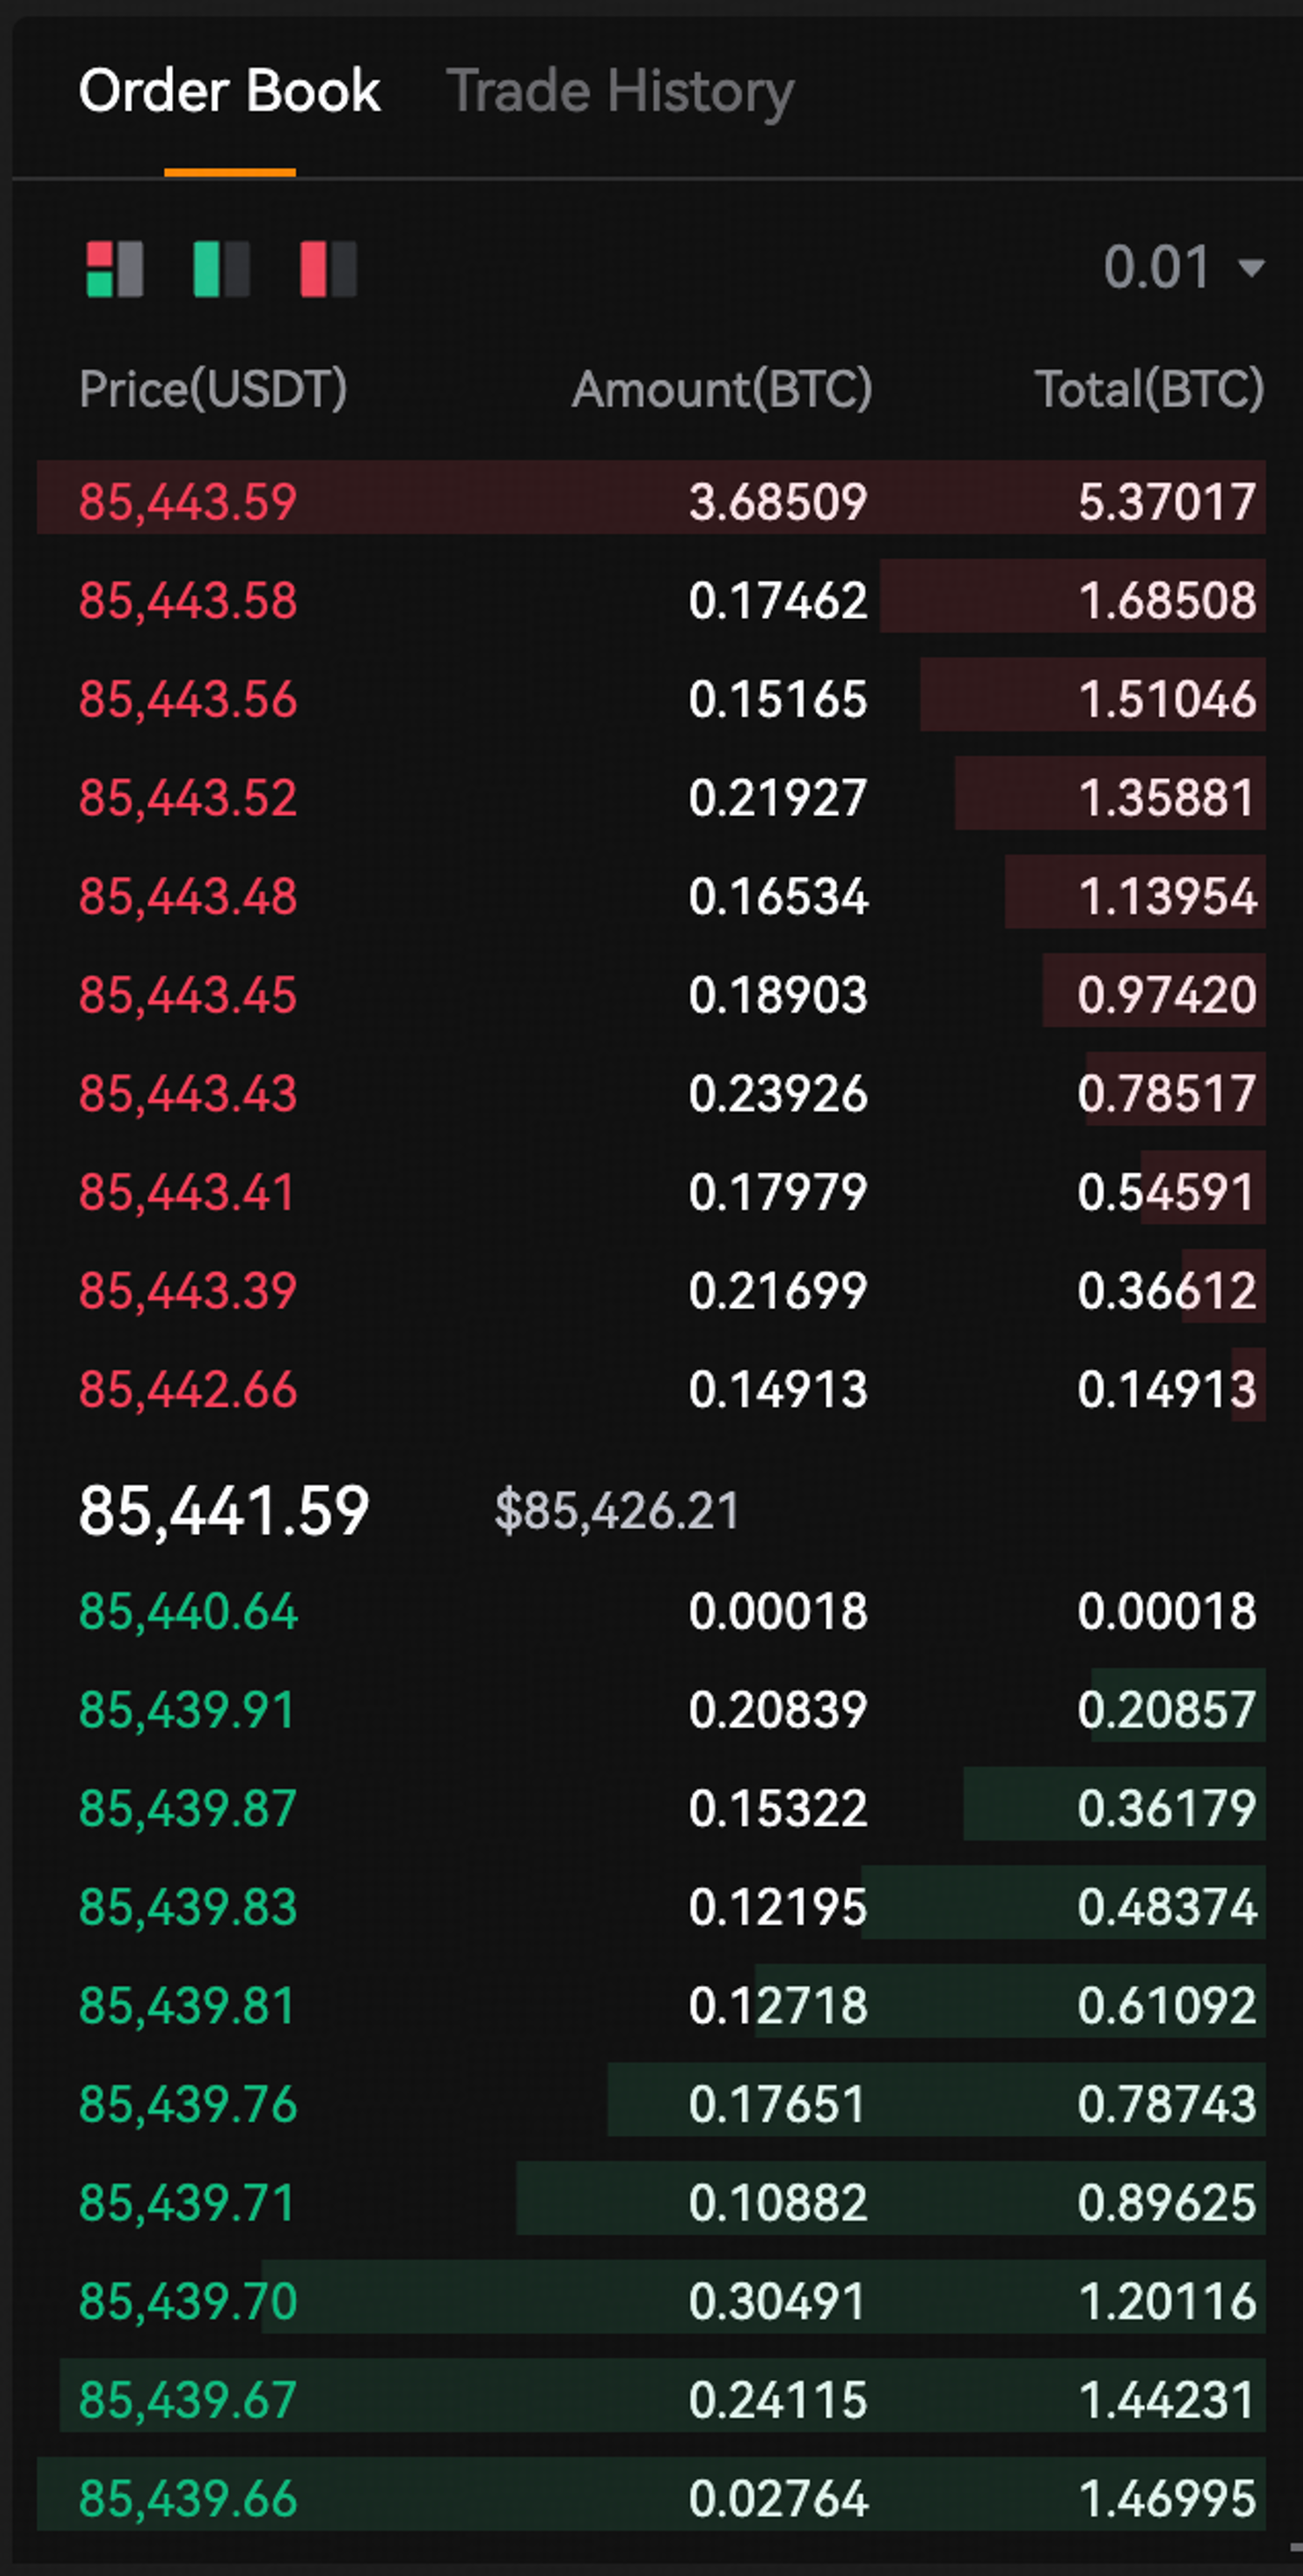
Each entry in the order book shows a price and a quantity. For bids, the price is how much the buyer is willing to pay per unit of the base currency, and the quantity is how many units they want at that price. For asks, the price is what the seller wants per unit, and the quantity is how many units they are selling. The order book is continuously updated in real time: whenever new orders are placed, they appear at the appropriate price level; whenever trades execute, the corresponding orders are removed.
You'll also see a figure in the middle — shown in our BTC/USDT example as 85,441.59. That's the mid-market price, which shows the average price between the best ask and bid price.
The bid-ask spread is a key concept derived from the order book. It is simply the gap between the highest bid price and the lowest ask price. For instance, if the highest bid for BTC is 30,000 USDT and the lowest ask is 30,010 USDT, the spread is 10 USDT. A tight (small) spread typically indicates a liquid market with good trading activity, because buyers and sellers are in close agreement on price. Conversely, a wide spread can mean lower liquidity or higher uncertainty about the asset’s value. In fact, the size of the bid-ask spread is often used as a measure of market liquidity – the smaller the spread, the greater the liquidity.
Liquidity and Market Depth
Liquidity refers to how easily you can buy or sell an asset without causing a big change in its price. In terms of the order book, liquidity is related to both the depth of buy/sell orders and the tightness of the spread.
A deep order book means there are significant volumes of orders at many price levels above and below the current price. This depth provides cushioning for large trades. On a highly liquid pair like BTC/USDT, if you want to buy, say, 5 BTC at market, the order book has enough depth that your purchase will fill from a small range of prices close to the last traded price. In contrast, in a thinly traded market with low liquidity, the same 5 BTC buy might “eat through” several layers of the order book, causing the execution price to rise as you exhaust cheaper asks.
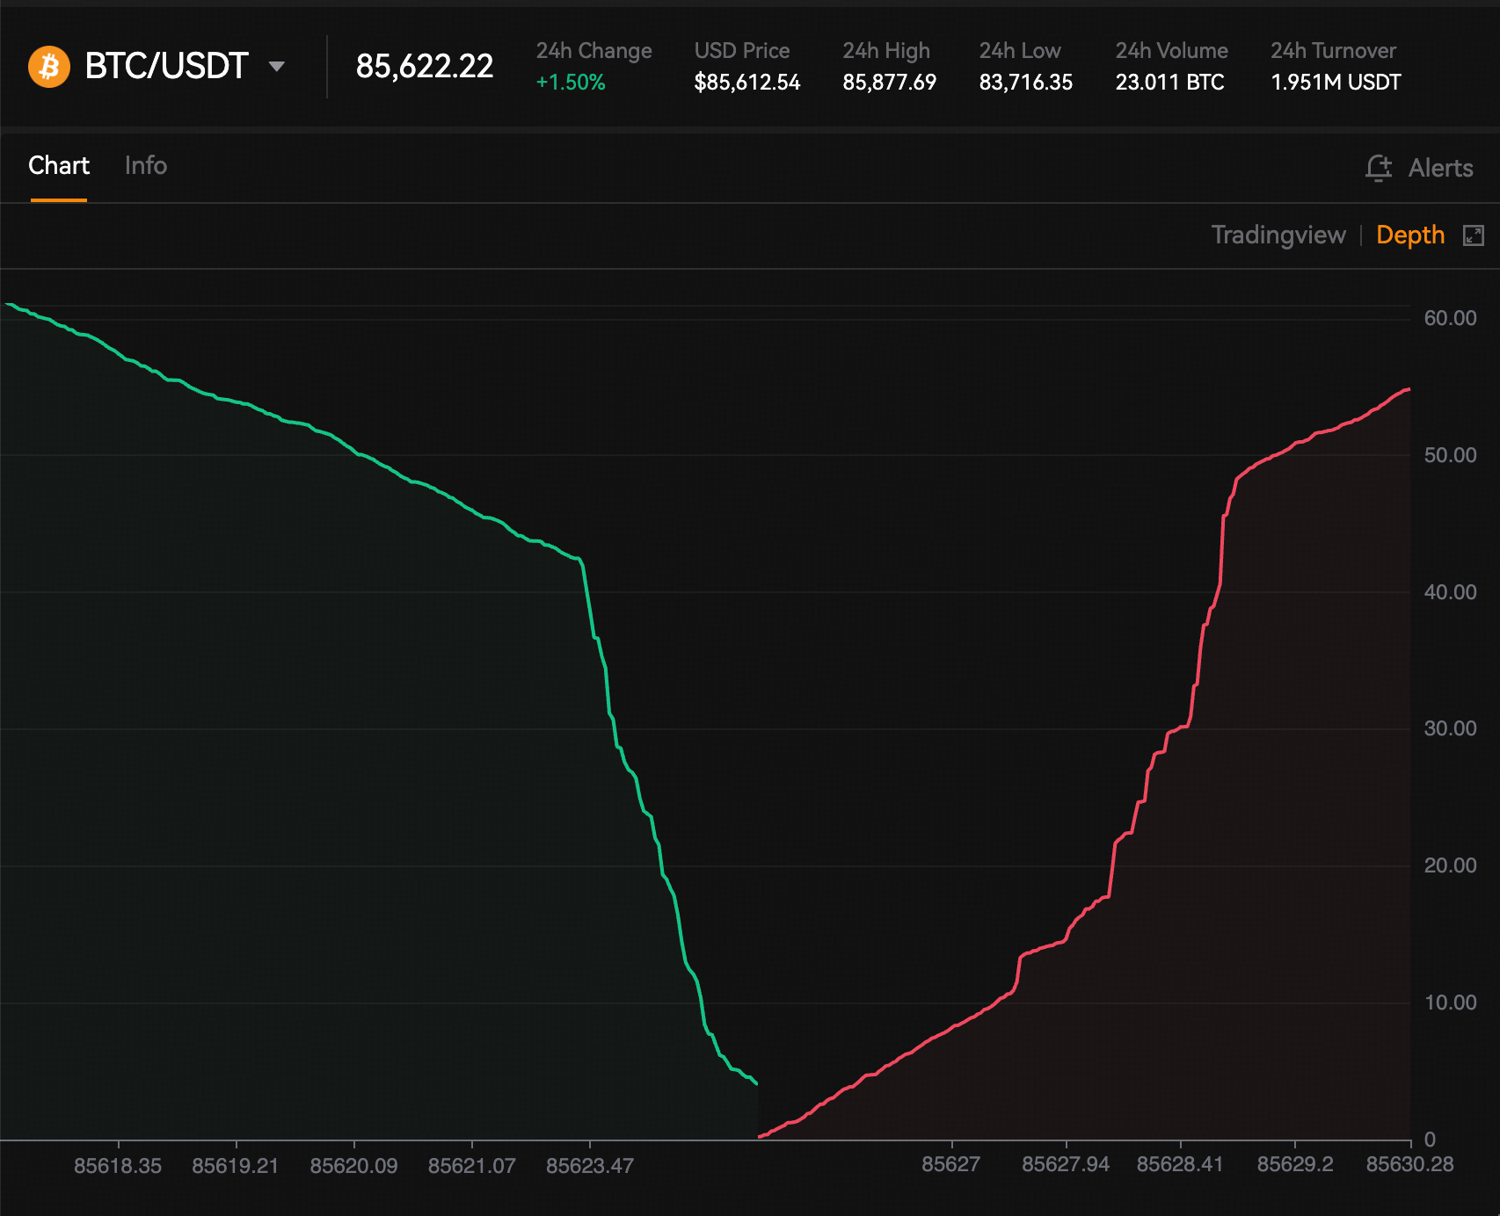
Market depth is commonly visualized using a depth chart, which plots the cumulative quantity of resting buy and sell orders at each price level. The x-axis represents price, while the y-axis shows cumulative order size. The green curve reflects cumulative bids, and the red curve reflects cumulative asks, typically forming step-like shapes due to discrete limit orders. The closest points between the bid and ask curves indicate the best bid and best ask, with the gap between them representing the bid–ask spread. A steeper curve indicates higher liquidity and greater market depth at those price levels, while a flatter curve indicates thinner liquidity.
Liquidity is also visible in the bid-ask spread: as mentioned, a smaller spread generally signals higher liquidity. When you assess a trading pair, it’s wise to glance at the order book or depth chart to gauge liquidity. A thick order book with lots of volume on each side means you can likely trade sizable amounts with little impact on price. A sparse order book (few orders or very small quantities at each level) is a warning that even a modest trade could move the market price.
Slippage
Slippage is the difference between the expected price of a trade and the price at which the trade is actually executed. In a liquid market, if the order book is thick, a market order will likely fill at a price very close to what you see (small slippage). In an illiquid market, the lack of volume at the best prices causes your order to spill into worse prices, and you end up paying more (or receiving less) than intended – that’s slippage.
Let’s say you want to buy 1 BTC, and the order book looks like this:
Sell Orders (Asks):
Price (USD) | Amount (BTC) |
30,000 | 0.5 |
30,050 | 0.3 |
30,100 | 0.4 |
You place a market buy order for 1 BTC.
- First 0.5 BTC is bought at $30,000
- Next 0.3 BTC is bought at $30,050
- Remaining 0.2 BTC is bought at $30,100
Your average price ends up higher than $30,000, even though that was the best price available when you clicked "buy." That difference between $30,000 (expected) and your average actual price ($30,040) is slippage.