- On-chain and technical indicators and broader market cycle metrics with over 30 indicators all suggest that Bitcoin remains below historical peak levels.
- Historically, Bitcoin’s strongest rallies and cycle highs have occurred in Q4 following a halving year. With ETF inflows, seasonal momentum, and easing monetary conditions, a rapid move toward a cycle top in November–December 2025 remains a likely scenario.
- Another possible outcome is an extended multi-year cycle driven by institutional adoption and structural demand. In this case, Bitcoin could continue appreciating into 2026–2027, experiencing shallower corrections (20–40%) instead of the deep 70% drawdowns of past cycles.
As we enter October, Bitcoin has historically moved into its strongest-performing months. This period also marks the fourth quarter (Q4) following a halving year, a phase in which Bitcoin has typically reached its cycle peak in previous bull runs.
Today, retail investors are asking a familiar question: Will the current bull run top out in Q4 2025? While no single indicator can predict the future with certainty, studying how past Bitcoin cycles have unfolded provides valuable context for understanding potential outcomes and managing risk effectively.
All Past Peaks Occurred in Q4 Following Halving Year
Bitcoin’s price history is often described in terms of a four‑year cycle tied to the “halving”, an event that cuts the reward for mining a block in half roughly every four years. In prior cycles the asset moved from accumulation to rapid growth, then into a bubble and finally a deep drawdown. Importantly, the peaks of these cycles have tended to cluster late in the calendar year post-halving.
In fact, all post-halving all-time highs in 2013, 2017 and 2021 occurred in November or December of those years.
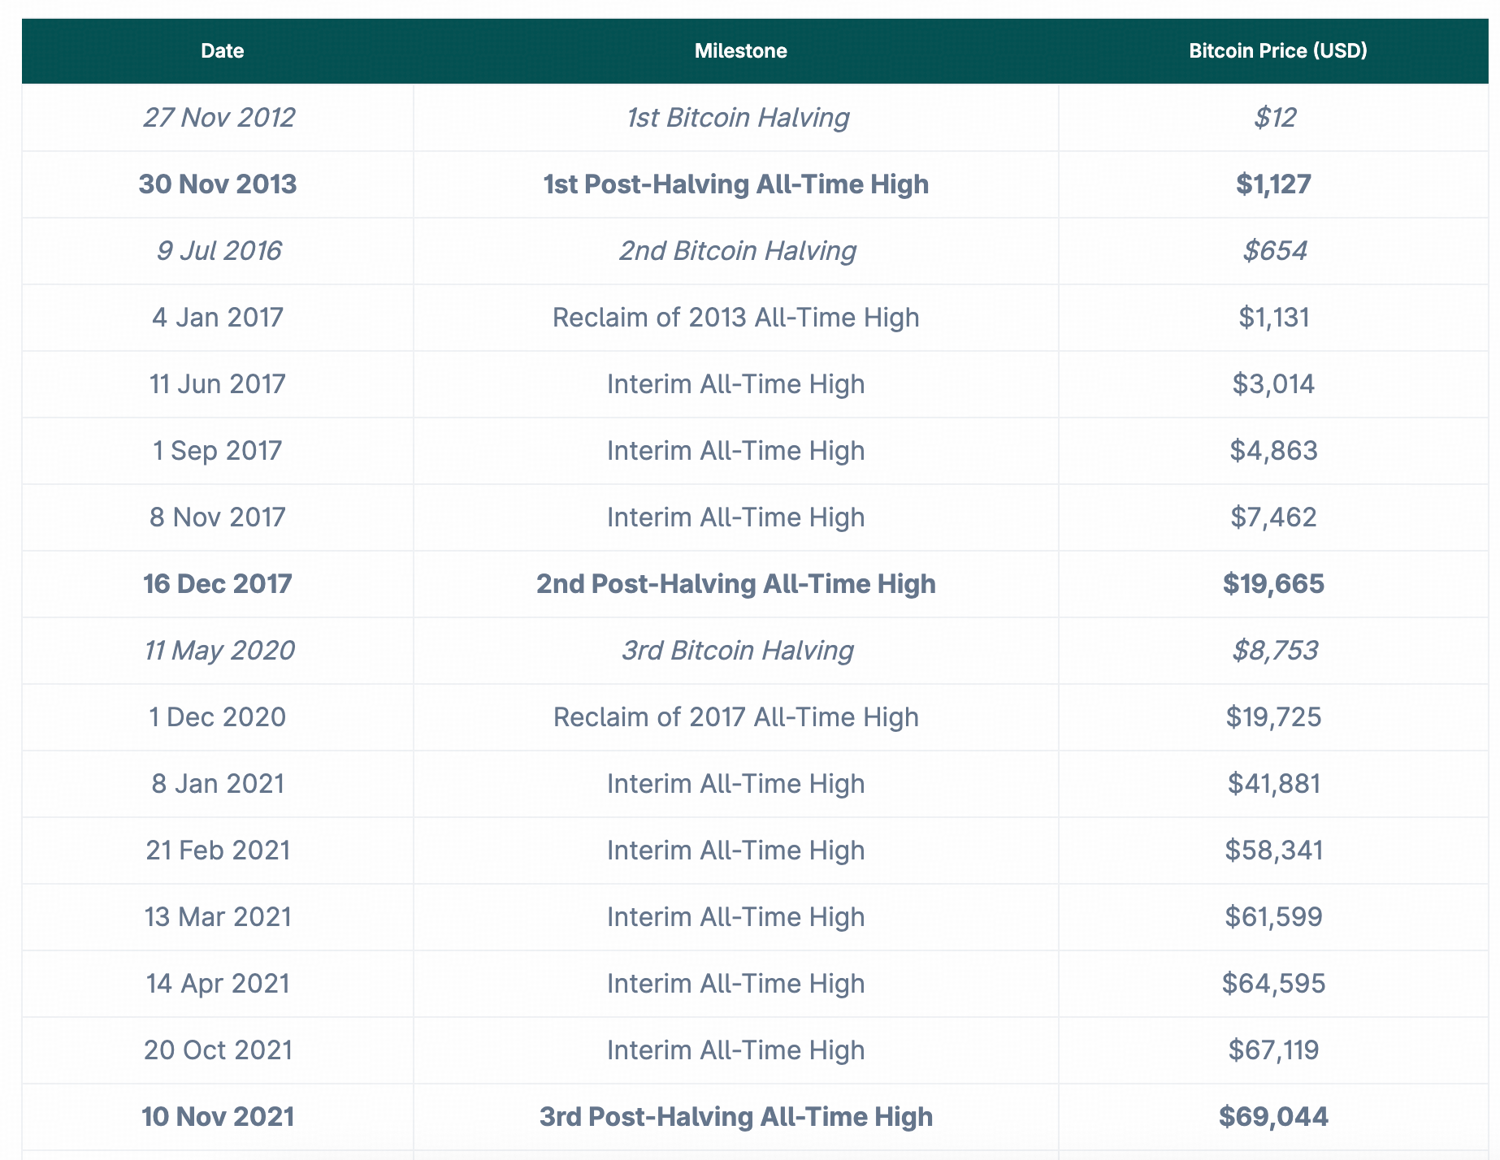
Source: https://www.coingecko.com/research/publications/when-bitcoin-all-time-highs
- December 2017: In the 2016–2020 cycle, Bitcoin traded around $1,000 in early 2017 before exploding higher. It closed at $19,188 on Dec. 16, 2017, essentially marking the cycle’s high.
- November 2021: In the next cycle, Bitcoin again shattered records, briefly touching $69,000 on Nov. 10, 2021 before falling sharply in the months that followed. That high arrived roughly 18 months after the May 2020 halving, fitting the historical pattern of cycle peaks 1.5 years post-halving.
- 2025 (Current Cycle): The current cycle began with a halving in April 2024 and has already delivered new highs in 2025. If the four‑year cadence continues, the window for a cycle peak could indeed arrive in Q4 2025, roughly 18–20 months after the latest halving. Past cycles do not guarantee future results, but they highlight how peaks often occur late in the year.
Technical Signals
50‑week moving average
Technical analysis provides context for Bitcoin’s cycle. One widely watched metric is the 50‑week moving average (approximately equivalent to a 350-day moving average). This smooth trendline has served as a barometer of Bitcoin’s long-term momentum. During bull markets, Bitcoin’s price tends to stay above this moving average, using it as a dynamic support level; sustained weekly closes below it often signal that a bear market or major correction is underway.

Source: CoinDesk
As shown above, the 50-week SMA has held as a floor throughout 2023–2025’s uptrend. As long as prices remain above this key moving average, the bull trend can be considered intact. However, if Bitcoin surges into late 2025 and then begins logging weekly closes below the 50-week SMA, it would be a strong sign that the cycle top may have occurred.
In past cycles, once the price definitively broke below the 50-week average, it marked a momentum shift, essentially the transition from bull to bear phase.
MVRV-Z score
The MVRV Z-Score is a well-known on-chain indicator used to assess Bitcoin’s valuation relative to its historical norms. It measures the difference between Bitcoin’s market value (price × circulating supply) and its realized value (the aggregate price at which each coin last moved on-chain), adjusted by standard deviation.
In simpler terms, it helps identify when Bitcoin is overvalued (market exuberance) or undervalued (capitulation or accumulation) compared to its long-term trend.
Historically, extremely high readings, typically above 6 or 7, have coincided with major market peaks (such as in 2013, 2017, and 2021), while readings below 0 have often marked deep bear-market bottoms.
As of early October 2025, the MVRV Z-Score is hovering around 2.4 to 2.6. This level indicates a moderately overheated market, showing strong investor optimism and price appreciation, but still far below the historical thresholds that have marked cycle tops.
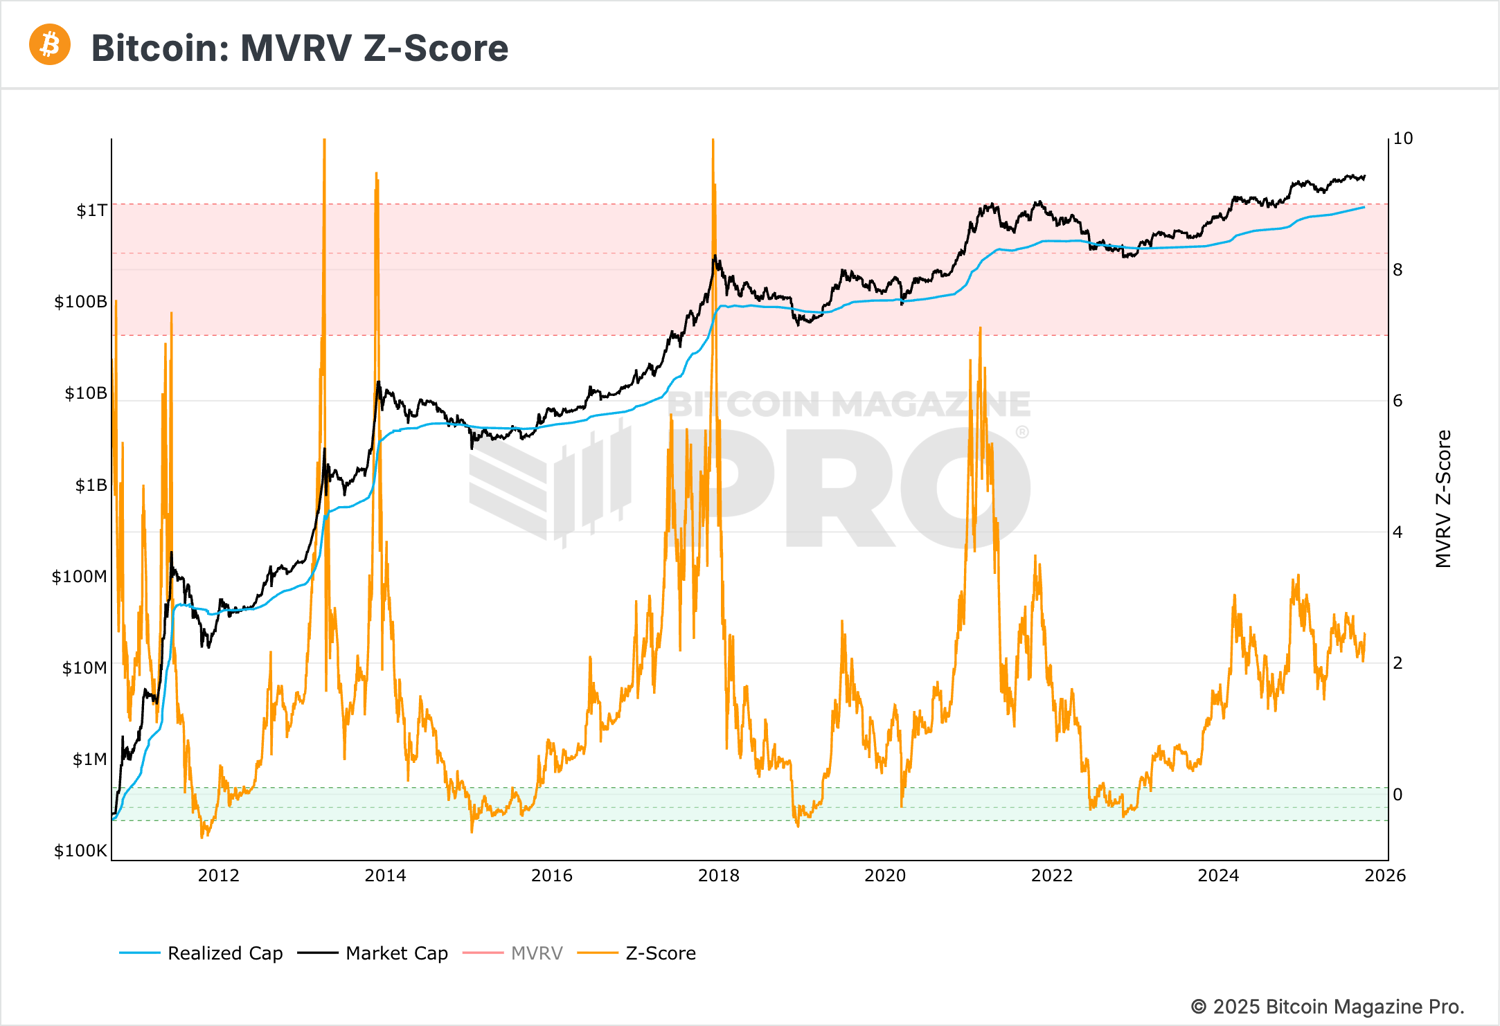
This suggests that Bitcoin may be entering the late stage of the current bull market, with room for continued growth before reaching the euphoria zone seen in past cycles. However, as the market matures and institutional participation through ETFs and custodial platforms grows, the extremes in on-chain indicators like MVRV may be less pronounced than in earlier cycles.
Bitcoin Puell Multiple
The Puell Multiple is an on-chain metric that measures Bitcoin miners’ daily revenue relative to its yearly average. It’s calculated by dividing the current daily USD value of Bitcoin issuance by the 365-day moving average of that value.
Understanding the Puell Multiple becomes easier when you know the key threshold levels. Values above 3.5 have historically correlated with potential market tops, as they indicate miner revenues are exceptionally high compared to their yearly average.
Conversely, readings below 0.5 have historically aligned with potential market bottoms. The "green zone," typically ranging from 0.3 to 0.5, signals that miner revenues are unusually low compared to their yearly average. During these times, miners are experiencing significant revenue stress, often forcing increased selling just as prices are already depressed. This creates conditions that have previously led to price rebounds once the selling pressure subsides.
As of early October 2025, the Puell Multiple stands around 1.1. This places the indicator firmly in a neutral to slightly positive zone, suggesting that miner profitability is healthy but far from excessive.
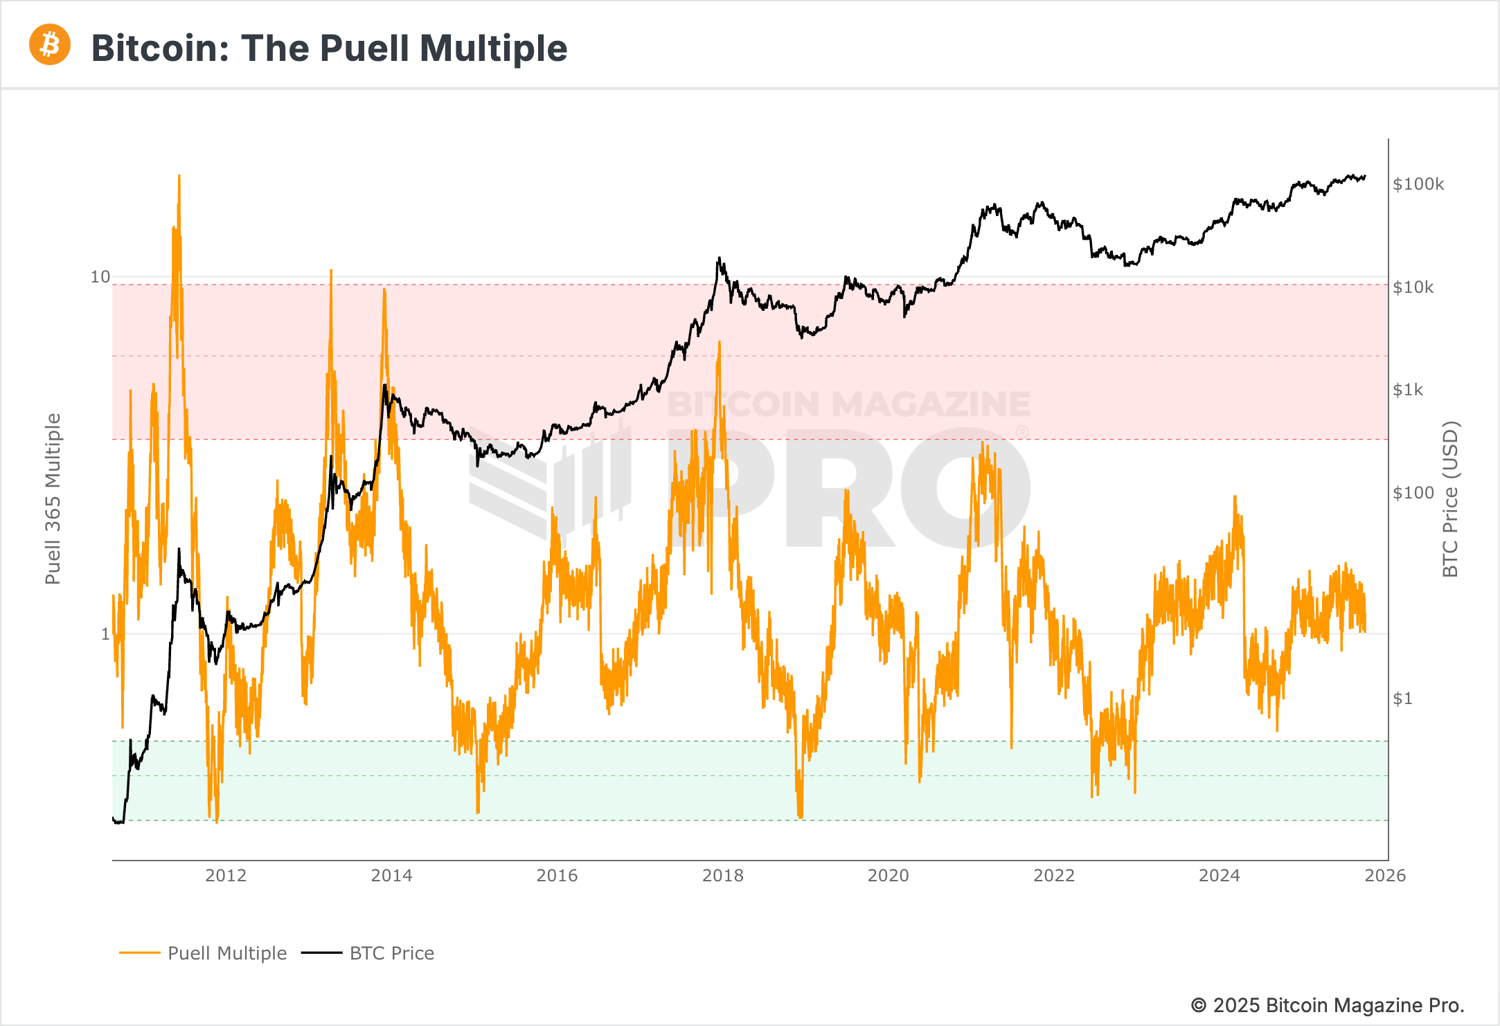
This reading implies that the current market is not yet near a major top. Miner revenue is improving alongside Bitcoin’s price recovery, but remains within sustainable levels. Historically, sharp climbs in the Puell Multiple, toward 2.5 or higher, have preceded tops, as miners begin realizing larger profits and increasing sell pressure.
Comprehensive Market Cycle Indicators
In addition to these major on-chain metrics such as the MVRV Z-Score and Puell Multiple, there are numerous other indicators used to gauge Bitcoin and crypto market’s position within the broader market cycle. While no single metric can provide a definitive answer about where we are in the cycle, analyzing them collectively can offer valuable insight.
According to CoinMarketCap’s Crypto Market Cycle Indicators, which tracks 30 different on-chain and macro indicators, all metrics currently remain below their historical peak zones. This suggests that, despite rising optimism and strong price performance, the market as a whole has not yet entered the kind of euphoric or overextended territory typically seen near major cycle tops.
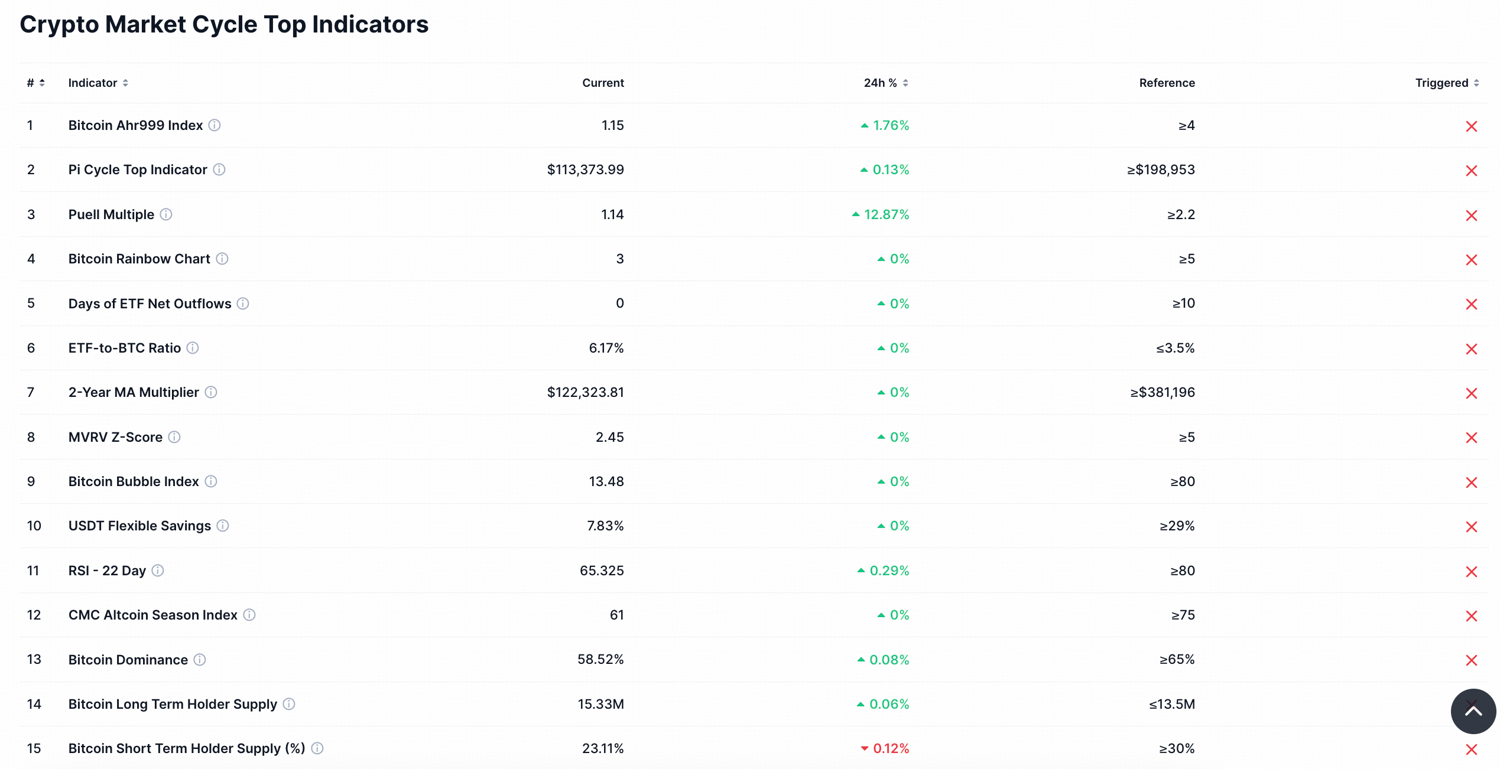
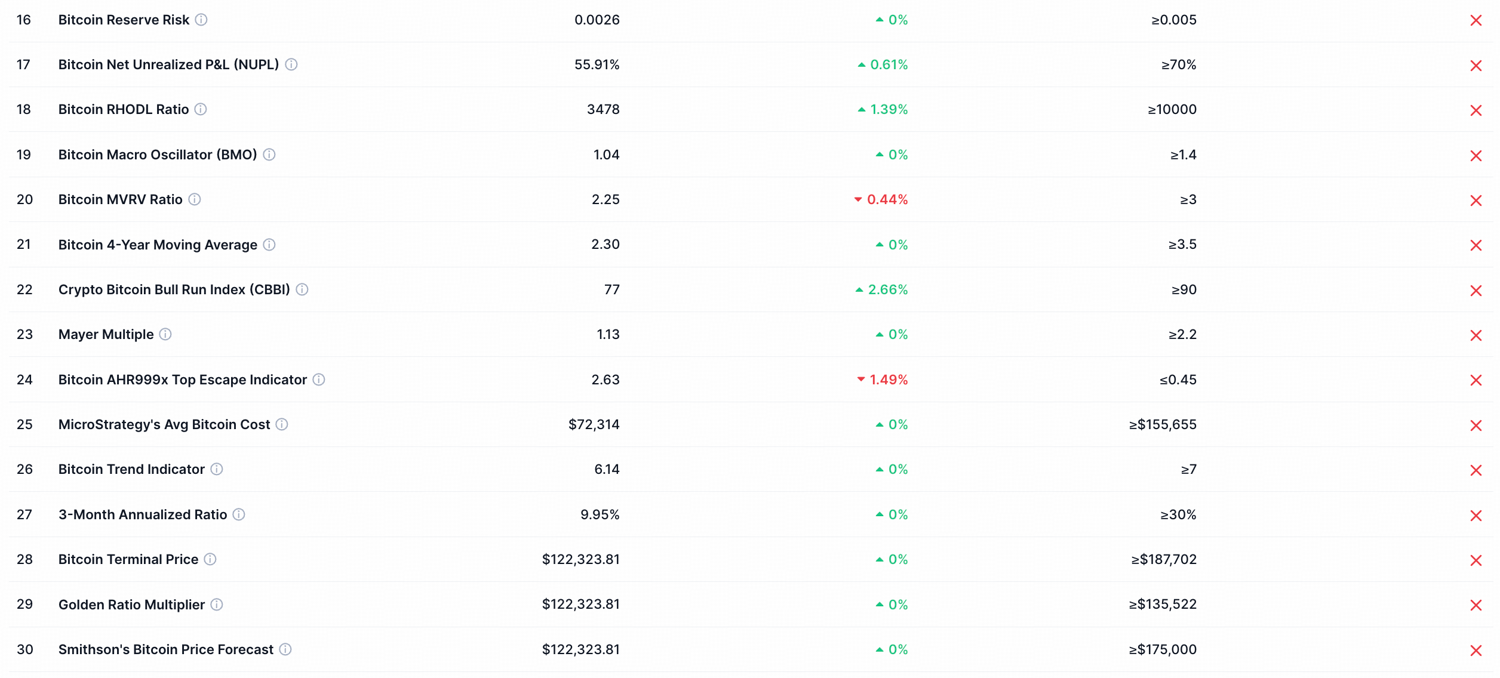
Source: https://coinmarketcap.com/charts/crypto-market-cycle-indicators/
Scenarios for Q4 2025
While Bitcoin is clearly not yet in a cycle top, history shows that Q4 is typically the most bullish quarter of the year. Given the accelerating momentum in recent weeks, it’s possible that prices could enter the cycle top range rapidly before year-end. Two broad paths appear plausible from here:
- Bitcoin rallies sharply and tops out in Q4 2025, or
- The cycle extends into 2026 and potentially a "super cycle".
Scenarios 1: Cycle Top in Q4 2025
Under this scenario, Bitcoin consolidates briefly before launching a strong rally fueled by seasonal strength, ETF inflows, and Fed rate cuts, triggering renewed “fear of missing out” buying through October and November. Prices could rise rapidly toward the $150,000–$180,000 range by late November or early December, as optimism peaks and speculative activity intensifies.
This would resemble past cycles, when Bitcoin’s blow-off tops occurred late in the year, such as December 2017 and November 2021. By early 2026, however, momentum may fade, with the price struggling to make new highs. A break below key technical levels (like the 50-week moving average) could signal a transition into a new bear phase, particularly if macro signals (e.g., falling Treasury yields) indicate slowing growth and risk aversion.
In this case, Q4 2025 marks the market peak, followed by a potential correction or early stages of a new “crypto winter” in 2026.
Scenarios 2: Extended Cycle
This scenario envisions Bitcoin entering a multi-year expansion phase, where the traditional boom-and-bust pattern gives way to a more gradual, structurally supported bull market. Strong ETF inflows, expanding institutional adoption, and deeper integration with traditional finance could sustain demand far longer than in previous cycles.
In an extended or so-called “super cycle,” Bitcoin’s price could continue appreciating well into 2026 and possibly 2027, supported by steady capital inflows, improved macro liquidity, and growing regulatory clarity. However, the term “super cycle” can be misleading, it does not imply the absence of a bear market, but rather a more contained downturn.
Instead of the severe 70%+ drawdowns seen in prior bear markets, corrections might be limited to 20–40%,(for example, a 40% drawdown from $180,000 would result in a price still above $100,000) as institutional investors, ETFs, and long-term holders absorb volatility and reduce forced selling. This would create a market characterized by shallower pullbacks and longer consolidation phases, driven by stronger capital retention and sustained investor confidence.
In this scenario, Bitcoin’s market structure matures into a more resilient long-term growth trajectory, though participants should still expect periods of cooling and correction, just far less extreme than in the past.
Disclaimer: The information provided herein does not constitute investment advice, financial advice, trading advice, or any other sort of advice, and should not be treated as such. All content set out below is for informational purposes only.