
Bitcoin has a reputation for moving in a rhythm: three strong years, then one bad one. Traders repeat it, bank strategists quote it, and every December brings a fresh argument about which year comes next.
The rhythm has a real record behind it. Bitcoin's last four major peaks landed roughly four years apart, the last three each about a year and a half after a halving, and each crash took close to a year to find its floor. Then 2025 ended in the red, when the saying called for a third good year, and 2026 has been weak too.
Whether the cycle still works depends on how you measure it. Counted in calendar years, it has already slipped. Counted from each peak to the low that followed, it has kept time remarkably well, while every swing has grown smaller.
What is the bitcoin 4 year cycle?
The bitcoin 4 year cycle is the pattern of bitcoin's price rising to a peak, crashing, bottoming and climbing again over roughly four years. Each turn has lined up with the halving, the cut in new bitcoin supply every 210,000 blocks, which is why traders often call it the halving cycle.
The name comes from the halving schedule rather than from any law of markets. Bitcoin's code halves the reward paid to miners every 210,000 blocks, which works out to about four years, and that keeps total supply just under 21 million coins (source: Bitcoin Wiki, Controlled supply). The cut happens automatically when the network reaches each of those block heights, so its timing is known years ahead. Four halvings have happened so far, on November 28, 2012, July 9, 2016, May 11, 2020 and April 20, 2024 in UTC (source: Bitcoin Wiki, Controlled supply). How the bitcoin halving works covers the mechanics and the schedule in detail.
The cycle itself is a description of what the price did after those dates. In the cleanest telling, the year after a halving brings a bull market and a blow-off top, the following year brings a deep bear market, and the next two years rebuild into the following halving. Morgan Stanley Wealth Management's Denny Galindo described it in November 2025 as a "three-up, one-down rhythm" in bitcoin's price (source: Cointelegraph, November 12, 2025). Halvings are scheduled by block count rather than by calendar, so the exact dates drift by weeks from one cycle to the next, and the price turns that follow them have drifted with them.
Bitcoin 4 year cycle chart
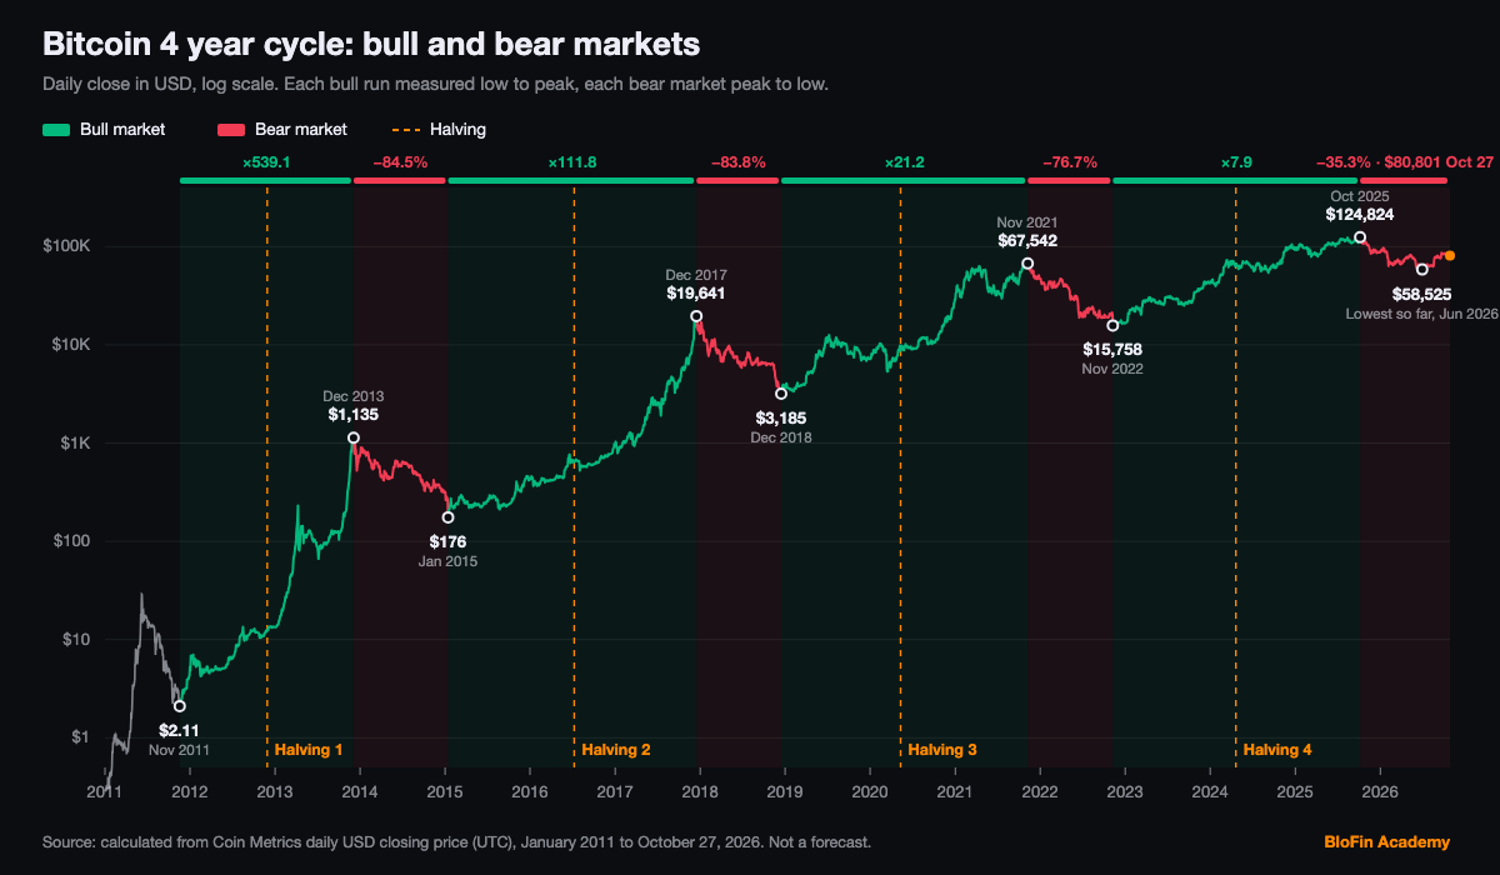
Bitcoin's four-year cycle in daily closes, from the November 2011 low to October 27, 2026. Source: calculated from Coin Metrics.
Laid out as dates, the cycle is easier to judge. Each cycle runs from a halving to the peak that followed, then to the lowest daily close after that peak, using Coin Metrics' daily closing price in UTC (source: calculated from Coin Metrics, USD closing price):
Halving (UTC) | Peak close | Lowest close after the peak | Fall from the peak | Days from peak to low | Days from that low to the next peak |
|---|---|---|---|---|---|
November 28, 2012 | $1,135 on December 4, 2013 | $176 on January 14, 2015 | −84.5% | 406 | 1,067 |
July 9, 2016 | $19,641 on December 16, 2017 | $3,185 on December 15, 2018 | −83.8% | 364 | 1,059 |
May 11, 2020 | $67,542 on November 8, 2021 | $15,758 in November 2022 | −76.7% | 366 | 1,062 |
April 20, 2024 | $124,824 on October 6, 2025 | $58,525 on June 30, 2026, so far | −53.1% so far | 267 so far | still open (source: calculated from Coin Metrics, USD closing price) |
Two dates carry small asterisks. The 2013 peak is close to a tie, because November 29, 2013 closed only 0.5% lower than December 4. The 2022 low falls on November 9 in Coin Metrics' data and on November 21 in Yahoo Finance's, though the two prices are only about 0.2% apart. Depending on the source, the day counts around that low shift by about 12 days. Galaxy Research, using its own data, counts the 2025 peak as arriving 1,062 days after the previous low (source: Galaxy Research, June 12, 2026), the same count Coin Metrics' closing prices give.
Does bitcoin go up three years and down one?
Bitcoin went up three years and down one three times in a row, from 2011 to 2022, measured from December 31 to December 31. In 2025 the pattern broke: after only two up years, bitcoin fell 6.3% in a year the saying called for a gain, and it was down another 7.7% in 2026 to October 27.
Calendar years are how most people quote the saying, so they are the fairest place to test it. These are bitcoin's yearly returns, from one year's last daily close to the next (source: calculated from Coin Metrics, USD closing price):
Year | Bitcoin's return | Up or down |
|---|---|---|
2011 | +1,471.4% | Up |
2012 | +187.3% | Up |
2013 | +5,286% | Up |
2014 | −56.0% | Down |
2015 | +34.0% | Up |
2016 | +125.5% | Up |
2017 | +1,336.7% | Up |
2018 | −73.5% | Down |
2019 | +94.4% | Up |
2020 | +304.9% | Up |
2021 | +59.7% | Up |
2022 | −64.4% | Down |
2023 | +155.5% | Up |
2024 | +121.2% | Up |
2025 | −6.3% | Down |
2026, to October 27 | −7.7% | Down so far |
From 2011 through 2022 the saying is exact: three up years, then a down year, three times over. After 2022 came only two up years. Yahoo Finance noted the 2025 break in January, reporting that Bernstein's analysts pointed to bitcoin's 6% decline that year (source: Yahoo Finance, January 7, 2026). The reason is timing. The 2025 peak came in October, so the fall that followed started inside 2025 and dragged the whole year into the red.
The down years have also varied enormously in size. A fall of 73.5% in 2018 came straight after a rise of 1,336.7% in 2017, while the small slip in 2025 followed two years in which bitcoin more than doubled each time. A year that ends slightly lower after two huge gains looks very different from a crash, even though the saying counts both as the one bad year.
How long bitcoin bull and bear markets last
Bitcoin's bear markets have each lasted about a year from peak to low, and its bull markets about two years and eleven months from low to the next peak. Those spans have been close to identical in all three completed cycles, which is why the cycle has kept its reputation despite the calendar slip.
Measured this way, the bear markets ran 406, 364 and 366 days, and the climbs from each low to the next peak ran 1,067, 1,059 and 1,062 days (source: calculated from Coin Metrics, USD closing price). Morgan Stanley Wealth Management reached a similar finding in October 2023, describing three crypto winters since 2011 that each spanned roughly 13 months, with lows arriving about 12 to 14 months after the peak (source: CryptoSlate, October 22, 2023).
That is the version of "three years up, one year down" the record actually supports. It describes the distance between turning points, and turning points rarely fall on December 31.
Say you had judged the cycle only by calendar years at the end of 2025. You would have seen a down year arrive one year early and might have concluded the cycle was finished. Judged from the October 2025 peak instead, the fall that followed sits squarely inside the one-year window the three earlier bear markets set.
How does the halving fit into the bitcoin cycle?
The halving fits into the cycle as the starting gun. Each of the last three peaks arrived about 17 to 18 months after a halving, and the first came about 12 months after. The usual explanation is a supply shock: fewer new coins reach the market while demand holds steady or grows.
The supply side is simple arithmetic. Since April 20, 2024, each block pays a subsidy of 3.125 bitcoin, down from 6.25, and the next halving at block 1,050,000 will cut it to 1.5625 (source: Bitcoin Wiki, Controlled supply). At about 144 blocks a day, that is roughly 450 new bitcoin a day (source: Look Into Bitcoin, Bitcoin 4-year cycle). Say you run mining machines and sell half of what you mine to pay for power. After the 2024 halving, the same machines earn half as many new coins, so you have half as many to sell, and that holds for every miner on the network at once.
The timing has been consistent. From the halving to the peak took 12.2 months in the first cycle, then 17.2, 17.9 and 17.5 months (source: calculated from Coin Metrics, USD closing price). In July 2025, Standard Chartered's Geoffrey Kendrick pointed out that past prices had fallen about 18 months after a halving, which put the risk in September or October 2025. He argued that buying by exchange-traded funds (ETFs) and companies might let bitcoin avoid that decline this time (source: CryptoSlate, July 2, 2025). The peak came on October 6, 2025, 534 days after the halving, right where the old timing put it.
The halving explains the timing better than the size. Each cut removes a smaller share of total supply than the last, and the same publisher that describes the supply shock adds that it is "dwarfed by institutional demand flows" today (source: Look Into Bitcoin, Bitcoin 4-year cycle). Some analysts give credit elsewhere. Arthur Hayes, the crypto investor, argued in October 2025 that the price and quantity of money, meaning dollar liquidity, drove past cycles (source: Arthur Hayes, October 8, 2025), and Morgan Stanley's Galindo has tied the rhythm to money supply as well (source: CoinPro, November 12, 2025).
Why is each bitcoin cycle smaller?
Each bitcoin cycle has been smaller, and the simplest explanation is size: each one starts from a much bigger market. Multiplying the price of a large market takes far more new money than multiplying a small one, so both the rallies and the crashes have shrunk with every cycle, and the record shows a steady decline in both.
The rallies tell the story most clearly. From each cycle's low to the next peak, bitcoin rose 111.8 times, then 21.2 times, then 7.9 times (source: calculated from Coin Metrics, USD closing price). Measured from the price on halving day to the peak that followed, the multiples were 92.0, 30.1, 7.9 and, in the latest cycle, 1.9. Say you had put $1,000 into bitcoin on halving day in 2016: by the December 2017 peak it would have been worth about $30,100. The same $1,000 on halving day in April 2024 was worth about $1,920 at the October 2025 peak.
The crashes have shrunk in step. Bitcoin fell 84.5%, 83.8% and 76.7% from the last three peaks, and its deepest close in the current cycle is 53.1% under the October 2025 peak. Galaxy Research describes the same pattern with its own figures, saying the tops have cooled every cycle and the bottoms have risen (source: Galaxy Research, June 12, 2026). By its measure of investor profit at the top, the October 2025 peak was the calmest on record.
Who owns bitcoin has changed too. Galaxy argues the real euphoria of this cycle came about 18 months before the peak, around the launch of US spot bitcoin ETFs. The climb after that, it says, looked like steady institutional buying rather than a retail frenzy (source: Galaxy Research, June 12, 2026). How bitcoin ETF flows work explains how those funds buy and sell.
Is the bitcoin 4 year cycle broken?
The bitcoin 4 year cycle is bent, not broken, on the evidence so far. The calendar pattern failed in 2025, but the peak arrived on schedule 534 days after the halving and the decline has followed the old timing. What has clearly changed is the size of each swing.
Analysts split sharply on the question in late 2025, and the year since has graded their calls. These are their views, each with the date it was reported:
Date | Who | View |
|---|---|---|
October 8, 2025 | Arthur Hayes, crypto investor | "the four-year cycle is dead", replaced by a cycle driven by money supply (source: Arthur Hayes, October 8, 2025) |
December 10, 2025 | Cathie Wood, ARK Invest | the four-year cycle will be "disrupted" (source: Decrypt, December 10, 2025) |
December 16, 2025 | Matt Hougan, Bitwise | expected new highs in 2026, "relegating the four-year cycle to history's dustbin" (source: Decrypt, December 16, 2025) |
December 19, 2025 | Jurrien Timmer, Fidelity | the cycle may have ended another halving phase, and 2026 could be an "off year" (source: Cointelegraph, December 19, 2025) |
January 7, 2026 | Bernstein | markets "have bottomed", and concern over the four-year cycle is "unwarranted" (source: Yahoo Finance, January 7, 2026) |
January 22, 2026 | Cathie Wood, ARK Invest | expected this cycle's drawdown to be the shallowest in bitcoin's history (source: Finviz, January 22, 2026) |
June 12, 2026 | Alex Thorn, Galaxy Research | the cycle "remains real on an empirical basis", with its amplitude compressed (source: Galaxy Research, June 12, 2026) |
June 24, 2026 | 21Shares | had expected the cycle to end, but "price action still looks familiar" (source: Decrypt, June 24, 2026) |
The calls that said the cycle was over have not fared well so far. Bernstein's January note put the bottom at about $80,000 in late November 2025 (source: Yahoo Finance, January 7, 2026). Bitcoin went on to close at $58,525 on June 30 (source: calculated from Coin Metrics, USD closing price). As of October 27, 2026, the new highs Bitwise expected for 2026 have also not arrived.
The case that something has changed still has weight. A 53% fall is far milder than the 77% to 85% crashes of earlier cycles, and 21Shares made that point itself while conceding the timing looked familiar (source: Decrypt, June 24, 2026). The fairest reading is that the timing has held while each swing has grown smaller.
Where is bitcoin in the 4 year cycle now?
Bitcoin is about 13 months past its October 2025 peak, in the stretch where earlier cycles found their lows. Its lowest close so far was $58,525 on June 30, 2026, 53.1% under the peak, and on October 27 it closed at $80,801, 35.3% under it.
The calendar of past cycles frames where that sits. October 27, 2026 was day 386 after the peak, and the three earlier bear markets bottomed on days 406, 364 and 366 (source: calculated from Coin Metrics, USD closing price). On day 386 of those earlier cycles, bitcoin was 71.9%, 79.4% and 75.7% under its peak. This time the figure is 35.3%, which makes the current decline the shallowest at this stage of the four cycles on record.
On-chain data points the same way. Glassnode noted on October 14 that, unlike the 2018 and 2022 bear markets, this one never closed below the Realized Price, the average price at which all bitcoin last moved. It added that long-term holders' realized losses had fallen by about 85% since peaking on August 12 (source: Glassnode, October 14, 2026). A day later, Glassnode and Coinbase wrote that bitcoin moved "from a bottoming process into an early recovery" in the third quarter (source: Glassnode and Coinbase Institutional, October 15, 2026). Neither report declares that the cycle low is in.
The headwinds are also real. Year-to-date flows into US spot bitcoin ETFs had turned negative by June 1, 2026 (source: Decrypt, June 1, 2026). The funds took in nearly $3 billion between September 21 and October 6, then saw about $760 million of net outflows over the next six days (source: Glassnode, October 14, 2026). The Federal Reserve raised its target range to 3.75% to 4.00% on September 16, 2026 (source: Federal Reserve, September 16, 2026), and what happens at an FOMC meeting explains why rate decisions move crypto. On BloFin, the BTCUSDT Perpetual tracks bitcoin around the clock through all of these events.
None of this says where the low is or whether it is behind us. The record only shows that past bear markets ended within about 13 months of the peak, and the current one is now at that point.
You can trade either direction of the cycle on the BTCUSDT Perpetual, going long if you expect a recovery or short if you expect another leg down.
How to trade bitcoin through the cycle on BloFin
BloFin lists the BTCUSDT Perpetual, which tracks bitcoin's price in USDT at up to 150x leverage. Each contract is 0.001 bitcoin, and a perpetual has no expiry date, so you can hold a long or a short position for as long as your margin supports it.
A cycle trade lasts months. A position held through months of a bull or bear market pays or earns a funding fee every eight hours on the BTCUSDT Perpetual, and over a long hold those payments add up. At a rate of 0.0214% per eight hours, a 1,000 USDT position pays about 0.21 USDT per payment, or about 0.64 USDT a day if the rate holds. The rate resets every period, and the live figure is on the BTCUSDT Perpetual page. How funding rates work shows how the fee is calculated and when longs pay shorts.
Work out the loss you can live with first, then pick leverage to match. Say you open a 1,000 USDT long on BTCUSDT at 5x, which ties up 200 USDT of margin and, at the October 27 close of $80,801, comes to about 12.4 contracts. A 13.1% fall, the size of bitcoin's drop on February 5, 2026 and its worst day of the year (source: calculated from Coin Metrics, USD closing price), costs about 131 USDT, or 65.5% of that margin. Liquidation is triggered on the mark price rather than the last trade, and how leverage and liquidation work shows how to find that price.
To open a position on BTCUSDT:
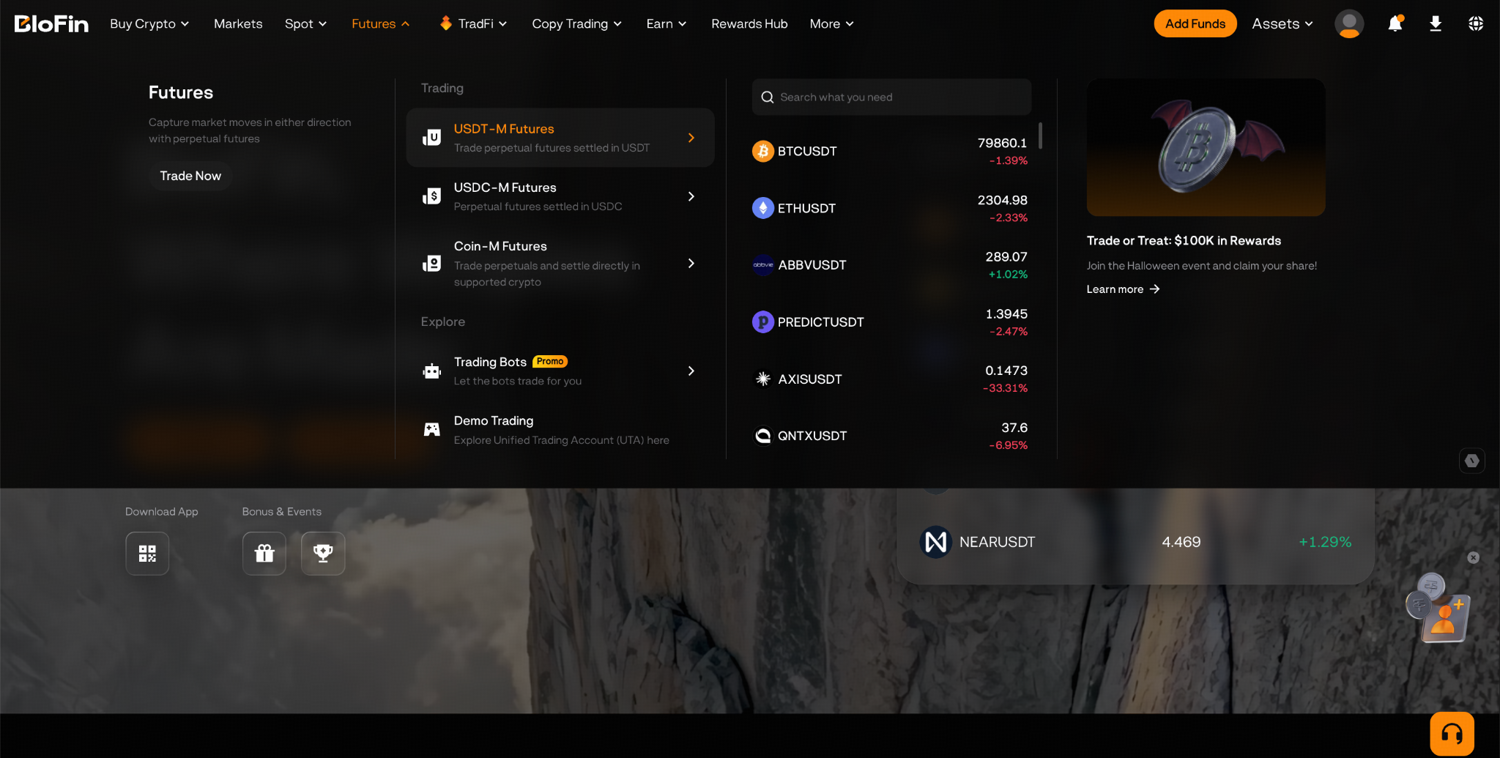
Step 1: Log in to your BloFin account and hover your cursor over the Futures tab. Then, click USDT-M Futures.
Step 2: Ensure that the trading pair shown above the chart is BTCUSDT Perpetual. Then, set your margin mode to Isolated and choose your leverage before entering any order.
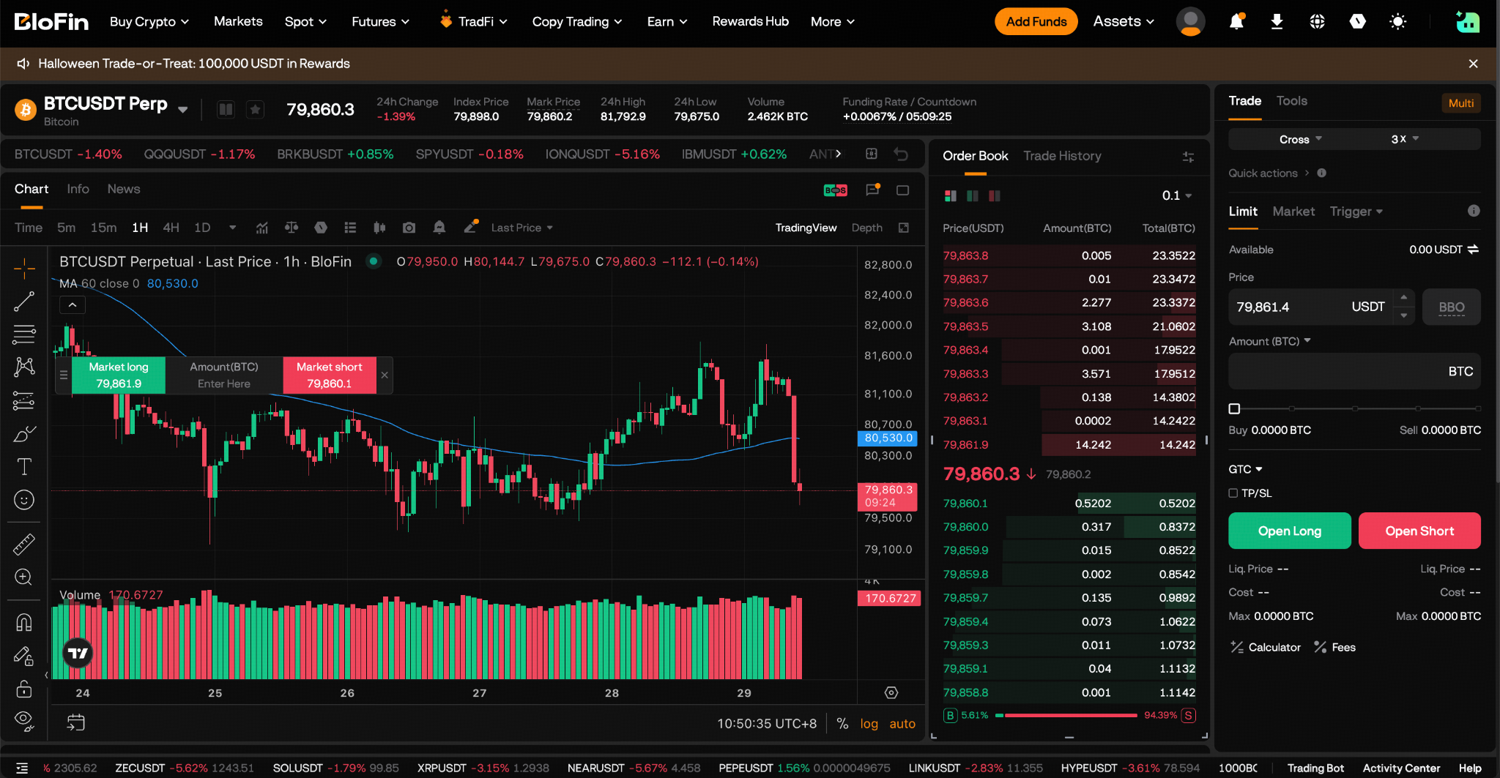
Step 3: On the order panel, select Buy long or Sell short, choose Market or Limit as the order type, and enter your size.
Step 4: Review the estimated margin and liquidation price, then submit. The trade appears in Positions with its entry price, size, margin used and estimated liquidation price.
A stop-loss caps a gradual move against you, but a triggered stop fills at the next available price, so in a fast fall like February 5 the exit can come well past the level you set. The guide to setting a stop-loss on BloFin gives the steps. BTCUSDT is also open to copy trading, so you can follow a lead trader's bitcoin positions instead of timing the cycle yourself, as how to copy trade on BloFin explains.
Looking to trade bitcoin? To get started, you'll need to first create a BloFin account, fund your account with cryptocurrency, and navigate to the BTCUSDT Perpetual page.
Frequently asked questions
What is the Pi Cycle Top indicator?
The Pi Cycle Top indicator, created by Philip Swift, compares bitcoin's 111-day moving average with twice its 350-day moving average, and flags a possible cycle top when the shorter average crosses above the longer one (source: TradingView, Pi Cycle Top Indicator). It crossed in April and December 2013, on December 16, 2017 and on April 12, 2021, which marked an April high seven months before that cycle's November peak, and it did not cross at all in 2025 (source: calculated from Coin Metrics, USD closing price).
When is the next bitcoin halving?
The next bitcoin halving will happen at block 1,050,000, when the block subsidy falls from 3.125 to 1.5625 bitcoin (source: Bitcoin Wiki, Controlled supply). Block times vary, so the date can only be estimated; at recent block speeds it lands around March or April 2028 (source: calculated from mempool.space block data), and Look Into Bitcoin projects it for around April 2028 (source: Look Into Bitcoin, Bitcoin 4-year cycle).
What is the 200-week moving average for bitcoin?
The 200-week moving average is the average of bitcoin's weekly closing prices over about four years, roughly one full cycle, and past bear-market lows have touched or broken it (source: Galaxy Research, June 12, 2026). On Coin Metrics' daily closes it stood at about $67,150 in late October 2026, and bitcoin's June 30, 2026 low closed under it (source: calculated from Coin Metrics, USD closing price).
What is bitcoin's all-time high?
Bitcoin's all-time high came in early October 2025, when it traded as high as $126,198 during the day (source: CoinPro, November 12, 2025). Its highest daily close was $124,824 on October 6 (source: calculated from Coin Metrics, USD closing price), which is why figures quoted for the peak vary by more than $1,000.
What did Morgan Stanley say about the bitcoin cycle?
Morgan Stanley Wealth Management wrote in October 2023 that most of bitcoin's gains have historically come directly after a halving, and that past crypto winters saw falls of about 83% (source: CryptoSlate, October 22, 2023). In November 2025, strategist Denny Galindo called the market's position "the fall season", the time to take gains, while saying the debate was how long it would last (source: Cointelegraph, November 12, 2025).
Researched and written by the BloFin Academy editorial team with AI-assisted drafting. All facts independently verified. Primary sources include Coin Metrics, the Bitcoin Wiki, the Federal Reserve, Galaxy Research, Glassnode, Morgan Stanley Wealth Management, Fidelity, Bitwise, ARK Invest, Bernstein, 21Shares and BloFin, current as of October 28, 2026.
Nothing in this article constitutes financial advice, and nothing in it is a recommendation to buy, sell or hold bitcoin or any crypto asset. The four-year cycle describes past prices and can stop working at any time; bitcoin has fallen more than 75% in past bear markets and lost 13.1% in a single day in 2026. A leveraged position held through a cycle pays funding along the way and can be liquidated, losing all the margin behind it. BloFin services are not available in restricted locations, including the United States. Past performance does not indicate future results. Do your own research and consider your risk tolerance before you trade on BloFin.