
Traders have drawn lines on silver charts for as long as the metal has had a quoted price, and decades of that history now sit behind any chart you open. The same few round numbers keep turning up, and each new rally or slide gets measured against them long before anyone talks about mines or solar panels.
A chart can be made to say almost anything. A round number gets called support one week and resistance the next, and each well-known indicator has a well-known miss. A "Buy" or "Sell" label tells you little without a record of how that label did the last time it appeared.
Technical analysis gives those levels and swings standard names. Reading them well comes down to three questions: which price series drew the level, which timeframe you are on, and how often the level held on silver itself rather than on some other market.
Silver's market on BloFin is the XAGUSDT Perpetual, a USDT-settled contract with a daily price bar for every day since its listing on January 8, 2026. Those bars are enough to compute every common indicator, with one gap worth knowing from the start: the slowest averages need more history than the contract has.
What is silver technical analysis?
Silver technical analysis is the study of silver's price chart, its levels, trends and momentum, to judge where buyers and sellers have acted before, using past prices and volume alone. On the XAGUSDT Perpetual, a 200-day moving average has existed only since July 26, 2026, because the contract listed in January.
Before you read any line, check which price the chart plots, because silver has several. Spot silver is the price for metal delivered now, and it set its record at $121.64 in January 2026 (source: Reuters via BNN Bloomberg). The London benchmark is set once a day, so its peak was lower, $118.45 on January 29 (source: Silver Institute, gold/silver ratio report). COMEX futures carry a delivery month, and the XAGUSDT Perpetual has its own price bars, with a highest high of 121.63 on January 29.
That spread matters more than it looks, because the spot and London records sit $3.19, or 2.7%, apart, so a line drawn at "the record" lands in a different place depending on the chart. Monthly averages smooth the peaks away even further, because a peak that lasts a few days barely moves a monthly average. The World Bank's average for January 2026 was $92.10 an ounce, 24.3% under the spot record set that same month (source: World Bank Pink Sheet, monthly data).
Two habits follow from that: name the series next to any level you write down, and compare a level only with prices from the same series. So the XAGUSDT Perpetual's levels come from its own daily closes, highs and lows, and the multi-decade levels from the World Bank's monthly averages and dated news reports of the peaks.
Choosing a timeframe for a silver chart
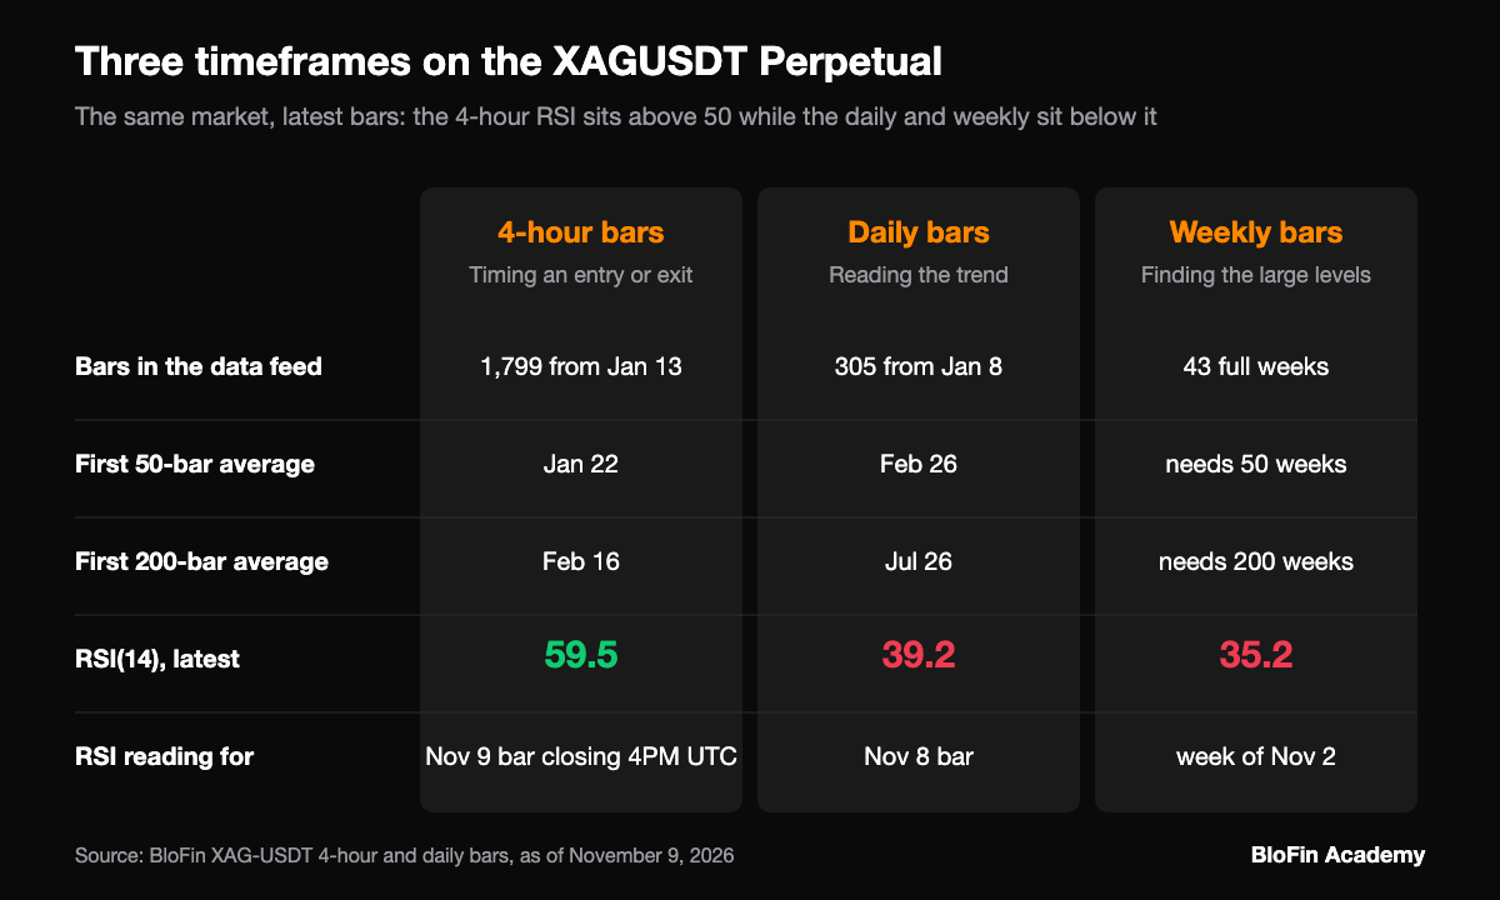
Three timeframes cover most silver chart reading: 4-hour bars for timing, daily bars for the trend and weekly bars for the large levels. On the XAGUSDT Perpetual, the 14-period RSI read 59.5 on the 4-hour bar that closed at 4PM UTC on November 9, 2026, against 39.2 on the November 8 daily bar and 35.2 on the weekly bar.
The reason for the gap is what each bar measures. The 4-hour reading covers a little over two days of trading, so it reflects the bounce since the November 3 low. The daily and weekly readings stretch back weeks and months, so they still carry the long slide from January. Neither reading is wrong, and a trade that looks early on one timeframe can look late on another.
BloFin's daily bars for the contract open at 12AM UTC, so a daily close is the last price before midnight UTC, and the 4-hour bars open every four hours from 12AM UTC. Grouping the daily bars into weeks that start on Monday gives 43 full weeks so far. That is enough for a 14-week RSI and far too few for a 50-week average.
Each timeframe also has its own history limit. BloFin's market data returns 4-hour bars only from January 13, five days after listing, so a 200-bar average on them covers only about 33 days of price. The daily chart has had a 50-day average since February 26 and a 200-day average since July 26. For anything older, such as the levels of 1980 or 2011, you need a longer series, and on a long chart the monthly bar is the usual unit.
The price levels silver keeps returning to
$20, $30 and $50 are the round numbers silver's long chart keeps coming back to. On World Bank monthly averages since 1971, the price crossed $20 fifteen times and $30 seven times, while $50 was crossed only once, in November 2025 (source: World Bank Pink Sheet, monthly data). Spot silver's peaks of 1980 and 2011 had both stopped just short of $50 (source: Reuters via Investing.com).
A level that stopped a fall before is called support, one that stopped a rise is called resistance, and a level that breaks often swaps roles. Silver's $30 shows the idea well. From 2013 through 2024, 88.2% of monthly averages sat between $15 and $30, so $30 worked as the ceiling of a range for more than a decade. The monthly average crossed it for the last time in September 2024 and has stayed over it since, so the period's highest month, $32.40 in October 2024, came after the break (source: World Bank Pink Sheet, monthly data).
$20 behaved differently, as a level the price kept passing through. The monthly average crossed it in 1979 and 1980, in 2010, in 2013 and 2014, in 2020 and twice in 2022 (source: World Bank Pink Sheet, monthly data). A level crossed fifteen times tells you where trading tends to cluster, and very little about which way the next cross will go.
Monthly averages also hide the peaks: January 1980 averaged $38.90 and April 2011 averaged $42.70, even though spot silver came within a dollar of $50 in both months (source: World Bank Pink Sheet, monthly data, Reuters via Investing.com). The averages show where the price spent its time, while the famous $50 ceiling was set by a few days of trading, so the peaks themselves come from dated reports of each day.

Chart patterns on silver
Silver's best-known chart pattern is the double top near $50. Spot silver peaked at $49.48 on January 18, 1980, when the London price was $49.45, and at $49.51 on April 28, 2011 (source: Reuters via Investing.com, Silver Institute, gold/silver ratio report). The pattern broke on October 9, 2025, when spot traded as high as $51.23 (source: Mining.com).
A double top is two roughly equal peaks with a trough between them, and it is one of the reversal shapes traders also track in chart patterns on gold and bitcoin. The standard test is strict: until the price breaks the support at the lowest point between the peaks, the reversal is unconfirmed (source: StockCharts, double top). Silver's lowest monthly average between its two peaks was $3.60, in March 1993, and the price never went back there after 2011 (source: World Bank Pink Sheet, monthly data). By that rule, $50 worked as a ceiling on spot twice and never completed a reversal.
The break came in October 2025, and November 2025 was the first month whose average sat over $50, at $50.40 (source: World Bank Pink Sheet, monthly data). A broken ceiling that the price later comes back down to is called a retest. On its own chart, the XAGUSDT Perpetual came back down to the same round number, 50 USDT, between October 30 and November 3, 2026. The contract closed under 50 on four days, at 49.40, 49.45, 49.87 and 49.97, and made its lowest low since listing, 48.73, on November 3. On November 4 the contract closed at 52.38, 7.5% over that low.
That is one test of the level, and a single bounce proves less than it seems. A retest that holds and one that fails look the same until the close that settles it.
The cup-and-handle reading and why it is disputed
A cup and handle is a rounded base followed by a shallow pullback and then a breakout, a pattern William O'Neil set out in his 1988 book (source: StockCharts, cup with handle). Analysts who apply it to silver's long chart disagree on where the handle is, and so on which price confirms it.
Ainslie Bullion put the cup from 1980 to the 2011 rim and the handle from 2011 to 2020, with $50 as the breakout level, on October 9, 2025 (source: Ainslie Bullion). Mike Maharrey of Money Metals Exchange described the same twin highs in September 2024 and wrote that a decisive break over $50 would complete the pattern (source: FXStreet). Mark Smallwood of Rapier Consulting wrote in September 2025 that a breakout over $36.50 to $42 had already confirmed it, with a handle running to 2024 (source: Hubbis).
The shape itself also sits outside the textbook. StockCharts' guide says a cup should ideally give back a third or less of the advance before it, and two-thirds at the most, while a handle gives back up to a third of the cup's advance (source: StockCharts, cup with handle). On World Bank monthly averages, the fall from January 1980's $38.90 to March 1993's $3.60 gave back 93.9% of the climb from $1.30 in October 1971. The later drop from April 2011's $42.70 to $14.10 in December 2015 gave back 73.1% of the climb from $3.60 (source: World Bank Pink Sheet, monthly data). The reading is a story told about a round number more than a pattern that meets its own rules.
The January 2026 blow-off top
A blow-off top is a steep, fast climb that ends in an equally fast reversal, usually on heavy trading. Silver's January 2026 peak fits that description on the XAGUSDT Perpetual's bars. Daily RSI reached 88.5 on January 28 with a close of 117.72, and the high of 121.63 came on January 29. On January 30 the close fell to 85.95, down 26.8% from the January 29 close of 117.48, on 60.7 million contracts, the largest volume since listing (source: BloFin XAGUSDT Perpetual daily candles).
Fibonacci retracements on silver's 2026 swings
Fibonacci retracements mark 23.6%, 38.2%, 50% and 61.8% of the distance between a swing high and a swing low (source: StockCharts, Fibonacci retracements). Measured on the XAGUSDT Perpetual from the January 29 high of 121.63 to the November 3 low of 48.73, the 38.2% level sits at 76.58 and the 61.8% level at 93.78.
The tool works the same way on any market, so the steps for drawing Fibonacci retracements apply unchanged to a silver chart; what changes is the choice of swing. Many charts add a fifth level at 78.6%, which StoneX used in an October 2026 silver note (source: StoneX). Two swings matter on the perpetual this year: the whole fall from the record, and the summer rally inside it.
Retracement | Up from the Nov 3 low, on the fall from the Jan 29 high | Down from the Aug 28 high, on the Jul 17 to Aug 28 advance |
|---|---|---|
23.6% | 65.93 | 67.28 |
38.2% | 76.58 | 64.90 |
50% | 85.18 | 62.97 |
61.8% | 93.78 | 61.04 |
78.6% | 106.03 | 58.30 |
The levels on the fall carry a catch, because the low that anchors them is only known after the fact, and a new low under 48.73 would move every one of them. At the November 8 close of 51.76, the contract had won back just 4.2% of the fall, so the whole ladder sits overhead.
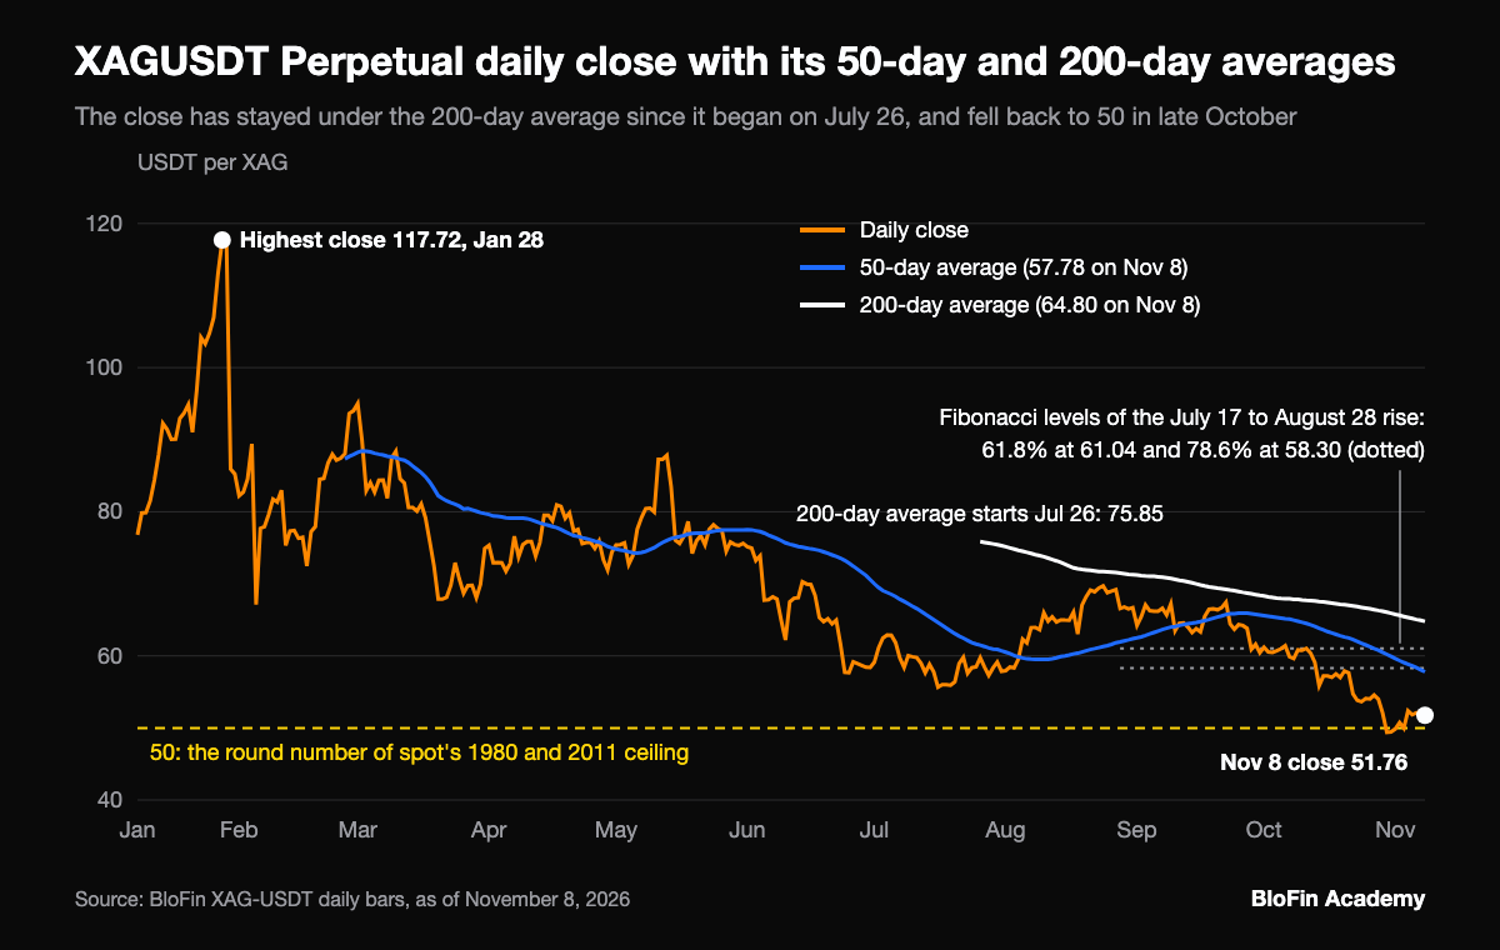
The summer advance gives a cleaner test of a level. StoneX analyst Razan Hilal wrote on October 2, 2026 that silver's decline had paused at the 61.8% retracement of its July to August advance. A break under 78.6%, the note added, would point back toward the year's lows (source: StoneX). StoneX left part of August's swings out when it measured the advance, so its level and the perpetual's need not match exactly. On the perpetual's low of 54.80 on July 17 and high of 71.14 on August 28, the price traded around the 61.04 level for about two weeks from late September. It then closed under 58.30 on October 14 and reached 48.98 on October 30. The 61.8% level drew buyers for about a fortnight, and the 78.6% level gave way on October 14.
Moving averages and the golden cross on silver
A golden cross is the 50-day moving average crossing over the 200-day, and a death cross is the reverse. The XAGUSDT Perpetual has had neither on its daily chart: since its 200-day average first appeared on July 26, 2026, the 50-day has stayed under it every day, at 57.78 against 64.80 on November 8.
A moving average is the average close over a set number of bars, and the 50-day and 200-day are the two most watched, often used together as a crossover signal (source: StockCharts, moving averages). The golden cross on bitcoin follows the same 50-day and 200-day rule, but on silver's perpetual the short history gets in the way. When the 200-day average first existed, at 75.85, the 50-day was already far under it at 61.49, so these bars cannot show when, or whether, a death cross formed earlier in the slide. The daily close has also stayed under the 200-day on all 106 days since.
The 50-day alone tells a busier story, because the daily close crossed it 21 times between March and September. Most of those crosses came in short bursts during April, May and September, so a single cross of the 50-day carried little weight on its own.
On the 4-hour chart, a 200-bar average exists from February 16, and its 50-bar and 200-bar lines crossed eight times (source: BloFin XAGUSDT Perpetual four-hour candles). Holding each signal until the next cross shows how it did:
Cross on the 4-hour chart (bar opening time) | Type | Close at the cross | Change to the next cross |
|---|---|---|---|
Feb 27, 8PM UTC | golden | 93.64 | -15.5% |
Mar 16, 4AM UTC | death | 79.10 | -6.6% |
Apr 12, 8PM UTC | golden | 73.86 | -2.4% |
Apr 30, 12AM UTC | death | 72.08 | +11.8% |
May 9, 8AM UTC | golden | 80.57 | -4.9% |
May 22, 12AM UTC | death | 76.59 | -19.0% |
Aug 6, 4AM UTC | golden | 62.01 | +7.0% |
Sep 7, 12PM UTC | death | 66.34 | -20.2% to the 4PM UTC close on November 9, still open |
Death crosses were followed by lower prices three times out of four, and golden crosses by higher prices once out of four. Over a fixed five days (30 bars) instead, golden crosses were followed by higher prices three times out of four and death crosses by lower prices twice out of four. In a year when the perpetual fell by more than half from its January high, the result depends on the holding period and says as much about the trend as about the signal.
RSI on silver and why it overshoots
The relative strength index (RSI) scores recent gains against recent losses on a scale of 0 to 100. The standard setting from its creator, Welles Wilder, uses 14 periods and calls readings over 70 overbought and under 30 oversold (source: StockCharts, RSI). On the XAGUSDT Perpetual's daily bars, RSI ranged from 88.5 on January 28 to 21.4 on October 30, 2026.
Silver overshoots those lines because its market is small for the money that moves through it. The Silver Institute points out that silver trades in a thinner market than gold, which is why money moving in or out shifts its price much more over short periods (source: Silver Institute, gold/silver ratio report). The daily RSI's first reading, on January 22, was already 81.1, with a close of 96.88. Anyone who read that as a signal to sell watched the contract close 21.5% higher before RSI fell back under 70. Ten days after that first reading, the close was 15.2% under January 22's. The only other overbought run on the daily chart began on May 11 at a close of 87.27, and ten days later the close was 12.1% lower.
StockCharts notes that RSI on a volatile market reaches its extremes more often, and that some traders raise the lines to 80 and 20 to cut the number of signals (source: StockCharts, RSI). On these bars, RSI closed over 80 on eight days, all of them from January 22 to January 29, so the higher line would have flagged only the final week of the climb.
Oversold readings had a mixed record, with the daily RSI falling under 30 in seven separate runs. Counted from the day each run began, the close was higher in six of seven runs five days later, three of seven ten days later, and two of the five with twenty days of history. Counted instead from the day RSI climbed back to 30 or more, the close five days later was higher in three of six runs and unchanged in one. The recent runs were weaker still: the three since August, starting October 14, October 23 and October 29, were followed by five-day moves of +2.0%, +0.3% and -4.1%.
On the 4-hour chart, the oversold signal held up better than the overbought one. Over 38 oversold runs, the close six bars later was higher 24 times, about 63%, while over 35 overbought runs it was lower 19 times, about 54%, close to a coin toss (source: BloFin XAGUSDT Perpetual four-hour candles).
Volume on a silver perpetual and on COMEX
Volume on the XAGUSDT Perpetual counts the contracts traded on one venue, while COMEX volume is the exchange's count of futures. Over the 31 days from October 9 to November 8, 2026, the perpetual's median day was 1,468,237 contracts, or 14,682 XAG, worth about 0.76 million USDT at the November 8 close of 51.76.
The futures market is vastly larger, and CME Group reported that its silver futures traded a record $50 billion of average notional value a day from January to June 2026 (source: Reuters via Kitco). The two figures cover different periods, so dividing one by the other means little. The gap in size still explains the rule of thumb: COMEX volume says how much the whole market cared about a move, and the perpetual's volume says how much BloFin's traders did.
Within one venue, volume still works as confirmation. Each contract is 0.01 XAG, which is how the median converts to 14,682 XAG. Around the test of 50, the perpetual traded 4,453,592 contracts on November 3, the day of the low, and 6,833,704 on November 4, about 3.0 and 4.7 times that median, so the bounce came on heavy trading. Weekends run much thinner on the contract, whose median weekend day since listing traded 22.4% of its median weekday, so a level that breaks on a Saturday breaks on light volume (source: BloFin XAGUSDT Perpetual daily candles).
To compare a level with today's trading, the XAGUSDT Perpetual page shows the contract's live price.
How to read a silver chart on BloFin
Read a silver chart from the longest timeframe down: find the large levels, check the trend against the 50-day and 200-day averages, then use RSI and volume for timing. On November 8, 2026, the XAGUSDT Perpetual closed at 51.76, about 3.5% over 50 USDT and 10.4% under its 50-day average (source: BloFin XAGUSDT Perpetual daily candles).
Put together, the read runs like this. On the long view, the perpetual sits just over 50, the round number of spot's old ceiling, which it came back down to test between October 30 and November 3. On trend, the close sits 20.1% under the 200-day average, with the 50-day still under the 200-day. Two daily levels sit close together overhead, the 50-day average at 57.78 and the 78.6% retracement of the summer advance at 58.30. On momentum, the daily RSI has climbed from 21.4 to 39.2 and the 4-hour RSI reads 59.5. On volume, the retest drew three to five times the usual trading (source: BloFin XAGUSDT Perpetual daily and four-hour candles).
A read like this describes where the price sits against each tool. The next step is deciding what to do with it, and silver trading strategies such as trend following, range trading and breakouts each use these levels in a different way.
Check one setting before you place an order around a level. On BloFin futures, a stop-loss order set as a TP/SL can trigger on the last price or the mark price, so check which one is selected next to the trigger price, while liquidation runs on the mark price.
The trade panel shows the mark price and last price side by side, and before you place an order it also shows an estimated Liq. Price for the size and leverage you choose.
Looking to trade silver? To get started, you'll need to first create a BloFin account, fund your account with cryptocurrency, and navigate to the XAGUSDT Perpetual trading page.

Frequently asked questions
Why do silver charts show different prices?
Each chart plots a different market, and the gaps between them are real: a futures chart may show the December COMEX contract, while the XAGUSDT Perpetual has its own prices in USDT. BloFin also shows an index price beside the contract's last and mark prices: on November 9, 2026, the 5.02PM UTC reading showed the index at 52.81, 0.03 under the contract's last and mark prices.
How does MACD read on silver?
The MACD indicator subtracts a 26-period average from a 12-period one and compares the result with a 9-period signal line. On the XAGUSDT Perpetual's daily closes for November 8, 2026, MACD stood at -1.82 against a signal of -2.16, after crossing back over the signal line on November 5. The line itself is still under zero, which reflects the October slide. It has crossed its signal line 19 times since listing, so like the 50-day average it flips often on silver.
How do Bollinger Bands look on a silver chart?
Bollinger Bands draw lines two standard deviations either side of a 20-day average. On the XAGUSDT Perpetual's daily closes for November 8, 2026, the middle band was 52.81, the upper band 57.49 and the lower band 48.13, a width of 17.7% of the middle (source: BloFin XAGUSDT Perpetual daily candles). The contract closed under the lower band on October 14, 22, 23, 30 and 31. A close outside a band marks an unusually fast move for recent conditions, and in October it came several times during the same slide.
Is the 50-day or the 200-day average more useful for silver?
The two averages answer different questions. The 200-day describes the long trend and changes slowly, so one day's close barely moves it. The 50-day reacts faster to recent closes, which is why price crosses it far more often. Many chart readers use the 200-day to set the direction they trade in, and the 50-day to judge when a pullback inside that trend has gone far enough.
What does the weekly silver chart show?
The weekly chart shows the slide since January in a few dozen bars. The five weeks from September 28 to October 26 closed at 60.72, 61.05, 57.48, 54.08 and 49.87, then the week of November 2 closed at 51.76. The weekly RSI's lowest reading so far, 32.6, came in the week of October 26, the week that closed under 50.
Researched and written by the BloFin Academy editorial team with AI-assisted drafting. All facts independently verified. Primary sources include BloFin's XAGUSDT Perpetual daily and 4-hour price bars, the World Bank Pink Sheet, the Silver Institute, StockCharts ChartSchool, StoneX, Reuters and Kitco, current as of November 10, 2026.
Nothing in this article constitutes financial advice, and nothing in it is a recommendation to buy, sell or hold silver in any form. Chart levels and indicators describe past prices and fail often: on January 30, 2026, the XAGUSDT Perpetual's daily bar ran from 118.52 down to 76.56, through every level drawn under it. A stop placed at a level can fill past it in a fast market, and on the XAGUSDT Perpetual leverage magnifies losses and liquidation runs on the mark price. Past performance does not indicate future results. Do your own research and consider your risk tolerance before you trade on BloFin.