
Some shares drift a little each day, while others swing far enough in one session to make the evening news. How far a price moves, and how often, shapes how big a sensible position is and how calmly a holder sits through a week of headlines.
One word covers several measures, and that causes confusion. Quote pages show a beta, options pages show an implied volatility and chart pages show an average true range. Each comes from its own window and method, so two websites can disagree about one stock on one day.
Measuring a stock's swings from its own daily closes clears much of that up. The daily changes give a standard deviation and a yearly figure. A market fund over the same dates gives beta and correlation, and a list of report dates shows how much of the movement lands on a handful of days.
Palantir Technologies (PLTR) swung from a sharp fall to a sharp rise within three sessions in November 2026, and those swings have a size and a history you can measure. On BloFin, the PLTRUSDT Perpetual follows that price with a perpetual contract settled in USDT, which also trades on weekends and has risks of its own.
What is Palantir stock volatility?
Palantir stock volatility is the size and frequency of PLTR's share price moves between daily closes. Over the year to November 9, 2026, its daily moves had a standard deviation, a measure of their typical spread, of 3.81%, or 60.5% annualized (source: Nasdaq PLTR historical data). That is about 2.8 times the Nasdaq-100 fund's 21.4% and 4.4 times the S&P 500 fund's 13.7% (source: Nasdaq QQQ historical data, Nasdaq SPY historical data).
Invesco QQQ Trust (QQQ) follows the Nasdaq-100 index, and SPDR S&P 500 ETF Trust (SPY) follows the S&P 500, so the two funds stand in for the market. The year to November 9, 2026 starts from the November 10, 2025 close, which gives 250 daily returns in Nasdaq's daily price tables.
In plainer terms, Palantir's average move in that year was 2.59% a day, up or down, against 1.01% for QQQ (source: Nasdaq PLTR and QQQ historical data). It moved 5% or more on 37 of the 250 sessions, while QQQ did that once and SPY never did.
A handful of days carry a large part of that. The four sessions that followed Palantir's quarterly reports in that year were 1.6% of the trading days. Those four days held 26.7% of the squared daily moves that volatility is built from (source: Nasdaq PLTR historical data). Much of the rest came on days when the stock moved for its own reasons more than with the market.
Palantir stock's swings from November 2 to 9, 2026
Palantir stock moved an average of 4.27% a session from November 2 to November 9, 2026, about 1.6 times its typical day of 2.59% over the past year (source: Nasdaq PLTR historical data). The largest move was the 9.73% fall on November 5, from $171.70 to $154.99. The stock then rose 3.48% and 5.50% over the next two sessions (source: Nasdaq PLTR historical data).
Palantir released its third-quarter results after the close on November 2. The next session closed 1.65% lower, but during the day the shares traded as much as 7.34% under the November 2 close (source: Nasdaq PLTR historical data). So the closing figure hid most of that session's range.
November 5 was the big day of the week. Palantir's fall was 2.6 times its typical daily standard deviation, and it came on a day when QQQ dropped 6.49% (source: Nasdaq PLTR and QQQ historical data). Outlets gave several overlapping reasons for that fall.
The rebound came with the market too: on November 9, Palantir rose 5.50% to $169.20 while QQQ rose 3.54% (source: Nasdaq PLTR and QQQ historical data). MarketBeat, writing on November 9, listed a broader tech rally after an earnings-related pullback among the reasons for the rise (source: MarketBeat). From the October 30 close to the November 9 close, the stock still lost 8.10% overall (source: Nasdaq PLTR and QQQ historical data).
Session | Palantir close | Palantir move | QQQ move |
|---|---|---|---|
November 2 | $178.34 | −3.13% | −1.36% |
November 3 | $175.40 | −1.65% | +0.62% |
November 4 | $171.70 | −2.11% | +0.97% |
November 5 | $154.99 | −9.73% | −6.49% |
November 6 | $160.38 | +3.48% | +1.40% |
November 9 | $169.20 | +5.50% | +3.54% |
How is stock volatility measured?
Stock volatility is usually measured as the standard deviation of daily returns, which is the typical distance of a day's move from the average day. To annualize it, you multiply by the square root of 252, because a year holds roughly 252 trading sessions. Palantir's 3.81% daily figure becomes 60.5% a year that way (source: Nasdaq PLTR historical data).
A daily return is the percentage change between two back-to-back closes. A stock that closes at $100 and then at $103 has a return of 3%. The standard deviation squares each day's distance from the average, averages those squares and takes the square root, so large days count for far more than small ones. For Palantir, 78.0% of the year's daily returns sat within one standard deviation of the average day, and 96.8% sat within two (source: Nasdaq PLTR historical data).
The annualized figure is a convention for comparing stocks, and it describes the past window only. A 60.5% yearly volatility does not mean the price moved 60.5% that year. It means daily swings of that size would add up to that much variation over a full year, if each day were independent of the one before.
Simpler measures tell the same story in fewer steps. The mean absolute move averages the size of each day's change and ignores its direction. For Palantir that was 2.59% a day, and the median was 1.84%, so half of the sessions moved less than that (source: Nasdaq PLTR historical data). A count of large days, such as the 79 sessions that moved 3% or more, shows how often the big swings arrive.

Palantir stock volatility compared with Nvidia, Tesla and the index funds
Palantir stock was more volatile than Nvidia, Tesla and both index funds over the year to November 9, 2026. Its annualized volatility of 60.5% compared with 45.9% for Tesla, 38.2% for Nvidia, 21.4% for QQQ and 13.7% for SPY (source: Nasdaq PLTR historical data, Nasdaq TSLA historical data, Nasdaq NVDA historical data, Nasdaq QQQ and SPY historical data). Each used the same method over the same 250 sessions.
Two more measures describe a stock's link to the market. Beta is the average size of its move per 1% market move, and correlation shows how closely its daily moves followed the market's.
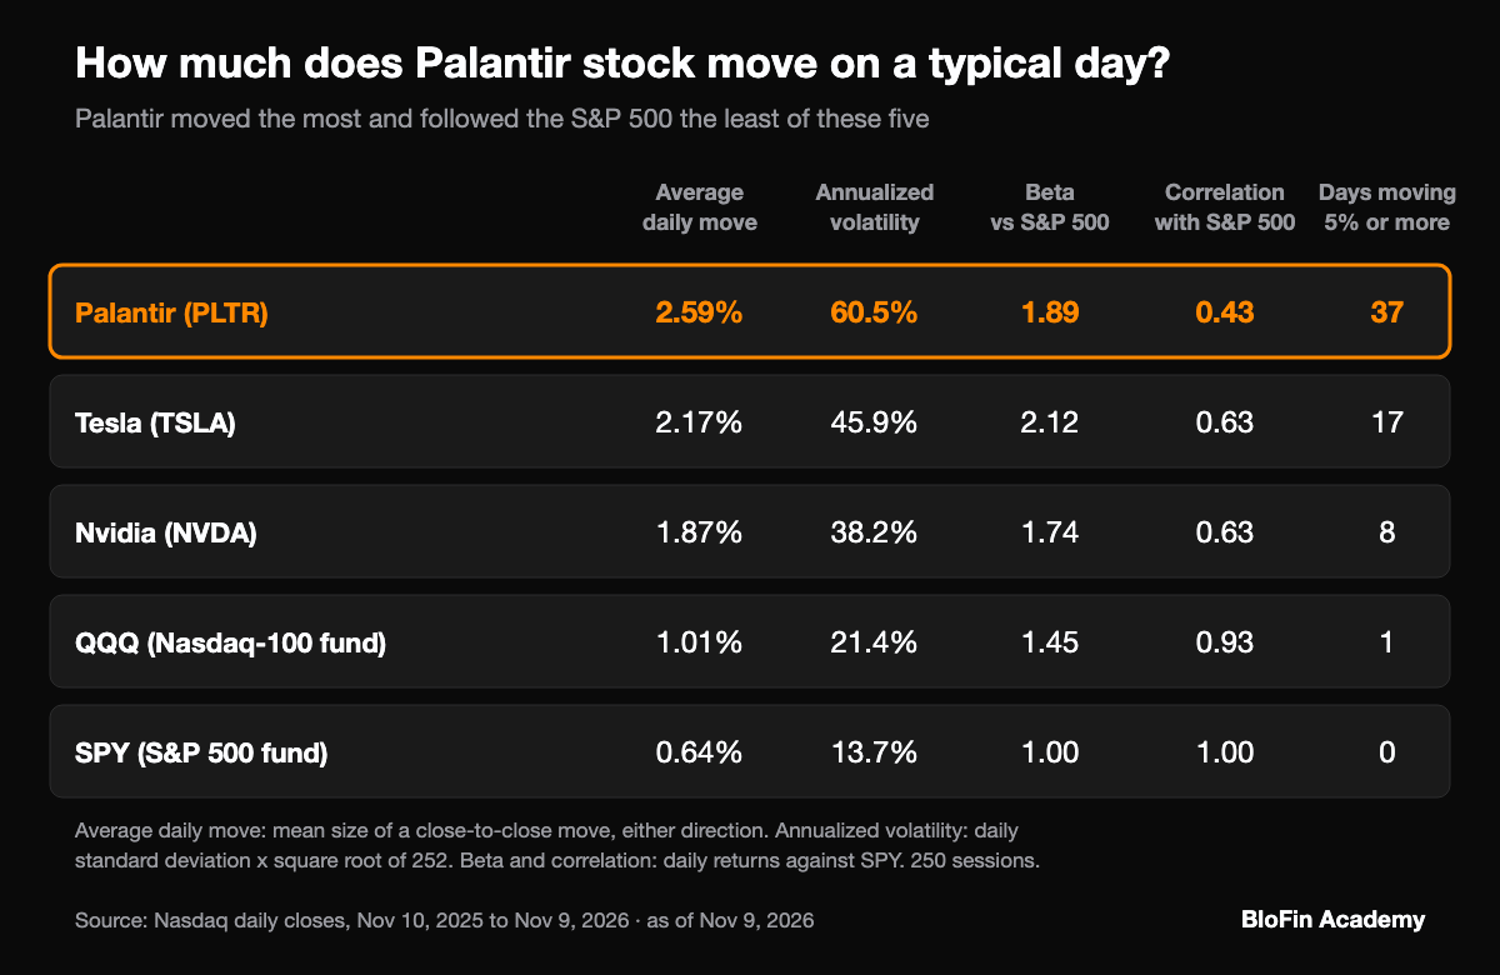
The gap shows most clearly in the large days. Palantir moved 5% or more on 37 sessions in that year, Tesla on 17, Nvidia on 8, QQQ on one and SPY on none (source: Nasdaq PLTR, TSLA, NVDA, QQQ and SPY historical data).
The three stocks also moved largely on their own, and Palantir's daily returns had a correlation of 0.28 with Nvidia's and 0.37 with Tesla's, so on many days one rose while another fell. Correlation runs between −1 and 1, where a reading of 1 means two series always rise and fall together in proportion and 0 means there is no steady link.
Bitcoin trades every day of the week, so lining it up with the share takes one extra step. Using its price at 12AM UTC on the morning after each Nasdaq session, bitcoin ran at 43.2% annualized over the same 250 sessions, with a correlation of 0.34 to Palantir (source: CoinGecko bitcoin historical data). On that reading, the share and bitcoin moved together only loosely.
What is Palantir's beta?
Palantir's beta against the S&P 500 was 1.89 over the year to November 9, 2026, measured on daily returns against SPY, and 1.25 against QQQ (source: Nasdaq PLTR, QQQ and SPY historical data). A beta of 1.89 means the stock moved about 1.9% for every 1% the market moved.
Beta comes from a simple calculation: plot each day's market return against the stock's return on the same day, then draw the straight line that fits those points best. Beta is the slope of that line, worked out as the covariance of the two series divided by the variance of the market. A slope of 1 means the stock moves in step with the market on average.
Published betas for Palantir differ because each uses its own window and frequency. The same Nasdaq closes give 1.89 on one year of daily returns and 2.71 on one year of weekly returns, all measured against SPY. Three years of daily returns give 2.06, and monthly closes from the end of October 2021 give 1.65 (source: Nasdaq PLTR and SPY historical data). On November 10, after the November 9 close, Stock Analysis listed a five-year beta of 1.61 for Palantir (source: Stock Analysis PLTR statistics).
The order between stocks can flip with the method too. On that same read, Stock Analysis listed five-year betas of 2.25 for Nvidia and 1.74 for Tesla (source: Stock Analysis). One year of daily returns against SPY gives the reverse order, 1.74 for Nvidia and 2.12 for Tesla (source: Nasdaq NVDA, TSLA and SPY historical data). Before comparing two betas, check that they share a window, a frequency and a market index.
Beta also gives a rough yardstick for a single day. On November 5, a beta of 1.25 times QQQ's 6.49% fall comes to 8.11%, against Palantir's actual fall of 9.73%. That leaves 1.62 percentage points beyond what the market link alone suggests. On November 9, the same sum gives 4.43%, against the actual 5.50% rise (source: Nasdaq PLTR and QQQ historical data).
Does Palantir stock move with the Nasdaq?
Palantir stock moves with the Nasdaq only loosely. Its daily correlation with QQQ was 0.44 over the year to November 9, 2026, and its R-squared was 0.19 (source: Nasdaq PLTR and QQQ historical data). In other words, QQQ's moves accounted for about a fifth of the variation in Palantir's daily returns. The other 80% or so was movement that QQQ did not explain.
R-squared is the correlation multiplied by itself, and it measures how much of one series' movement a straight-line link to another can explain. Against SPY the figure was 0.18, so both index funds tell the same story (source: Nasdaq PLTR and SPY historical data). Palantir and QQQ moved in opposite directions on 75 of the 250 sessions, or 30.0%. On 17 days, Palantir moved 5% or more while QQQ moved less than 1%.
Tesla shows why beta and correlation answer different questions. Against SPY over the same year, Tesla's beta was 2.12, higher than Palantir's 1.89. Yet Tesla's correlation was 0.63 against Palantir's 0.43, and its annualized volatility was lower at 45.9% (source: Nasdaq TSLA, PLTR and SPY historical data). Tesla's moves followed the market more closely, while more of the Palantir share's movement came from swings of its own.
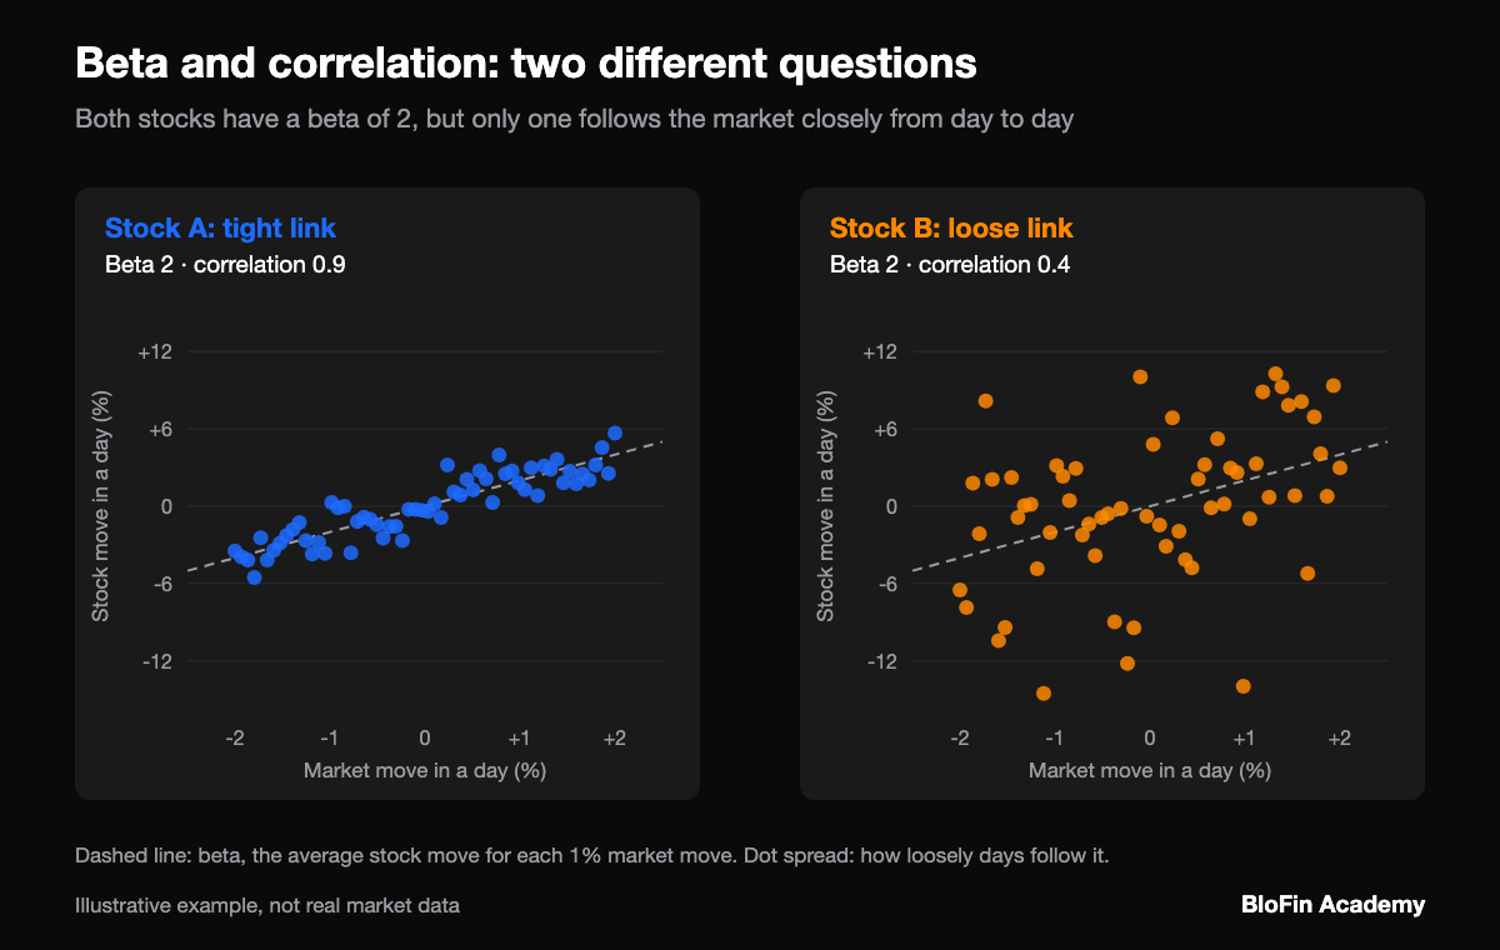
That loose link has a practical side, because a position in an index fund offsets only the part of Palantir's daily moves that tracks the index. Over this year, that part was about a fifth of the variation.
Palantir stock volatility by year since 2020
Palantir stock's annualized volatility stayed between 64.2% and 72.7% in each full calendar year from 2021 to 2025, after 112.4% in its first three months of trading in 2020 (source: Nasdaq PLTR historical data). The 2026 figure to November 9 is 62.9%, a little under 2021's 65.2% (source: Nasdaq PLTR historical data). So the stock has calmed only slightly as the company grew.
Each year's returns begin at the prior year's final close, use Nasdaq daily closes and are annualized with the square root of 252 (source: Nasdaq PLTR and QQQ historical data). The 2020 figure starts at Palantir's first close on September 30. Three months of returns is a short sample, so that figure is the least reliable of the set.
2022 was the most volatile full year, with 64 days of 5% or more, as the stock slid toward its lowest closes. Palantir's multiple of QQQ fell from 3.6 in 2021 to 2.8 in 2026. Part of that drop came from QQQ itself, which swung more in 2026 than in 2021. In both 2025 and 2026, Palantir still moved about three times as much as the Nasdaq-100 fund.
Year | Daily returns | Palantir annualized volatility | QQQ annualized volatility | Palantir as a multiple of QQQ | Palantir days moving 5% or more |
|---|---|---|---|---|---|
2020, from September 30 | 64 | 112.4% | 22.2% | 5.1 | 25 |
2021 | 252 | 65.2% | 18.2% | 3.6 | 42 |
2022 | 251 | 72.7% | 32.1% | 2.3 | 64 |
2023 | 250 | 69.3% | 17.9% | 3.9 | 47 |
2024 | 252 | 64.2% | 18.0% | 3.6 | 23 |
2025 | 250 | 67.2% | 23.6% | 2.9 | 44 |
2026, to November 9 | 215 | 62.9% | 22.2% | 2.8 | 34 |
How much of Palantir's volatility comes from earnings?
Palantir's earnings reactions account for a large share of its volatility. Since its first quarterly report in November 2020, the 25 sessions that followed its results were 1.6% of all trading days. They carried 22.4% of the stock's squared daily moves, the quantity that volatility is built from (source: Nasdaq PLTR historical data, SEC EDGAR Palantir 8-K filings).
Each reaction session is the first Nasdaq session to open after the SEC's EDGAR system accepted Palantir's results filing. The 2021 and 2022 reports, along with November 2023, were filed before the open, so the stock moved the same day. Recent reports have been filed after the close, so the next morning's session takes the move.
Squaring is what makes these days count so much, since one 20% day weighs as much as 100 days of 2%. Palantir's average reaction session moved 14.43%, against 2.84% on every other session since its first trading day (source: Nasdaq PLTR historical data, SEC EDGAR). Of the 25 reactions, 16 moved 10% or more.
The pattern held in the latest year, when the four 2026 reactions dated February 3, May 5, August 4 and, most recently, November 3 carried 26.7% of the year's squared moves. Without them, the year's annualized volatility drops from 60.5% to 52.2% (source: Nasdaq PLTR historical data). The largest rises were 30.80% on February 6, 2024 and 29.45% on August 4, 2026, and the largest fall was 21.31% on May 9, 2022. The 1.65% fall on November 3, 2026 was the smallest of all 25.
Why do retail traders and options make Palantir swing more?
Retail traders and options activity are two reasons outlets give for Palantir's large swings. The Motley Fool tied the stock's early-2021 volatility to its popularity on the WallStreetBets forum (source: Motley Fool, January 25, 2021). In September 2026, CNBC reported that Palantir sat inside the top 10 single stocks by options volume (source: CNBC).
WallStreetBets and the 2021 swings
In January 2021, the Motley Fool described Palantir as a long-time favorite of the WallStreetBets community on Reddit. It linked that popularity to a lot of volatility in the stock, and it noted that the short seller Citron Research had called Palantir a "full casino" in November 2020 (source: Motley Fool, January 25, 2021). On January 25, 2021, the stock traded 21.49% over the previous close at its high and 9.27% under it at its low. It closed 11.20% higher, and its annualized volatility for the first quarter of 2021 was 99.4% (source: Nasdaq PLTR historical data).
Most-owned lists and Alex Karp's following
Palantir's place on Robinhood's most-owned list has moved over time. In September 2025, the Motley Fool reported that Palantir was the seventh-most owned stock on Robinhood and that retail investors had been driving its momentum (source: Motley Fool, September 9, 2025). By February 2026, the Robinhood top 10 that the Motley Fool listed no longer included Palantir (source: Motley Fool, February 2, 2026).
The chief executive is part of the draw. Fortune reported in October 2025 that Alex Karp's quarterly shareholder letters, which quote philosophers, had drawn interest from what it called the company's "cult following of retail bulls" (source: Fortune). When a large, engaged retail base reacts to the same headline at the same moment, social-media attention can turn into a bigger daily move.
Options volume, weekly options and gamma
Palantir's options trade in heavy volume, and CNBC reported on September 3, 2026 that they were trading at nearly double their average daily volume, with traders buying twice as many calls as puts (source: CNBC). Earlier in the year, the flow had leaned the other way. A Schaeffer's Investment Research note in February 2026 counted more than 4.9 million calls and 5.1 million puts traded over 10 days (source: Schaeffer's Investment Research). The same note said Palantir had made its list of most-active options names every week of 2026 so far, with a weekly call expiring February 13 among the busiest contracts.
Options can feed back into the share price through hedging. Gamma measures how fast an option's sensitivity to the share price changes as the price moves. Dealers who sell options often trade the shares to stay hedged. When their positions leave them buying as the price rises and selling as it falls, that hedging can widen the move, and the opposite position can narrow it. Before the November 2 report, SpotGamma said positive gamma near the $184 share price it used could help dampen intraday volatility (source: SpotGamma). It added that a negative gamma pocket near $195 to $197.50 could amplify it.
Tesla, the other retail favorite
Tesla appeared beside Palantir in the same CNBC report on heavy retail options trading (source: CNBC). On the share data, Tesla was the steadier of the two over the year to November 9, 2026. It had 45.9% annualized volatility and 17 days of 5% or more, against 60.5% and 37 days for Palantir (source: Nasdaq PLTR and TSLA historical data). Their daily returns showed a correlation of only 0.37.
Implied volatility and realized volatility in Palantir stock
Implied volatility is the yearly volatility that option prices point to, and realized volatility is what the stock actually did. After the November 6, 2026 close, AlphaQuery showed Palantir's 30-day implied volatility at 55.76% (source: AlphaQuery PLTR implied volatility). Over a matching 21-session window to that close, about 30 calendar days, realized volatility was 60.3%, so implied sat 4.5 points under realized (source: Nasdaq PLTR historical data).
Dividing 55.76% by the square root of 252 gives about 3.51% a day (source: AlphaQuery, Nasdaq PLTR historical data). That is the typical daily move option prices were paying for. Implied volatility is a market price for uncertainty, so it rises when traders pay more for protection or for upside. It can sit over or under recent realized volatility, as it did after the November 6 close.
The same reading works around a report. Before Palantir's November 2 results, SpotGamma said options were pricing a move of about 13.3%. It based that on a $185 straddle, a call and a put at the same strike, costing about $24.47 (source: SpotGamma). The next session closed 1.65% lower with a low 7.34% under the November 2 close (source: Nasdaq PLTR historical data). The actual move between closes was much smaller than the priced one.
Palantir stock trading volume
Palantir traded an average of 41.4 million shares a session over the year to November 9, 2026, worth about $6.4 billion a day at each session's closing price. That compares with about $30.8 billion a day for Nvidia and $21.7 billion for Tesla over the 251 sessions from the November 10, 2025 close (source: Nasdaq PLTR, NVDA and TSLA historical data). Dollar volume is shares traded times the close.
Volume rises on the big days: on November 5, Palantir traded 50,014,330 shares, 121% of its one-year average. The November 9 rise came on 23,856,900 shares, 58% of that average (source: Nasdaq PLTR historical data). The 20 sessions from October 13 to November 9 averaged 26.5 million shares, well under the yearly figure, so the late swings came on lighter trading than usual.
Volume and volatility tend to rise together, but the link is loose. A large move on light volume can mean few sellers or buyers were in the market at that moment. A heavy day with a small move can mean buyers and sellers were evenly matched.
Reading Palantir's ranges with ATR and moving averages
Average true range (ATR) measures how far a stock typically travels in a day, including any gap from the previous close. Palantir's 14-day ATR was $9.72 at the November 9, 2026 close, 5.75% of the $169.20 close and up from 4.50% on October 30 (source: Nasdaq PLTR historical data). That figure uses Wilder's method on Nasdaq daily highs, lows and closes.
A day's true range is the biggest of three gaps. Those are the day's high less its low, the high less the prior close, and the prior close less the low. Wilder's ATR then smooths the daily figures over 14 sessions, giving each new day a weight of one fourteenth. Palantir's true range on November 5 was $19.10, about double the ATR two sessions later.
Traders use ATR to describe a normal day's range in dollars and to compare quiet stretches with busy ones. Some set stop distances or position sizes as a multiple of it, so a stock with a 5.75% ATR needs more room than one with 1%. ATR measures size only and says nothing about direction.
A moving average smooths the closes over a set number of sessions. At the November 9 close, Palantir's 50-day simple moving average was $185.54, with the close 8.81% under it. Its 200-day simple moving average was $153.53, with the close 10.21% over it (source: Nasdaq PLTR historical data). A stock that swings widely can sit far from its averages for long stretches, so the gap describes the recent path and gives no signal on its own.
Palantir stock drawdowns and valuation
Palantir's largest drawdown since 2020 was an 84.62% fall in closing price, from $39.00 on January 27, 2021 to $6.00 on December 27, 2022 (source: Nasdaq PLTR historical data). A drawdown is the fall from a peak close to the lowest close after it. It shows how far a holder has had to sit through a decline before any recovery.
The latest drawdown is shorter: from $209.05, its highest close, set on October 9, 2026, the stock fell 25.86% in 19 sessions to the November 5 close. At the November 9 close it stood 19.06% under that record (source: Nasdaq PLTR historical data).
Valuation can add to the size of these swings. A share priced at a high multiple of its sales holds more of its value in expectations about future growth. A change in those expectations can then move the price a long way.
PLTRUSDT volatility on weekdays and weekends
The PLTRUSDT Perpetual on BloFin trades every calendar day, so its UTC-day candles also cover days when Nasdaq is closed. From February 10 to November 9, 2026, its median daily range was 4.34% of the opening price on 189 Nasdaq session days, against 0.94% on 84 weekend and US holiday days (source: BloFin PLTRUSDT market data).
That is a separate series from the share, whose own median session range on Nasdaq over the same 189 sessions was 3.90% of the opening price (source: Nasdaq PLTR historical data). The share's session lasts six and a half hours, from the 9.30AM ET open to the 4PM ET close, which is 2.30PM to 9PM UTC in standard time and 1.30PM to 8PM UTC in US summer time. The contract's day runs from midnight to midnight UTC.
Candles on weekends and holidays are thin, with median volume about 22% of a session day's contract volume (source: BloFin PLTRUSDT market data). Outside Nasdaq's regular trading hours, BloFin's trade page warns, price movement in the underlying asset may be limited and its liquidity reduced (source: BloFin PLTRUSDT Perpetual page). The November weekend fits that pattern, as the contract moved 1.11% between its November 6 and November 8 closes, then rose 6.72% across the UTC day of November 9, from 159.29 to 169.99 USDT.
Its widest UTC-day ranges came on August 3 and August 4, at 16.99% and 15.17%, around Palantir's second-quarter report (source: BloFin PLTRUSDT market data). During those closed hours, BloFin may restrict order placement on the contract to reduce-only orders, which are for closing a position (source: BloFin PLTRUSDT Perpetual page).
Leverage multiplies these swings, so at 10x a 5.75% move, about one day's ATR, equals 57.5% of a position's margin, and a position can be reduced or liquidated before the whole margin is gone. A position opened at a lower leverage level, such as 5x, loses 28.75% of its margin if the same 5.75% move goes the wrong way.
The PLTRUSDT Perpetual page shows the contract's last price, mark price and 24-hour high and low in one place. It lets you follow those swings through the week and over the weekend.
How to measure Palantir's volatility yourself
You can measure Palantir's volatility yourself with a free daily price table and a spreadsheet. Turn each close into a percentage change, find the standard deviation of those changes and multiply the result by the square root of 252. A fund's closes from the same dates, set beside them, then give beta and correlation.
Step 1: Save Palantir's daily history from Nasdaq's historical data page. Then save QQQ's or SPY's for the same dates, so each line pairs the same session.
Step 2: In the next column, work out each day's return as that day's close divided by the previous close, minus 1. Do the same for the fund.
Step 3: Apply the spreadsheet's standard deviation function, STDEV.S, to Palantir's returns, then multiply the result by SQRT(252) for the annualized figure. A year of returns to November 9, 2026 gives 3.81% a day and 60.5% a year (source: Nasdaq PLTR historical data).
Step 4: Use SLOPE, with Palantir's returns first and the fund's second, to get beta. CORREL gives the correlation, while RSQ gives the R-squared. Switching to weekly closes then shows why published betas differ.
Step 5: Mark the sessions that followed each results filing on the SEC's EDGAR list. Then recompute without them to see how much of the volatility came from report days.
The figures will differ a little from site to site, because each data provider picks its own window, frequency and index. Writing those three choices beside any volatility figure makes it comparable with the next one you see.
Looking to trade Palantir? To get started, you'll need to first create a BloFin account, fund your account with cryptocurrency, and go to the PLTRUSDT Perpetual trading page.

Frequently asked questions
How much does Palantir stock move in a day?
Palantir stock moved 2.59% a day on average over the year to November 9, 2026, up or down, and half of its sessions moved less than 1.84%. Of its 37 moves of 5% or more, 21 were falls and 16 were rises, and three reached 10% or more (source: Nasdaq PLTR historical data).
What does a beta of 2 mean?
A beta of 2 means a stock has moved about 2% on average per 1% market move, up or down, over the window measured. It describes the average link only, so the stock can still swing on its own news. Palantir's one-year daily beta against SPY to November 9, 2026 was 1.89 (source: Nasdaq PLTR and SPY historical data).
Is Palantir a meme stock?
Commentators disagree on whether Palantir is still a meme stock, an informal label rather than a defined category. In remarks Insider Monkey reported on July 16, 2025, Jim Cramer called it a meme stock and said "the memesters won't let the stock come in" (source: Insider Monkey via Finviz). On January 2, 2026, MarketBeat wrote that the stock's 2025 surge had effectively ended its time as a meme stock (source: MarketBeat via Finviz). In 2026 to November 9, only 3 of Palantir's 34 moves of 5% or more came on the session after a results report (source: Nasdaq PLTR historical data, SEC EDGAR).
Was Palantir popular on WallStreetBets?
Yes. In January 2021, the Motley Fool called Palantir a long-time favorite of the WallStreetBets forum (source: Motley Fool, January 25, 2021). That month, its average daily move was 4.97%, against 2.67% in 2026 to November 9 (source: Nasdaq PLTR historical data).
What was Palantir's most volatile year?
Among full calendar years, 2022 was Palantir's most volatile, at 72.7% annualized (source: Nasdaq PLTR historical data). Within that year, the second quarter ran highest, at 89.8%. Since the start of 2022, only the first quarter of 2025 has run higher, at 90.3%.
Researched and written by the BloFin Academy editorial team with AI-assisted drafting. All facts independently verified. Primary sources include Palantir's quarterly results filings on SEC EDGAR. Price data comes from Nasdaq's daily tables for Palantir, Nvidia, Tesla, QQQ and SPY and from CoinGecko for bitcoin, with figures and reporting from Stock Analysis, AlphaQuery, SpotGamma, MarketBeat, Insider Monkey, CNBC, The Motley Fool, Schaeffer's Investment Research and Fortune. BloFin facts come from its PLTRUSDT Perpetual page and its own PLTRUSDT market data, current as of November 10, 2026.
Nothing in this article constitutes financial advice, and nothing in it is a recommendation to buy, sell or hold Palantir in any form. Palantir's annualized volatility was 60.5% over the year to November 9, 2026, and the stock moved 5% or more on 37 sessions in that year. At 10x leverage on the PLTRUSDT Perpetual, a single 10% move against a position equals its whole margin, and orders may be limited to reduce-only outside regular US hours. Past performance does not indicate future results. Do your own research and consider your risk tolerance before you trade on BloFin.