
A share price tells you very little about whether a stock is expensive. A $20 stock can cost far more than a $500 one, because what counts is the amount you pay for each dollar of sales, profit or cash. That ratio is called a valuation multiple.
Multiples are also hard to trust at a glance. Two websites can show different figures for the same stock on the same day. Each picks its own earnings number, share count and price date, and a data page usually shows only the answer.
You can clear that up by building the multiple yourself. Take one dated closing price, divide it by a figure from the company's own filing, and write down the basis. You can then see how much of a high reading comes from the price and how much from the figure underneath it.
Palantir Technologies (PLTR) shows why that matters, because its multiples are high and they fell sharply in the days after its November 2, 2026 report. On BloFin its price trades as the PLTRUSDT Perpetual, a USDT-settled perpetual contract, although the valuation question belongs to the shares and the numbers the company files.
Why is Palantir stock so expensive?
Palantir stock looks expensive because buyers pay about 51 times its past year's revenue and about 108 times its past year's earnings, at the $154.99 Nasdaq close on November 5, 2026. Third-quarter revenue grew 96% at a 62% adjusted operating margin (source: Nasdaq PLTR data, Palantir Q3 2026 release).
The sums use the $154.99 close and the $373.4 billion market value it gives across all three share classes. Revenue is the $7.3 billion of the past four quarters (source: Nasdaq PLTR data, Palantir Q3 2026 Form 10-Q, Palantir Q3 2026 release, Palantir Q4 2025 release). P/E stands for price-to-earnings and P/S for price-to-sales, and adjusted figures are Palantir's own versions, which leave out stock-based pay.
Multiple | November 5, 2026 | What it divides by |
|---|---|---|
Trailing P/E | 108.4 | $1.43 of earnings per share, past four quarters |
Forward P/E | 91.2 | $1.70, analysts' average for 2026 adjusted earnings per share |
P/S | 51.2 | $7.3 billion of revenue, past four quarters |
Enterprise value to sales | 49.8 | The same revenue, with cash taken off the market value |
Price to free cash flow | 89.9 | Adjusted free cash flow, past four quarters |
Price to free cash flow after stock pay | 117.8 | The same cash flow, less $982.1 million of stock-based pay |
For scale, FactSet's October 30 report put the S&P 500 at 25.9 times trailing earnings and 18.7 times forward earnings (source: FactSet Earnings Insight). Palantir's trailing P/E after its own fall was about four times that October reading.
Chief executive Alex Karp's statement in the release links the quarter to what he calls the Sovereign AI movement, and names products including its Artificial Intelligence Platform (AIP) (source: Palantir Q3 2026 release).
Palantir P/E ratio and why sites disagree
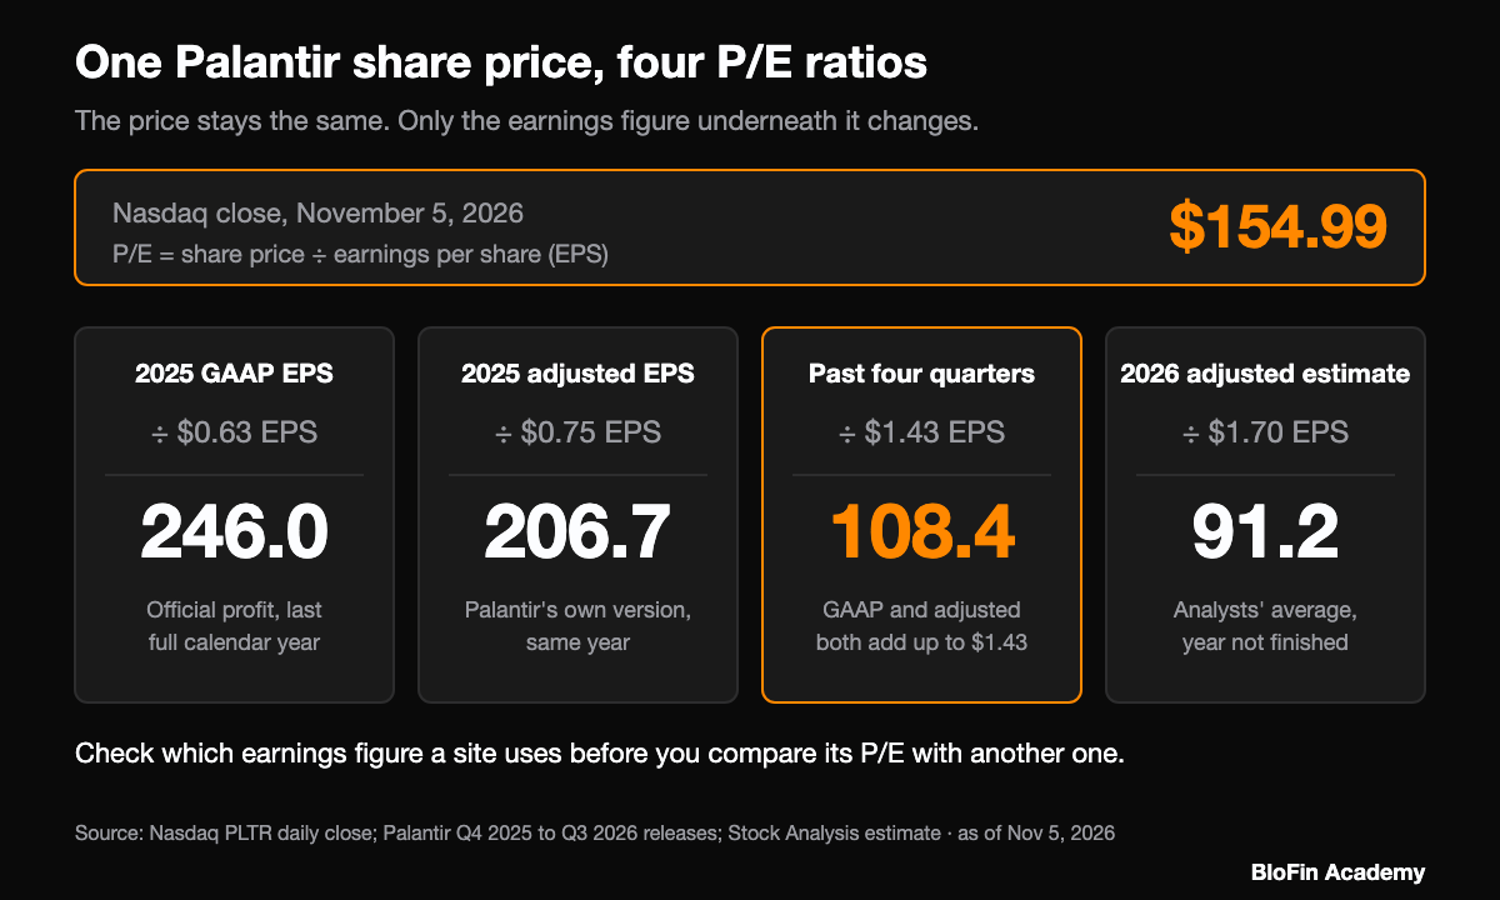
Palantir's price-to-earnings ratio was 108.4 at the November 5 close, using $1.43 of diluted earnings per share across the past four quarters (source: Nasdaq PLTR data, Palantir Q4 2025 release, Palantir Q3 2026 release). Sites disagree because they choose different earnings, different time windows and different price dates. Each choice changes the answer while the company stays exactly the same.
Earnings per share (EPS) is profit divided by the share count, and a P/E is the price divided by that figure. A reading of 108.4 means you pay $108.40 for each $1 of yearly profit. Hold the price still and change only the EPS, and the P/E moves a long way.
Data pages show the spread in practice. Public.com listed 120.34 at the November 4 close, and Stock Analysis listed 109.18 after the November 5 close, which sits close to 108.4 (source: Public.com PLTR P/E ratio, Stock Analysis PLTR statistics). Both are fair readings, and the price date explains most of the gap between them.
GAAP and adjusted earnings
GAAP means generally accepted accounting principles, the standard rules behind a company's official profit figure. Palantir's adjusted EPS adds back stock-based pay and the payroll taxes on it, and then charges tax at an estimated long-term rate of 23.0% (source: Palantir Q3 2026 release).
Those two steps nearly offset each other in the third quarter of 2026. Adjusted profit added back $342.0 million and took off $327.7 million for tax effects. The actual tax provision was just $13.6 million, so GAAP and adjusted EPS both came to $0.44 (source: Palantir Q3 2026 release).
The match holds over the past four quarters as well. GAAP EPS ran $0.24, $0.34, $0.41 and $0.44, adjusted EPS ran $0.25, $0.33, $0.41 and $0.44, and both add up to $1.43 (source: Palantir Q4 2025 release, Palantir Q1 2026 release, Palantir Q2 2026 release, Palantir Q3 2026 release). Go back to full-year 2025, though, and the two split apart. At the $154.99 close, $0.63 of GAAP EPS gives 246.0 and $0.75 of adjusted EPS gives 206.7 (source: Nasdaq PLTR data, Palantir Q4 2025 release).
The trailing window and the price date
A trailing P/E uses the past four reported quarters, so the window jumps forward on report night. A site still using the four quarters to June has $1.17 of GAAP EPS. That turns the same $154.99 into 132.5 (source: Palantir Q3 2025 release, Palantir Q4 2025 release, Palantir Q1 2026 release, Palantir Q2 2026 release).
The price date matters just as much on a stock that moves this far. The same $1.43 gives 120.1 at the November 4 close of $171.70 and 108.4 a day later (source: Nasdaq PLTR data). The share count adds one more small difference. Basic EPS ignores shares still to come from staff awards, and it totals $1.54 over the same four quarters, which gives 100.6 (source: Palantir Q4 2025 release, Palantir Q3 2026 release).
Forward P/E
A forward P/E swaps reported profit for analysts' estimates of profit not yet reported, so it always rests on someone's guess. Palantir's own outlook covers revenue, adjusted operating income and adjusted free cash flow, which leaves EPS estimates to analysts (source: Palantir Q3 2026 release).
After the November 5 close, Stock Analysis showed an average adjusted EPS estimate of $1.70 for 2026 and $2.48 for 2027, and those give 91.2 and 62.5 at the $154.99 close (source: Stock Analysis PLTR forecast). Palantir has already reported $1.18 of that 2026 figure across three quarters (source: Palantir Q1 2026 release, Palantir Q2 2026 release, Palantir Q3 2026 release). The same site's statistics page listed a forward P/E of 68.60, which falls between the two (source: Stock Analysis PLTR statistics). A forward figure looks cheaper because it assumes the growth has already happened. If estimates fall, the multiple rises at the same price.
Palantir market cap and price-to-sales ratio
Palantir's price-to-sales ratio divides its market value by its revenue, and it came to 51.2 at the November 5 close across all three share classes. Count only Class A, the class listed on Nasdaq, and it drops to 49.1. Counting dilution from staff awards lifts it to 54.7 (source: Nasdaq PLTR data, Palantir Q3 2026 Form 10-Q, Palantir Q3 2026 release).
Revenue over the past four quarters was $7.3 billion, the fourth quarter of 2025 plus the first nine months of 2026 (source: Palantir Q4 2025 release, Palantir Q3 2026 release). The share count comes from the 10-Q cover, dated October 26. The diluted figure is the weighted average Palantir used for third-quarter diluted EPS (source: Palantir Q3 2026 Form 10-Q, Palantir Q3 2026 release).
Share count used | Shares | Market value at $154.99 | P/S |
|---|---|---|---|
Class A only | 2,306,705,341 | $357.5 billion | 49.1 |
Class A, B and F | 2,409,497,474 | $373.4 billion | 51.2 |
Diluted weighted average | 2,573,926,000 | $398.9 billion | 54.7 |
The diluted count is higher because Palantir still has 146.8 million options outstanding, at an average exercise price of $10.16, along with 35.5 million restricted stock units (source: Palantir Q3 2026 Form 10-Q). A site that quotes market cap on Class A alone leaves out shares that exist. One on the all-class count leaves out shares that are likely to exist. Whichever you use, compare like with like over time.
Swapping trailing revenue for Palantir's 2026 guidance gives a forward version. The midpoint of about $8.5 billion puts the all-class value at 43.8 times sales, and that figure rests on the company's own outlook (source: Palantir Q3 2026 release).
Enterprise value and EV/sales
Enterprise value (EV) is a rough price for the whole business: market value plus debt, minus cash. Palantir's came to about $363.0 billion at the November 5 close, or 49.8 times revenue. That is just 1.4 points under its P/S, because the company has no drawn debt and its cash is small beside its market value (source: Nasdaq PLTR data, Palantir Q3 2026 Form 10-Q, Palantir Q3 2026 release).
The cash figure is $10.4 billion across cash, cash equivalents and US Treasury securities at September 30 (source: Palantir Q3 2026 release). Palantir also has a $500 million revolving credit facility, and nothing was drawn on it at that date (source: Palantir Q3 2026 Form 10-Q). An undrawn line stays out of the sum, since it only becomes debt once the company borrows.
EV/sales earns its keep when you compare companies with very different balance sheets. A business carrying heavy debt can look cheap on P/S and much less cheap on EV/sales, since a buyer of the whole company takes on that debt too. For Palantir the two tell almost the same story, and Stock Analysis showed a nearly identical 49.58 after the November 5 close (source: Stock Analysis PLTR statistics).
Price to free cash flow and stock-based pay
Price to free cash flow divides market value by the cash a business generates after its own adjustments. Palantir's was 89.9 at the November 5 close, on $4.2 billion of adjusted free cash flow over the past four quarters. It rises to 117.8 if you treat stock-based pay as a real cost (source: Nasdaq PLTR data, Palantir Q3 2026 Form 10-Q, Palantir Q3 2026 release, Palantir Q4 2025 release).
Palantir's 2026 guidance is $4.8 billion to $5.0 billion of adjusted free cash flow, so the $4.9 billion midpoint gives 76.2 (source: Palantir Q3 2026 release). The four-quarter figure adds $791.4 million, $924.6 million, $1.220 billion and $1.216 billion (source: Palantir Q4 2025 release, Palantir Q1 2026 release, Palantir Q2 2026 release, Palantir Q3 2026 release).
Stock-based compensation is the shares and options a company pays staff with. It came to $318.9 million in the third quarter, about 13.8% of revenue and 26.2% of that quarter's adjusted free cash flow. Over the past four quarters it came to $982.1 million (source: Palantir Q3 2026 release, Palantir Q4 2025 release).
Palantir leaves it out of its adjusted figures because it calls it a non-cash expense, and that is where the argument starts. Paying staff in shares keeps cash in the bank. Each new share also gives every holder a smaller slice, which is how stock pay dilutes existing shareholders. Take the $982.1 million off the cash flow and $4.2 billion becomes $3.2 billion, which gives the 117.8. Do the same to the guidance midpoint and 76.2 becomes 95.3 (source: Palantir Q3 2026 release, Palantir Q4 2025 release).
Palantir's Rule of 40 score
The Rule of 40 is the idea that a software company's growth rate and profit margin should add up to more than 40%. Palantir's version uses its adjusted operating margin. Third-quarter revenue growth of 96% plus a 62% margin gives a score of 158%, nearly four times that bar (source: Bain on the Rule of 40, Palantir Q3 2026 release).
Bain & Company's 2018 study found that software companies beating the rule had enterprise-value-to-revenue multiples double those of companies under the line (source: Bain on the Rule of 40). So a high score is one reason a software stock can carry a higher multiple, though it cannot tell you how much higher is reasonable.
The choice of margin matters here as well. Palantir's GAAP operating margin was 47%, so the same sum with stock pay counted gives 143%, which is still far past 40% (source: Palantir Q3 2026 release). The growth half of the score comes straight from the revenue line. You can find both inputs in the lines of a Palantir earnings report.
Palantir's PEG ratio
The PEG ratio divides a P/E by the earnings growth rate, so it asks how much you pay for each point of growth. Palantir's reading runs from about 0.75 to about 2.0, depending on which P/E and which growth rate you use (source: Palantir Q3 2026 release, Stock Analysis PLTR forecast). Any single quoted figure needs its inputs beside it.
PEG stands for price/earnings-to-growth, and a lower reading means you pay less for each point of growth. Three versions from the same close show how wide that range runs.
Third quarter of 2026: the trailing P/E of 108.4 divided by 144.4, the percentage rise in GAAP EPS from $0.18 to $0.44, gives about 0.75 (source: Palantir Q3 2026 release).
2026 estimate: 108.4 divided by analysts' 126.42% growth in adjusted EPS, measured from $0.75 in 2025, gives about 0.86 (source: Stock Analysis PLTR forecast).
2027 estimate: the forward P/E of 91.2 divided by analysts' 46.07% growth in adjusted EPS for 2027 gives about 1.98 (source: Stock Analysis PLTR forecast).
Stock Analysis printed 1.28 that day, between those readings (source: Stock Analysis PLTR statistics). Fast growth off a small base flatters this ratio, so the quarterly version looks cheapest, and the reading climbs once growth is measured against a much larger earnings figure.
What the multiple implies about future revenue
A reverse calculation starts from the November 5 market value and asks what the business would have to become. At $373.4 billion, reaching 20 times sales would take about $18.7 billion of revenue, roughly 2.2 times the midpoint of Palantir's 2026 guidance (source: Nasdaq PLTR data, Palantir Q3 2026 Form 10-Q, Palantir Q3 2026 release). That is arithmetic about the November 5 price, never a prediction.
Investors call the fuller version a reverse discounted cash flow, where you solve for the growth a price requires. A simpler version uses sales alone, so you can follow it with a calculator, and 20x and 10x are round yardsticks.
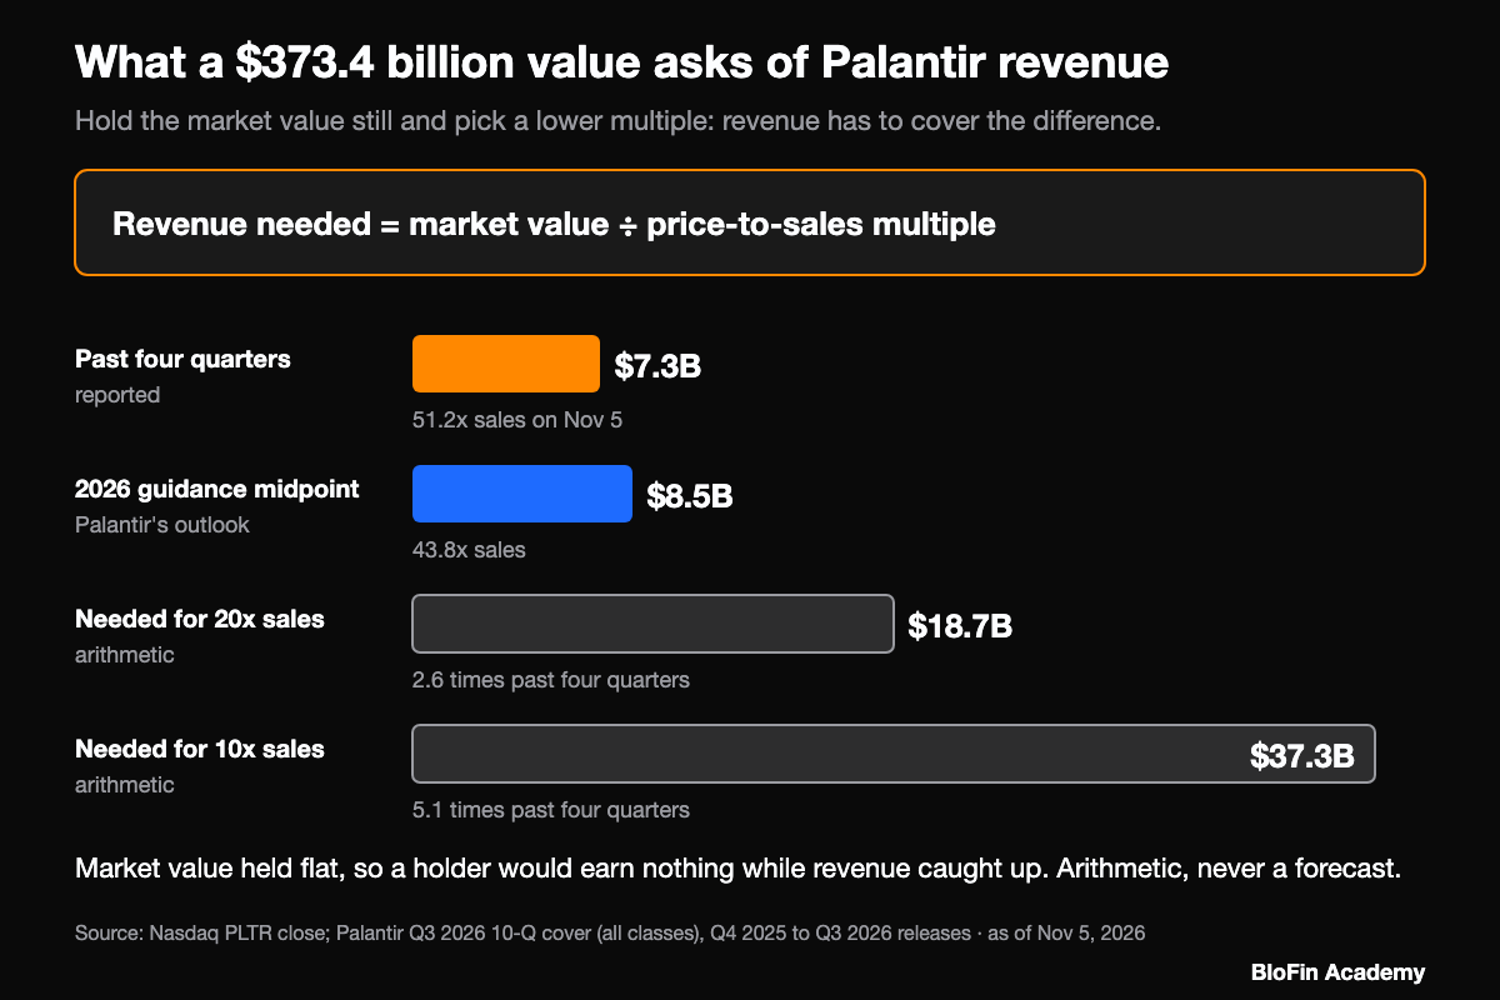
Time matters as well. Starting from the $8.5 billion guidance midpoint, $18.7 billion takes about 3.0 years at a steady 30% a year and about 1.9 years at 50%. Those growth rates are inputs to the sum, chosen for the example. Reaching 10 times sales takes $37.3 billion, about 5.1 times the past four quarters' revenue (source: Palantir Q3 2026 release, Palantir Q4 2025 release).
The sum holds market value flat, which means a holder would earn nothing while the business grew into that multiple. Earnings tell the same story. At $154.99, matching the 25.9 times trailing earnings in FactSet's October 30 S&P 500 reading would take about $5.98 of EPS, roughly 4.2 times the $1.43 of the past four quarters (source: Nasdaq PLTR data, Palantir Q4 2025 release, Palantir Q3 2026 release, FactSet Earnings Insight). You could read that as growth already paid for, or as a distance that depends on how long growth near 96% lasts.
Palantir's multiple after the November 2026 report
A multiple can fall in two ways: earnings rise or the price drops. Palantir's did both around its November 2 report. On that day's close its trailing P/E went from 152.4 on the old earnings to 124.7 on the new ones. It reached 108.4 as the shares fell 13.1% by November 5 (source: Nasdaq PLTR data, Palantir Q3 2026 release).
The report came after the close on November 2 (source: Stock Analysis PLTR statistics, Palantir Q3 2026 release), so the first step needed no change in price at all. The window moved forward and trailing EPS jumped from $1.17 to $1.43 (source: Palantir Q3 2025 release, Palantir Q4 2025 release, Palantir Q1 2026 release, Palantir Q2 2026 release, Palantir Q3 2026 release). The steps after that came from the price alone, because the trailing figures stayed the same on each of these days.
Nasdaq close | Price | Market value, all classes | P/S | Trailing P/E |
|---|---|---|---|---|
November 2, 2026 | $178.34 | $429.7 billion | 59.0 | 124.7 |
November 3, 2026 | $175.40 | $422.6 billion | 58.0 | 122.7 |
November 4, 2026 | $171.70 | $413.7 billion | 56.8 | 120.1 |
November 5, 2026 | $154.99 | $373.4 billion | 51.2 | 108.4 |
All four use revenue of $7.3 billion, EPS of $1.43 and the October 26 share count (source: Nasdaq PLTR data, Palantir Q3 2026 Form 10-Q, Palantir Q3 2026 release, Palantir Q4 2025 release). The November 5 drop of 9.7% took about $40.3 billion off the market value, with the stock 25.9% under its October 9 record close of $209.05.
The press offers more than one explanation for the week's falls, and no single cause is settled. Yahoo Finance said the sell-off in chip stocks spread to AI-linked software on November 5. It said the trigger was Democrats winning both chambers of Congress, after an election fight in which candidates from both parties attacked AI data centers (source: Yahoo Finance on software stocks). Two days earlier, when the shares lost 1.65% after the report, CNBC reported analysts pointing to signs of a slowdown in total contract value, the lifetime value of deals signed. Palantir's releases show that growth at 6% in the third quarter against 49% in the second (source: CNBC, Palantir Q3 2026 release, Palantir Q2 2026 release).
You can follow the contract on the PLTRUSDT Perpetual page, where its price sits beside its mark price.
Palantir's multiple in the 2021-22 fall
Palantir has traded at a similar multiple before. At its January 27, 2021 record close of $39.00 it stood near 65.0 times 2020 revenue, and at its $6.00 close on December 27, 2022 it stood near 6.6 times 2022 revenue. Sales grew 74.4% between those two years while the shares fell 84.6% (source: Nasdaq PLTR data, Palantir 2020 Form 10-K, Palantir 2022 Form 10-K).
Those figures use each year's revenue and the cover-page share count of the annual report that followed it (source: Palantir 2020 Form 10-K, Palantir 2022 Form 10-K, Nasdaq PLTR data). So the multiple shrank by about 90%, which shows how much of a stock's price can rest on the multiple rather than on the business.
The shares closed back above $39.00 on October 3, 2024, about 21 months after that low (source: Nasdaq PLTR data). The comparison has a real limit. Palantir reported a net loss of $1.2 billion in 2020 and $371.1 million in 2022. Its GAAP operating margin reached 47% in the third quarter of 2026 (source: Palantir 2022 Form 10-K, Palantir Q3 2026 release). A buyer at $154.99 is paying for a very different income statement.
Is Palantir overvalued or in a bubble?
Whether Palantir is overvalued depends on the growth you expect, and arithmetic alone cannot settle that. Sherwood News compared its multiples with dot-com peaks in July 2025, while the bulls it described pointed to a fast-growing, high-margin business. The third quarter of 2026 then brought 96% revenue growth and a 47% GAAP operating margin (source: Sherwood News on Palantir's valuation, Palantir Q3 2026 release).
Sherwood's chart put Palantir near 78 times the revenue analysts expected over the next 12 months in July 2025. Its text put Yahoo at more than 78 times sales and NetApp at 74 times on March 10, 2000, the day the Nasdaq peaked. It put Cisco's own peak at 24 times sales and 131 times earnings, against 2 times and 26 times for the S&P 500. It said Cisco then lost almost 90% of its value in two years (source: Sherwood News on Palantir's valuation). Sherwood does not say which sales or earnings figures sit behind those older readings, so treat the comparison as rough. Palantir's 51.2 on November 5 uses past revenue and its 43.8 uses 2026 guidance. Both are above that Cisco peak and below the Yahoo and NetApp readings. Its 108.4 on past earnings is below the Cisco peak (source: Nasdaq PLTR data, Palantir Q3 2026 Form 10-Q, Palantir Q4 2025 release, Palantir Q3 2026 release).
The same Sherwood piece gives the other side as well. It notes that Google, Microsoft, Amazon and Tesla were all once called wildly overvalued and went on to create trillions of dollars in market wealth. It adds that even at their peaks none of them had valuations like Palantir's, then near 78 times expected sales (source: Sherwood News on Palantir's valuation). Fast growth also shrinks a multiple from the revenue side, since a flat market value over more sales gives a lower reading.
Whether AI stocks as a group have run too far is a wider argument, with both sides set out in the AI bubble debate. For Palantir alone, the useful step is to take the multiple you find believable and work back to the revenue it needs. Then ask whether that revenue looks reachable to you.
What Palantir's valuation means for PLTRUSDT traders
The PLTRUSDT Perpetual has no earnings or sales of its own, so every multiple belongs to Palantir the company. The contract tracks the price and conveys no ownership (source: BloFin stock futures notice), which means a multiple reset in the shares can still reach your position through the price, with leverage magnifying the effect.
BloFin's own series shows how that looks. On November 5, in UTC days, the contract opened at 171.5 USDT and closed at 153.3 USDT, a fall of 10.6%. The hour from 2PM UTC alone went from 166.72 USDT to 157.78 USDT (source: BloFin PLTRUSDT market data). The hour holds the 2.30PM UTC Nasdaq open. At 10x, a 10.6% fall comes to 106% of your margin, so an isolated-margin long held from that UTC day's open at 171.5 USDT would be reduced or liquidated before the fall was over.
A position held on the contract also pays or receives a funding rate, normally at 12AM, 8AM and 4PM UTC (source: BloFin PLTRUSDT market data). Orders on BloFin stock futures can be limited to reduce-only outside regular US hours (source: BloFin stock futures notice). If a high multiple has you thinking about the short side, read how a Palantir short works first.
Looking to trade Palantir? To get started, you'll need to first create a BloFin account, fund your account with cryptocurrency, and go to the PLTRUSDT Perpetual trading page.
Frequently asked questions
What has Palantir's P/E ratio been in the past?
On full-year GAAP EPS, Palantir's year-end P/E was 398.1 in 2024, from a $75.63 close and $0.19 of EPS, and 282.1 in 2025, from a $177.75 close and $0.63 (source: Nasdaq PLTR data, Palantir Q4 2025 release). Data sites differ again here: Public.com shows 415.69 for the end of 2025 (source: Public.com PLTR P/E ratio). From 2020 through 2022 Palantir reported net losses, so a P/E has no meaning for those years (source: Palantir 2022 Form 10-K).
Is Palantir more expensive than Nvidia and Microsoft?
On Stock Analysis's figures after the November 5 close, Palantir's trailing P/E was 109.18, against 22.96 for Nvidia and 27.98 for Microsoft. Its P/S was 51.00, against 15.47 and 11.49, and its forward P/E was 68.60, against 15.01 and 25.82 (source: Stock Analysis PLTR statistics, Stock Analysis NVDA statistics, Stock Analysis MSFT statistics). All three come from one provider's method, which is why they compare fairly, though each company's fiscal year ends at a different time.
How much revenue would Palantir need to be worth $1 trillion?
At the 51.2 times sales of November 5, a $1 trillion value would take about $19.5 billion of revenue. At 20 times sales it would take $50 billion, about 6.9 times the $7.3 billion of the past four quarters and 5.9 times the midpoint of 2026 guidance (source: Nasdaq PLTR data, Palantir Q3 2026 Form 10-Q, Palantir Q4 2025 release, Palantir Q3 2026 release). Those sums show what each multiple asks of the business. Neither is an estimate of what Palantir will be worth or when.
Has Palantir's Rule of 40 score been rising?
Palantir's score has climbed in each of the last four reports, from 114% in the third quarter of 2025 to 127%, 145%, 155% and then 158% in the third quarter of 2026 (source: Palantir Q3 2025 release, Palantir Q4 2025 release, Palantir Q1 2026 release, Palantir Q2 2026 release, Palantir Q3 2026 release). Each of those scores uses the adjusted operating margin, so stock-based pay is left out every time.
How much of Palantir's market value is cash?
About 2.8%. Palantir held $10.4 billion at September 30, counting cash, cash equivalents and US Treasury securities, against a $373.4 billion all-class market value at the November 5 close (source: Nasdaq PLTR data, Palantir Q3 2026 Form 10-Q, Palantir Q3 2026 release). That money earned $88.9 million of interest income in the third quarter, beside $1.1 billion of operating income. So cash does little to change what you are paying for, since almost all of the value rests on the business itself.
Researched and written by the BloFin Academy editorial team with AI-assisted drafting. All facts independently verified. Primary sources include Palantir's third-quarter 2026 Form 10-Q, its 2020 and 2022 Forms 10-K and its earnings releases on SEC EDGAR. Price data comes from Nasdaq's daily history for Palantir, with data from Stock Analysis, Public.com and FactSet, research from Bain & Company, and reporting from Yahoo Finance, CNBC and Sherwood News. BloFin facts come from its stock futures notice and its own PLTRUSDT Perpetual data, current as of November 10, 2026.
Nothing in this article constitutes financial advice, and nothing in it is a recommendation to buy, sell or hold Palantir in any form. Palantir's multiples can fall quickly even when its results are strong, and the shares lost 84.6% from a record close to a low in less than two years. A leveraged PLTRUSDT Perpetual position can be reduced or liquidated in a far smaller fall, whichever direction you trade. Past performance does not indicate future results. Do your own research and consider your risk tolerance before you trade on BloFin.