
Gold and silver have served side by side as money for thousands of years, and people priced one against the other long before anyone quoted either in dollars. Traders still make that comparison. When the two metals drift apart, the first question many of them ask is how far silver has fallen behind gold or pulled ahead of it.
That question comes down to one number, the gold/silver ratio, and the number is easy to misread. Many chart pages show whether a reading is high or low against their own history and leave the meaning to you, while some commentary treats a high reading as proof that silver must soon catch up. High and low readings do mean something, but the meaning depends on the years you compare against and on which metal does the moving.
The measure itself is a relative price, much like a currency pair. It tells you which of two assets is expensive against the other, and it says nothing about whether either one is cheap in dollars. Like any relative price, it only works when both sides come from the same kind of market at the same moment.
BloFin lists a perpetual futures contract on each metal, the XAGUSDT Perpetual for silver and the XAUUSDT Perpetual for gold, so you can work out the number yourself from two live prices. Knowing what that number has meant in the past tells you how much weight it can carry.
What is the gold silver ratio?
The gold/silver ratio compares the two metals with a single number: the price of an ounce of gold divided by the price of an ounce of silver. A reading of 80 means one ounce of gold is worth 80 ounces of silver, which traders also write as 80:1. A high ratio means silver is cheap against gold.
A low ratio means the opposite, with silver expensive against gold. You will also see it called the gold silver ratio, the gold to silver ratio or gold:silver, and all of these are the same calculation. Because both metals are quoted per troy ounce and in the same currency, the ounces and the currency cancel out and you are left with a plain number.
That plain number hides the price level, which is the first thing to keep in mind. Gold at $4,000 with silver at $50 gives a ratio of 80, and so does gold at $1,600 with silver at $20. Both readings describe the same relationship between the metals, even though the prices are two and a half times apart. On its own, then, the ratio can never tell you whether silver is cheap in dollars.
The comparison is very old. The Silver Institute, an industry group that publishes the World Silver Survey, notes that the ratio has been dubbed the "world's oldest exchange rate" and traces references to it back nearly 5,000 years to ancient Egypt (source: Silver Institute, gold/silver ratio report, July 2026). For most of that time, both metals served as money, so the ratio worked as an exchange rate in the plain sense of the words.
How to calculate the gold/silver ratio
To calculate the ratio, divide a gold price by a silver price taken from the same kind of market at the same moment. On November 4, 2026, the mark price of BloFin's XAUUSDT Perpetual was 4,036.92 USDT and the XAGUSDT Perpetual's was 51.96 USDT, which gives a mark ratio of about 77.7.
Gold/silver ratio = gold price ÷ silver price, so 4,036.92 ÷ 51.96 = 77.69
Both marks are in USDT, so the stablecoin drops out of the division. Each contract publishes a mark price, which BloFin also uses to trigger liquidation, so it is a steady price to divide. The result, 77.7, is a perpetual mark ratio, which is a close relative of the spot ratio and still a different number. The two contracts' index prices, read within the same minute, gave 77.69, and their last trades gave 77.62.
The same-moment rule matters more than it looks, because silver moves quickly. The XAGUSDT Perpetual's low over the 24 hours before that November 4 reading was 48.73 USDT. Pair the same gold mark with that older silver price and you get 82.8, an error of about five points from one mismatched quote.
The source matters too, because the silver price is set across spot, futures and benchmark markets at once, and gold works the same way. The Silver Institute puts the all-time high of the ratio at 125.7 on March 18, 2020, while the London morning gold fix and the silver fix produced a high of 123.3 a day later (source: Silver Institute, gold/silver ratio report, July 2026). A monthly average smooths the same episode further: on World Bank data, the April 2020 reading is about 111 (source: World Bank Pink Sheet, monthly data). When you compare two readings, check that they use the same series.
How to read a rising or falling ratio
A rising ratio means gold is beating silver, and a falling one means silver is ahead of gold. Its direction tells you nothing about the direction of either price, because it falls when silver rises faster and also when gold drops harder. You always need the two price charts beside it.
Say gold starts at $4,000 and silver at $50, a ratio of 80. Four moves show how little the ratio says about price direction.
What happens to the two prices | New gold price | New silver price | New ratio |
|---|---|---|---|
Both rise 10% | $4,400 | $55 | 80.0 |
Gold rises 10%, silver rises 25% | $4,400 | $62.50 | 70.4 |
Gold falls 10%, silver falls 25% | $3,600 | $37.50 | 96.0 |
Gold falls 25%, silver falls 10% | $3,000 | $45 | 66.7 |
The ratio falls when gold rises 10% and silver rises 25%, and it also falls when gold drops 25% and silver drops 10%. The first is a rally, and the second is a slide in which you would have lost money holding either metal. So a falling ratio only becomes good news for a silver holder once the silver chart agrees.
Because silver usually swings harder than gold, the ratio often rises in sell-offs and falls in rallies. On World Bank monthly averages from January 1971 to October 2026, the ratio rose in 179 of the 217 months when both metals fell. It fell in 167 of the 238 months when both rose (source: World Bank Pink Sheet, monthly data).
Early on November 4, as US midterm results came in, spot gold was testing $4,000 (source: Kitco, November 4, 2026). Over the 24 hours to 8.18AM UTC that day, the XAUUSDT Perpetual rose 3.04% and the XAGUSDT Perpetual rose 5.81%. On the two contracts' last prices, that larger rise in silver took the ratio from about 79.7 to about 77.6, close to the 77.7 mark reading.
The gold-leads-silver pattern
Gold can move first and silver can follow, but this is a weak tendency and not a rule. The Silver Institute describes silver as reacting first like a commodity and only later like a financial asset, partly in response to earlier moves in gold. In 2020, gold passed its February 24 high in early April, while silver took until mid-July (source: Silver Institute, gold/silver ratio report, July 2026).
The monthly record shows how weak the pattern is. On World Bank averages from January 1971 to October 2026, gold rose and beat silver over six months in 225 cases. Silver then rose and beat gold over the next six months in 90 of them, about 40%, against about 32% of all other months (source: World Bank Pink Sheet, monthly data). The windows overlap, so the real sample is smaller.
The 2025 rally fits the pattern in part. From December 2024 to April 2025, gold's monthly average rose about 22% against about 5% for silver. From April to November 2025, silver rose about 57% against about 27% for gold (source: World Bank Pink Sheet, monthly data). From the end of November to the end of December 2025, silver gained 33.5% while gold gained just 3.6%, and both metals then peaked on January 29, 2026, on their London fixes (source: Silver Institute, gold/silver ratio report, July 2026).
What counts as a high or low ratio?
No fixed line separates high from low, so a reading only means something against a chosen history. On World Bank monthly averages since January 1971, the median is about 63, readings of 80 or more came in 16% of months, and readings under 40 came in 18.4% (source: World Bank Pink Sheet, monthly data). Those two lines make a workable definition.
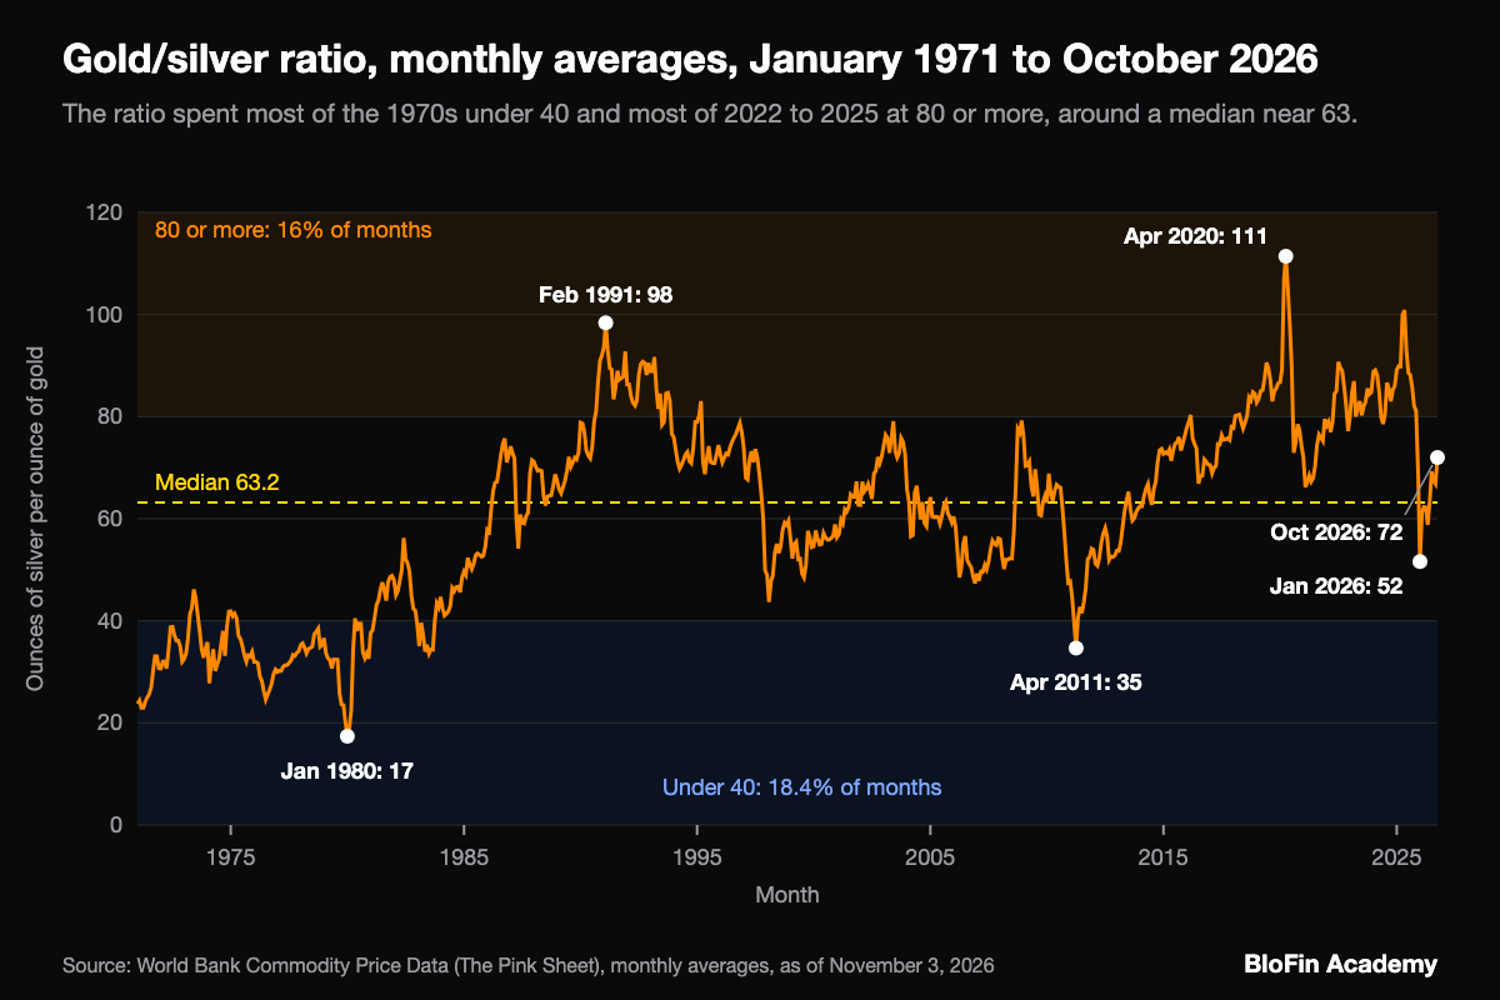
The 670 months to October 2026 split into 123 months under 40, 175 between 40 and 60, 265 between 60 and 80, and 107 at 80 or more. Only 20 of those 107 reached 90 (source: World Bank Pink Sheet, monthly data). The Silver Institute's own median is 62.9 for January 1971 to May 2026 (source: Silver Institute, gold/silver ratio report, July 2026), and the World Bank series gives 62.7 for that same window (source: World Bank Pink Sheet, monthly data). The two figures sit about 0.2 apart, so the middle of the range barely depends on whose file you read.
The bands shift with the years you choose. All but two of the 123 months under 40 came before 1984, in the years after gold left its fixed official price. No month averaged 80 or more from April 1995 to February 2016. A reading of 80 or more then became normal: between May 2022 and November 2025, the monthly ratio sat at 80 or more in 40 of 43 months (source: World Bank Pink Sheet, monthly data). The Silver Institute says the ratio sat between roughly 60 and 70 much of the time from 2002 to 2017, and around 80 to 90 from 2018 to 2025 (source: Silver Institute, gold/silver ratio report, July 2026).
So the November 4 mark ratio of about 77.7 sits above the long-run middle and just under the high band. About one month in five since 1971 has averaged at that level or higher, although a monthly average of market prices and a single reading of perpetual marks are only loosely comparable (source: World Bank Pink Sheet, monthly data).
The ratio's history from legal rates to record highs
For more than a century the ratio was held near 15:1 by law, with legal rates set in Britain in 1717, France in 1726 and 1785, and the United States in 1792. Both metals' prices have floated freely only since 1971. In that modern era, the daily reading has ranged from 16.7 in 1980 to 125.7 in 2020 (source: Silver Institute, gold/silver ratio report, July 2026).
Those legal rates belonged to the era of bimetallism, when governments defined money in both metals. Once the big economies moved to the gold standard, the ratio climbed, reaching 35:1 by the end of the 19th century. It fell back to 15:1 by the end of World War I, then soared from 38:1 in 1929 to 100:1 in 1940 and 1941, after the Depression hit silver's industrial demand (source: Silver Institute, gold/silver ratio report, July 2026).
The modern record begins with the dollar's 1971 break from gold, when gold's price stopped being fixed by law. Silver's London peak of $49.45 on January 18, 1980, during the Hunt brothers' attempt to corner the market, set against a morning gold fix of $825.50, gave the low of 16.7. Silver's slide below $4 then pushed the monthly average to 97.3 in February 1991, the highest in nearly 50 years (source: Silver Institute, gold/silver ratio report, July 2026).
The swings continued in both directions. Silver's spike in the spring of 2011 took the ratio to 31.7 on April 28. The pandemic shock then lifted it to 125.7 on March 18, 2020, after silver fell 37% in about three weeks while gold fell 11%. A speculative run in silver then cut it to 45.6 on January 27, 2026, two days before both metals peaked (source: Silver Institute, gold/silver ratio report, July 2026).
Each of those low readings came during a surge of buying that shows up in silver's price history, and the 2020 peak came during a rush out of the metal.
What followed high and low ratio readings
High readings have more often been followed by silver gaining on gold, and low readings by gold gaining on silver. On World Bank monthly data since 1971, the ratio was lower a year later after 90% of months at 90 or more. That share drops to about 59% for all months at 80 or more (source: World Bank Pink Sheet, monthly data).
To test this, take every month since January 1971 that has a full year of data after it, group the months by their starting ratio, and look 12 months ahead (source: World Bank Pink Sheet, monthly data). The World Bank file gives silver to the nearest 10 cents, so a month close to a line could fall on either side of it, and the counts at 90 or more are the most affected.
Starting monthly ratio | Months tested | Ratio lower a year later | Median silver change | Median gold change |
|---|---|---|---|---|
Under 40 | 123 | 27.6% | +9.8% | +30.0% |
40 to under 60 | 173 | 26.0% | -7.9% | +0.6% |
60 to under 80 | 256 | 44.1% | 0.0% | +1.9% |
80 or more | 106 | 58.5% | +20.8% | +13.6% |
90 or more (part of the 80 or more group) | 20 | 90.0% | +26.8% | +6.9% |
All months | 658 | 38.6% | +2.1% | +5.9% |
Read that as a record of the past, with three cautions. The months overlap, so 658 months do not make 658 separate tests. The 20 months at 90 or more come from just four stretches: the early 1990s, 2019 and 2020, 2022 and 2025. And gold's strong figure for low readings mostly reflects the 1970s, when its price had just been freed (source: World Bank Pink Sheet, monthly data).
Individual episodes show the range of outcomes better than medians do, here comparing one month with the same month a year later (source: World Bank Pink Sheet, monthly data).
Starting month | Ratio then | Ratio a year later | Silver over the year | Gold over the year |
|---|---|---|---|---|
January 1980 | 17 | 38 | -62% | -17% |
February 1991 | 98 | 86 | +11% | -3% |
April 2011 | 35 | 52 | -26% | +11% |
April 2019 | 85 | 111 | 0% | +31% |
March 2020 | 107 | 67 | +72% | +8% |
April 2025 | 100 | 62 | +136% | +47% |
The low readings of 1980 and 2011 ended badly for anyone who held silver at the time. The high readings of 2020 and 2025 were followed by large gains in silver, and yet the high reading of February 1991 brought only a small rise and no quick fall in the ratio. The monthly ratio stayed at 80 or more from September 1990 until June 1993. April 2019 went the other way, with the ratio higher a year later and silver flat. In all, 44 of the 106 months at 80 or more had a higher ratio a year later (source: World Bank Pink Sheet, monthly data).
Does the gold/silver ratio revert to its mean?
Mean reversion is the idea that a measure tends to return to its long-run average, and the Silver Institute's July 2026 report supports it for this ratio. Its test on monthly data from January 1970 to May 2026 found a long-run equilibrium of 59.65, with gaps closing by half in about 17 months (source: Silver Institute, gold/silver ratio report, July 2026).
The Silver Institute is an industry body, so its result deserves a second look, and the report's own limits are the useful part. It calls a gap of more than 20% from equilibrium a "fundamental disequilibrium", which on its figure means a ratio above 71.6 or below 47.7 (source: Silver Institute, gold/silver ratio report, July 2026). At 30.2% above 59.65, the November 4 reading is past that line. The label is common, though: the monthly ratio has sat outside that band in about 59% of months since 1971 (source: World Bank Pink Sheet, monthly data). Mean reversion trading rests on the same idea, and it faces the same three limits on this ratio.
The first limit is time. A half-life of about 17 months is one model's estimate, and the ratio can stay stretched far longer. The monthly reading stayed under 40 for 60 straight months from May 1975 to April 1980 (source: World Bank Pink Sheet, monthly data). The report adds that the model spent more of the 1970s out of equilibrium than in it (source: Silver Institute, gold/silver ratio report, July 2026).
The second limit is that the middle itself may move. The report raises the possibility of a regime shift since 2022, driven by central banks' largely price-insensitive gold buying, and says this could mean long stretches with gold looking expensive against silver (source: Silver Institute, gold/silver ratio report, July 2026). It calls this a theory, though one it rates as strongly probable, and if it is right, the old average would make silver look cheaper than it really is.
The third limit is which metal does the work. The popular reading says a high ratio means silver will rise. The report finds that gold does far more than silver to pull the pair back to equilibrium (source: Silver Institute, gold/silver ratio report, July 2026). That describes the report's long-run model. Over the 12 months after high readings in the table above, silver's rise did more of the work. From the November 4 marks, returning to the long-run median of 62.9 would take silver about 23.5% higher with gold unchanged, or gold about 19% lower with silver unchanged, or any mix in between. That arithmetic shows the distance and carries no view on whether or when the ratio gets there.
Turning a reading into a position means holding one leg in each metal and matching their sizes, the setup behind a gold/silver ratio trading strategy. You can follow silver's side of the ratio live on the XAGUSDT Perpetual page.
The natural ratio and why silver is cheaper than gold
Silver is more plentiful than gold, which helps explain its lower price, but abundance explains only part of the gap. The US Geological Survey's 2004 profile puts silver at about 19 times gold in the crust (source: USGS, silver commodity profile). Crustal estimates vary, though, and the Royal Society of Chemistry's figures give about 42 times (source: Royal Society of Chemistry, silver) (source: Royal Society of Chemistry, gold). On USGS estimates, silver's 2025 mine output is about 7.9 times gold's (source: USGS Mineral Commodity Summaries 2026, silver) (source: USGS Mineral Commodity Summaries 2026, gold). That market ratio is far wider than any of these.
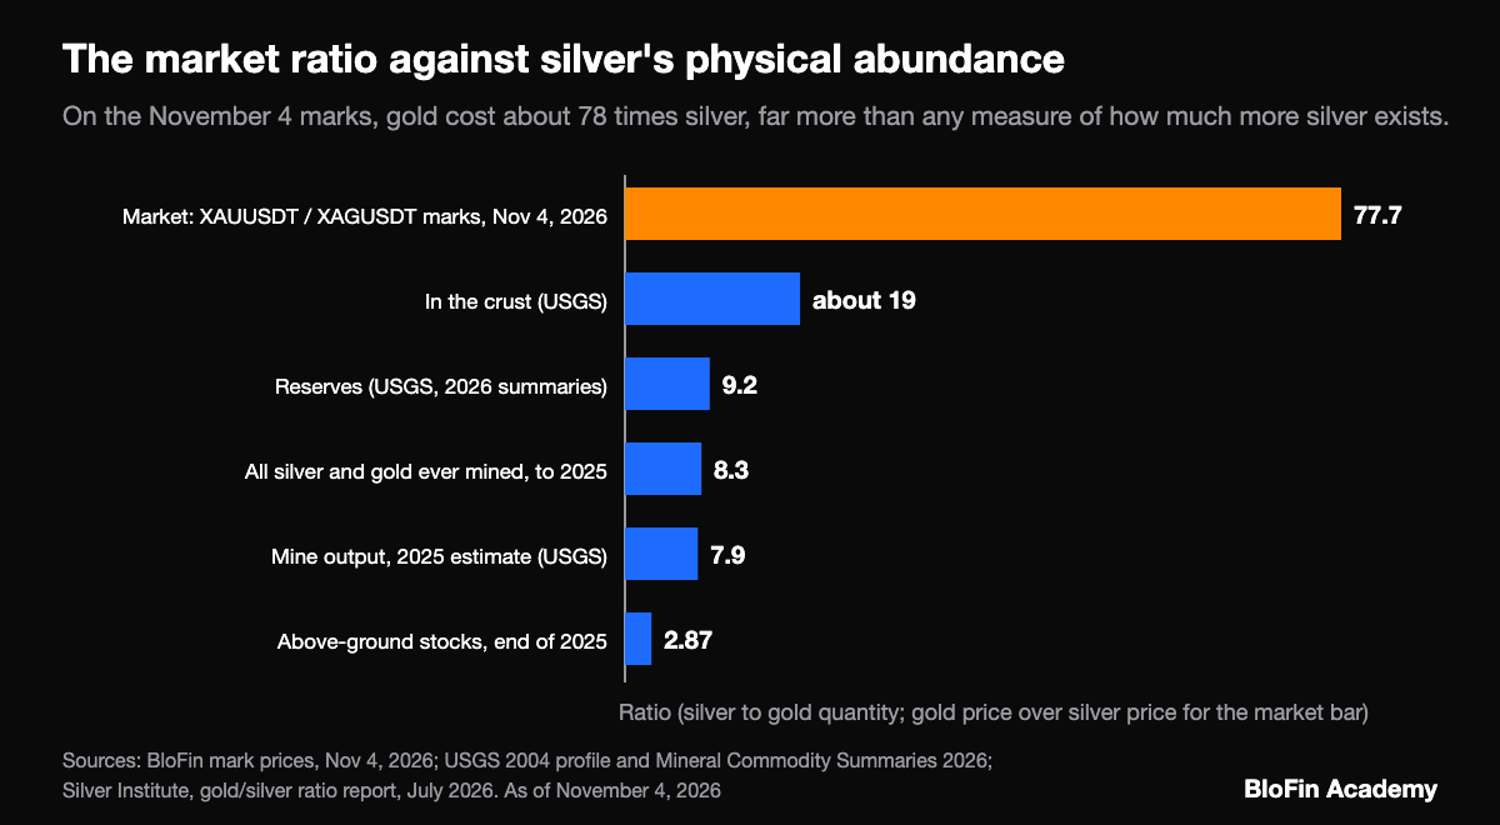
USGS gives silver's crustal abundance as 0.075 parts per million (source: USGS, silver commodity profile). Its 2026 summaries estimate 2025 world mine output at 26,000 metric tons of silver and reserves at 610,000 tons (source: USGS Mineral Commodity Summaries 2026, silver). The matching figures for gold are 3,300 tons and 66,000 tons, which makes silver about 7.9 times gold's output and about 9.2 times its reserves (source: USGS Mineral Commodity Summaries 2026, gold). All the metal ever mined through 2025 comes to 58.6 billion ounces of silver and 7.1 billion of gold, about 8.3 times (source: Silver Institute, gold/silver ratio report, July 2026).
Those figures feed a familiar argument that the price ratio should fall to match them. A 2017 post by the dealer Provident Metals set prices against a 9:1 mining ratio (source: Provident Metals, May 10, 2017), and a 2021 article by Ainslie Bullion mentions commentators who put the geological ratio nearer 15:1 (source: Ainslie Bullion, September 27, 2021).
The record since 1971 does not support either number as a fair value. The daily low of 16.7 never reached 15, let alone 9 (source: Silver Institute, gold/silver ratio report, July 2026), and the monthly low was about 17 (source: World Bank Pink Sheet, monthly data). The Silver Institute calls reserves and historical mine output irrelevant in the modern economy, whatever they meant in antiquity. It also gives a third measure, further from the market ratio: because far more silver is used up and lost, above-ground stocks at the end of 2025 were only 2.87 times gold's (source: Silver Institute, gold/silver ratio report, July 2026).
The old 15:1 followed a flood of silver from the Americas and was then written into law. It was never a measure of how much metal lies in the ground. Output also follows other markets, since USGS says silver comes mainly as a by-product of lead-zinc, copper and gold mines (source: USGS Mineral Commodity Summaries 2026, silver), which ties silver supply partly to demand for those metals.
What moves the gold/silver ratio
Investment demand for each metal moves the ratio most, according to the Silver Institute. The ratio tends to rise when investors buy more gold and to fall when they buy more silver. Central banks add a second force on one side only, since their buying is almost entirely in gold (source: Silver Institute, gold/silver ratio report, July 2026).
The balance between the two metals has changed over time. From 1980 to 2000, silver investment explained nearly all the movement, as investors swung from accumulating silver to heavy selling. Since 2001, gold investment has been the far stronger influence. Silver's own moves can still hit hard, though, because its market is smaller and less liquid than gold's, so money coming in or going out shifts the price further (source: Silver Institute, gold/silver ratio report, July 2026).
Three episodes show those forces at work. News that Warren Buffett's Berkshire Hathaway had bought 129.7 million ounces of silver (source: Berkshire Hathaway, February 3, 1998) took the ratio below 40 at its low in February 1998. That month's average stayed near 44 (source: World Bank Pink Sheet, monthly data). After Russia's attack on Ukraine, a jump in central-bank gold buying, along with weak silver investment, carried the ratio from about 80 in May 2022 to above 100 three years later. Then a speculative rush into silver drove it the other way in January 2026 (source: Silver Institute, gold/silver ratio report, July 2026). All three were shifts in relative demand. Silver's dollar price answers to a wider set of drivers, such as the concerns about industrial demand and restrictive financing conditions that Kitco named on October 30, 2026 (source: Kitco PM report, October 30, 2026).
How to track the ratio on BloFin
You can track the ratio on BloFin by reading the mark price on the XAUUSDT Perpetual and the XAGUSDT Perpetual at the same moment and dividing the first by the second. With no silver spot pair on BloFin, its silver market is the perpetual, and BloFin's own figures for the two contracts start in January 2026.
The XAGUSDT contract was listed on January 8, 2026 and the XAUUSDT contract on January 12, so any comparison with the 1971 record has to rely on other series, such as the World Bank's. Both settle in USDT with a tick size of 0.01. Contract size plays no part in the calculation, even though the gold contract's specs differ from silver's, because each mark is the price of one unit of its metal.
Write down the time when you take a reading, and keep using the same kind of price from then on. A habit of always dividing mark by mark gives you a series you can compare with itself, day after day, and it keeps you from confusing a change in your source with a change in the market.
Looking to trade silver or gold? To get started, you'll need to first create a BloFin account, fund your account with cryptocurrency, and navigate to the XAGUSDT Perpetual or XAUUSDT Perpetual trading page.
Frequently asked questions
What was the lowest gold/silver ratio in history?
The lowest figures come from the ancient world. A ratio of around 2.5:1 prevailed for centuries in Egypt, where gold was relatively plentiful and silver scarce, and China's ratio was close to 3:1 under the Han Dynasty. Rome set a formal 10:1 in 333 BCE. Before gold's price was freed, the reading dropped to 16.3 on March 14, 1968, the day before the London Gold Pool collapsed (source: Silver Institute, gold/silver ratio report, July 2026).
How fast can the gold/silver ratio change?
It can move by double digits within weeks. The ratio ended May 2026 at about 60 and ended June at about 70, a shift the Silver Institute uses to show how hard short-term forecasting is. In 2020 it went from a little under 90 to 125.7 in three weeks (source: Silver Institute, gold/silver ratio report, July 2026). The monthly average itself rose about 18 points in March 2020 and fell about 18 in January 2026 (source: World Bank Pink Sheet, monthly data).
Does the US dollar or interest rates move the gold/silver ratio?
Neither has explained much of the ratio's moves. Gold and silver each tend to fall when the dollar rises, but they move together, so the ratio stays largely independent of the dollar most of the time. Even from January 2006 to May 2026, changes in the dollar index explained only 12% of the ratio's monthly variance. The Silver Institute's tests found only a very weak link to interest rates and no significant link to OECD inflation (source: Silver Institute, gold/silver ratio report, July 2026).
Does silver's industrial demand affect the gold/silver ratio?
It does, but less than its size suggests. Industrial uses grew from 41% of silver fabrication demand, excluding coins, in 1990 to at least 63% in 2025. The report calls the rise modest once the formerly massive photographic use is counted as industrial. Tested from September 2013 to May 2026, a stronger JP Morgan Global Manufacturing PMI went with a lower ratio, but the survey explained only a small part of the moves (source: Silver Institute, gold/silver ratio report, July 2026). The report suggests the effect may come partly through how investors see silver.
What is the silver to oil ratio?
The silver to oil ratio shows how many barrels of crude oil an ounce of silver buys, found by dividing silver's price by oil's. In October 2026, silver averaged $57.0 an ounce and the average of Brent, Dubai and West Texas crude was $108.5 a barrel, so an ounce bought about 0.53 barrels, against a median of about 0.30 since 1971 (source: World Bank Pink Sheet, monthly data). Because oil sits on the other side of the division, a jump in crude lowers the reading even if silver stands still.
Researched and written by the BloFin Academy editorial team with AI-assisted drafting. All facts independently verified. Primary sources include the Silver Institute, the World Bank and the US Geological Survey, current as of November 4, 2026.
Nothing in this article constitutes financial advice, and nothing in it is a recommendation to buy, sell or hold silver or gold in any form. A high or low gold/silver ratio gives no timing and no guarantee: the reading can stay stretched for years, it can widen further after you act on it, and it can close through a fall in gold with no gain in silver. On a perpetual, funding is settled every four hours, each position ties up margin, and high leverage can wipe out that margin on a move of a few percent, which silver has made in a single day. Past performance does not indicate future results. Do your own research and consider your risk tolerance before you trade on BloFin.