
Silver and gold are precious metals, yet silver's price swings about twice as hard. A smaller market, a price that answers to factories as well as investors, and leveraged buying help explain the gap. A market that moves several percent in a day changes how much you hold, where your stop sits and how often you check the screen.
Silver is called volatile so often that the word has almost stopped meaning anything. It can describe how far the price moved last year, or how far options traders expect it to move next month. It can also mean the memory of one day when the floor gave way, and those three things are measured in different ways.
Two measures cover most of it. Realized volatility looks back at what the price actually did, and implied volatility reads what traders expect from the prices they pay for options. Both can be set beside gold, the stock market and bitcoin, as long as each figure is worked out the same way over a stated window.
You can trade silver with leverage on BloFin through the XAGUSDT Perpetual, which is priced and settled in USDT. Leverage turns a swing in the price into a bigger swing in your margin. Knowing how far silver moves on a normal day, and on a bad one, tells you how much room a position needs.
What is silver volatility?
Silver volatility is how widely the silver price swings, usually measured as annualized realized volatility: the standard deviation of daily price changes, scaled up to a year. Over the ten years to November 6, 2026, the iShares Silver Trust (SLV) ran at 32.7%. That is about twice the 16.5% of the SPDR Gold Shares fund (GLD).
Both funds trade only on US market days, so their daily closes follow the metal on those days alone (source: Nasdaq, SLV historical prices, Nasdaq, GLD historical prices). The same standard deviation measure is used for stocks and for volatility in cryptocurrency, so one method lets you compare all of them.
The figure assumes that daily moves spread out like a bell curve, and silver's do not. On a bell curve, a move of more than three standard deviations should come about seven times in 2,513 trading days. The silver fund had 44 of them, so extreme days are far more common than the average suggests.
Two things the number leaves out matter to a trader. It ignores direction, so a fast rise and a fast fall count the same. It also blends calm and stormy stretches together. A quiet year and a wild one can give very different figures, which is why the window always belongs beside the number.
How volatile is silver compared with gold, stocks and bitcoin?
Over the past decade, silver has been about twice as volatile as gold and nearly twice as volatile as the S&P 500, while bitcoin was about twice as volatile as silver. In 2026 that order changed. Silver's annualized volatility so far this year is 64.7%, well above bitcoin's 44.4% over the same dates (source: Nasdaq, SLV historical prices, Coin Metrics, bitcoin reference rate).
Every figure uses the same method. It takes the simple daily change in closing prices, finds the standard deviation and scales it by the square root of the trading days in a year. The three funds, including the SPDR S&P 500 ETF Trust (SPY), trade about 252 days a year on US exchanges. Bitcoin trades every day, so its figure uses 365 days over the same calendar window (source: Nasdaq, SLV historical prices, Nasdaq, GLD historical prices, Nasdaq, SPY historical prices, Coin Metrics, bitcoin reference rate).
Window, annualized realized volatility | Silver (SLV) | Gold (GLD) | S&P 500 (SPY) | Bitcoin |
|---|---|---|---|---|
Ten years to November 6, 2026 | 32.7% | 16.5% | 18.1% | 67.0% |
Calendar 2025 | 32.4% | 19.9% | 19.5% | 41.9% |
2026 to November 6 | 64.7% | 30.3% | 13.9% | 44.4% |
August 11 to November 6, 2026 | 40.0% | 24.1% | 13.6% | 42.0% |
Over the latest three months, silver's volatility has dropped back to 40.0% (source: Nasdaq, SLV historical prices, Coin Metrics, bitcoin reference rate). That is still above its ten-year level, but just under bitcoin's 42.0%. Gold is at 24.1%, about one and a half times its long-run figure, and the S&P 500 fund has been the calmest of the four all year, at 13.9% (source: Nasdaq, SLV historical prices, Nasdaq, GLD historical prices, Nasdaq, SPY historical prices, Coin Metrics, bitcoin reference rate).
Gold has been the steadier metal throughout. Over the ten years, bitcoin's volatility ran at about four times gold's, while silver sat between the two, closer to gold. So the widest gap of the three is the one between gold and bitcoin volatility (source: Nasdaq, SLV historical prices, Nasdaq, GLD historical prices, Coin Metrics, bitcoin reference rate).
Silver against bitcoin in 2026
Silver's volatility beat bitcoin's in 8 of the first 10 months of 2026, measured month by month over the funds' trading days. Over the whole decade that happened in only 16 of 119 calendar months, and in just 2 of the 12 months of 2025. In the record so far, 2026 is the exception.
January 2026 was the most extreme month, when the silver fund ran at 124.1% against 38.5% for bitcoin. August and September went the other way, with bitcoin at 43.0% and 42.0% against 37.5% and 41.2% for silver. October swung back to silver, at 40.0% against 28.6% (source: Nasdaq, SLV historical prices, Coin Metrics, bitcoin reference rate).
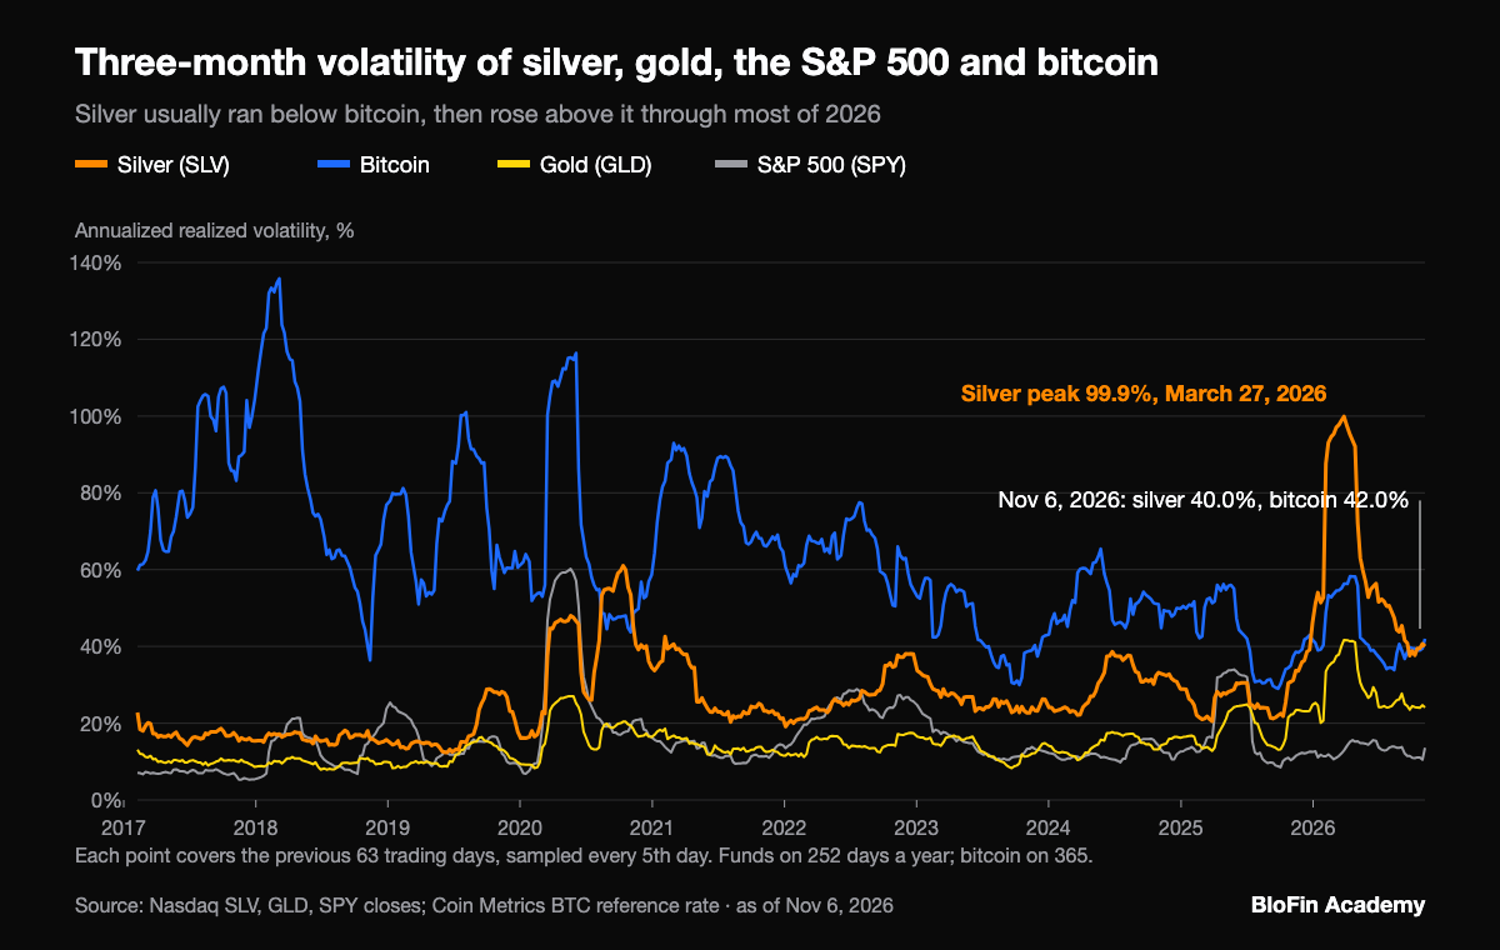
A rolling three-month measure tells the same story over a longer span. Silver's line first rose above bitcoin's in August 2020. From September 2020 to the end of 2024 it sat higher on only 9 of 218 weekly points. Since the start of 2025 it has been higher on 40 of 93 points, against about one point in ten across the whole decade (source: Nasdaq, SLV historical prices, Coin Metrics, bitcoin reference rate).
How much silver moves when gold moves
Silver usually moves in the same direction as gold, and further. Over the same ten years, a 1% daily move in the gold fund came with an average 1.56% move in the silver fund. Traders call that ratio beta. The daily correlation between the two was 0.79, where 1.0 would mean they always moved together.
Beta describes the average day, and it is far from fixed. It was 1.07 in calendar 2025, when silver's rise was more its own story. It was 1.83 in 2026 so far, when the two metals fell together and silver fell harder (source: Nasdaq, SLV historical prices, Nasdaq, GLD historical prices). Traders who watch how two markets move together use the same numbers in correlation trading.
One day can shift the long-run figure. Leaving out January 30, 2026, the day of silver's crash, drops the ten-year beta from 1.56 to 1.51. Silver's link to the stock market is much looser. Against the SPY fund, its ten-year beta is 0.44 and its correlation is 0.24, so a falling stock market tells you little about what silver will do that day (source: Nasdaq, SLV historical prices, Nasdaq, GLD historical prices, Nasdaq, SPY historical prices).
How often silver has a 3% or 5% day
A 3% or 5% day is where volatility becomes something you feel. Over the decade, the silver fund moved 3% or more from one close to the next on 255 of 2,513 trading days. That is about one day in 10, against 51 days for the gold fund and 53 for the S&P 500 fund.
Those days come in clusters. In 2026 so far, the silver fund moved 3% or more on 77 of 214 days, or 36.0%. Over the latest 63 days it did so on 14, or 22.2% (source: Nasdaq, SLV historical prices). The ten-year rate of one day in 10 understates how often silver has made those moves this year. Even the calmer recent months ran at more than twice the long-run rate.
Moves of 5% or more are rarer and even more bunched together. The silver fund had 79 of them in the decade and 36 in 2026 alone, while the gold fund had four in the decade, two of them this year (source: Nasdaq, SLV historical prices, Nasdaq, GLD historical prices). The XAGUSDT Perpetual trades every day, weekends included, so it has its own record of big days. On its daily closes, 30 of its 304 daily changes since it listed on January 8, 2026 were 5% or larger, with 16 falls and 14 rises (source: BloFin XAGUSDT Perpetual daily candles).
February had eight of those days and July had none. From September 1 to November 8 there were four in 69 days. To see what kind of day silver is having, open the XAGUSDT Perpetual and compare the live mark price with the 24-hour high and low.
Why silver is more volatile than gold
Silver swings harder than gold for three reasons that stack on top of one another. Its market is much smaller, its price answers to both investors and factories, and leveraged products amplified recent buying. Each reason adds movement on its own.
A smaller market. Silver mined in 2025, 846.6 million ounces, was worth about $33.9 billion at that year's average London price of $40.03 an ounce (source: Silver Institute, World Silver Survey 2026). Gold mined the same year, about 3,850 tonnes on the World Gold Council's current quarterly tables, was worth about $425.0 billion at the LBMA gold price's 2025 average of $3,431.50 an ounce (source: World Gold Council, Gold Demand Trends Q1 2026, World Gold Council, Gold Demand Trends Q2 2026, World Gold Council, Gold Demand Trends Q3 2026, World Gold Council, Gold Demand Trends full year 2025). That makes a year of gold output roughly 12.5 times as valuable at 2025 prices, and about 11.5 times at BloFin's November 8, 2026 perpetual closes, because silver has since risen further than gold (source: BloFin silver and gold perpetual daily candles). The same amount of buying or selling therefore moves a bigger share of the silver market. It hits the price where the silver price is set, in London's over-the-counter market and on COMEX, CME Group's metals futures exchange in New York.
Two sets of buyers. The Silver Institute describes silver as both a precious metal and an industrial commodity. Its price can follow the dollar and interest rates the way gold's does, or economic data such as industrial production and growth in gross domestic product (GDP) (source: Silver Institute, factors that determine the silver price). That gives the price two kinds of news to react to.
Leverage. The Silver Institute says the growing use of leveraged products amplified the late-2025 rally. It adds that the mix of fear of missing out and leverage made the market more fragile and helped drive a sharp rise in volatility. Trading in CME's 1,000-ounce micro contract rose 150% in 2025, and the Survey expects thinner liquidity and larger price moves than investors are used to (source: Silver Institute, World Silver Survey 2026).
Implied volatility and the VXSLV index
Implied volatility is the size of move that option prices point to over a coming period, worked out backwards from what traders pay for options. For silver, one widely quoted measure is Cboe's VXSLV, a 30-day reading built from options on the SLV fund. It closed at 46.05 on November 6, 2026.
Options cost more when traders expect bigger moves, because a bigger move makes an option more likely to pay out. Cboe applies the method of its VIX, the Cboe Volatility Index for the S&P 500, to SLV options with at least eight days to expiry. It weights the nearest two expiries into a constant 30-day measure (source: Federal Register, Cboe VXSLV notice, 2011). The record has a long hole in it. Cboe's history file has no closes between February 11, 2022, when the index stood at 31.21, and May 15, 2025, when its closes start again at 27.69 (source: Cboe, VXSLV daily history).
The November 6 reading sat close to what had just happened. Over the previous 21 trading days, the silver fund's realized volatility was 45.8%. The reading was well above 27.3, the median of all VXSLV closes published since November 2016, and near 46.8, the median since closes resumed in May 2025. It was far below the 2026 high close of 111.16 on January 29, the day before the crash, and the low for the year so far was 35.99 on September 25 (source: Cboe, VXSLV daily history, Nasdaq, SLV historical prices).
Implied volatility has usually run higher than the moves that followed. From November 2016 to February 2022, VXSLV closed above the silver fund's realized volatility over the next 21 trading days on 1,097 of 1,322 days, or 83.0%, by a median of 4.8 points. From May 2025 to early October 2026, the latest day with 21 trading days after it, the share was 239 of 352 days, or 67.9%, with a median gap of 4.6 points (source: Cboe, VXSLV daily history, Nasdaq, SLV historical prices).
CME Group also publishes a Silver CVOL index, which measures implied volatility from options on its silver futures. CME added it to its CVOL family in 2021 (source: Mondo Visione, CME Group CVOL release). Its readings sit on CME's own site and cover a different set of options from VXSLV, so the two levels can differ on the same day.
How a silver crash unfolds
A silver crash usually starts with a rally that leaves many buyers holding leveraged positions, followed by a fall that forces them out. On January 30, 2026, February COMEX silver futures settled at $78.29, down 31%. Measured by settlement price, the Wall Street Journal called it the metal's second-worst day on record (source: Wall Street Journal via Tiger Brokers).
The day before, silver hit record highs. The XAGUSDT Perpetual's highest price since listing is 121.63, on January 29, and the Silver Institute dates the all-time high above $121 to the same day (source: BloFin XAGUSDT Perpetual daily candles, Silver Institute, World Silver Survey 2026). On January 30 the silver fund's closing price fell 28.5%, its worst day in the ten years, while the gold fund's close fell 10.3% (source: Nasdaq, SLV historical prices, Nasdaq, GLD historical prices).
The Silver Institute says the reversal was first driven by technical profit-taking after the rally. Liquidations followed once President Trump nominated a hawk to lead the Federal Reserve, and silver fell 38% from peak to trough within the day, which the Survey's timeline calls the largest one-day drop on record. It adds that the forced closing of large leveraged positions made the fall worse, and that revised margin requirements, which make traders post more money just as their positions lose, triggered more selling (source: Silver Institute, World Silver Survey 2026).
COMEX has brakes for fast markets, and each one pauses trading briefly without setting a floor under the price. Under the rule CME filed in 2021, silver futures carry dynamic circuit breakers, which are price bands measured over a rolling 60-minute look-back. A trade, bid or offer through a band starts a two-minute halt (source: CME Group, Rule 589 filing to the CFTC, 2021).
No two-minute halt was announced on January 30, according to David Jensen, a precious metals newsletter writer who emailed CME that day to ask why (source: David Jensen, Jensen's Economic, Precious Metals & Markets Newsletter).
In China, trading in the UBS SDIC Silver Futures Fund was halted on January 30 (source: Deep News via Tiger Brokers). GoldFix reported that the fund's notice suspended it on the Shenzhen Stock Exchange from the open to the close that day (source: GoldFix via ZeroHedge). Silver kept falling in the months that followed, and why silver is going down traces that slide.
What a 5% silver day does at 10x and 20x
A 5% fall in silver takes about half your margin at 10x leverage and all of it at 20x, because leverage multiplies the move against the margin you put up. October 30, 2026 is a real example. The XAGUSDT Perpetual's daily close fell 5.15%, from 52.08 to 49.40, and it touched 48.98 during the day.
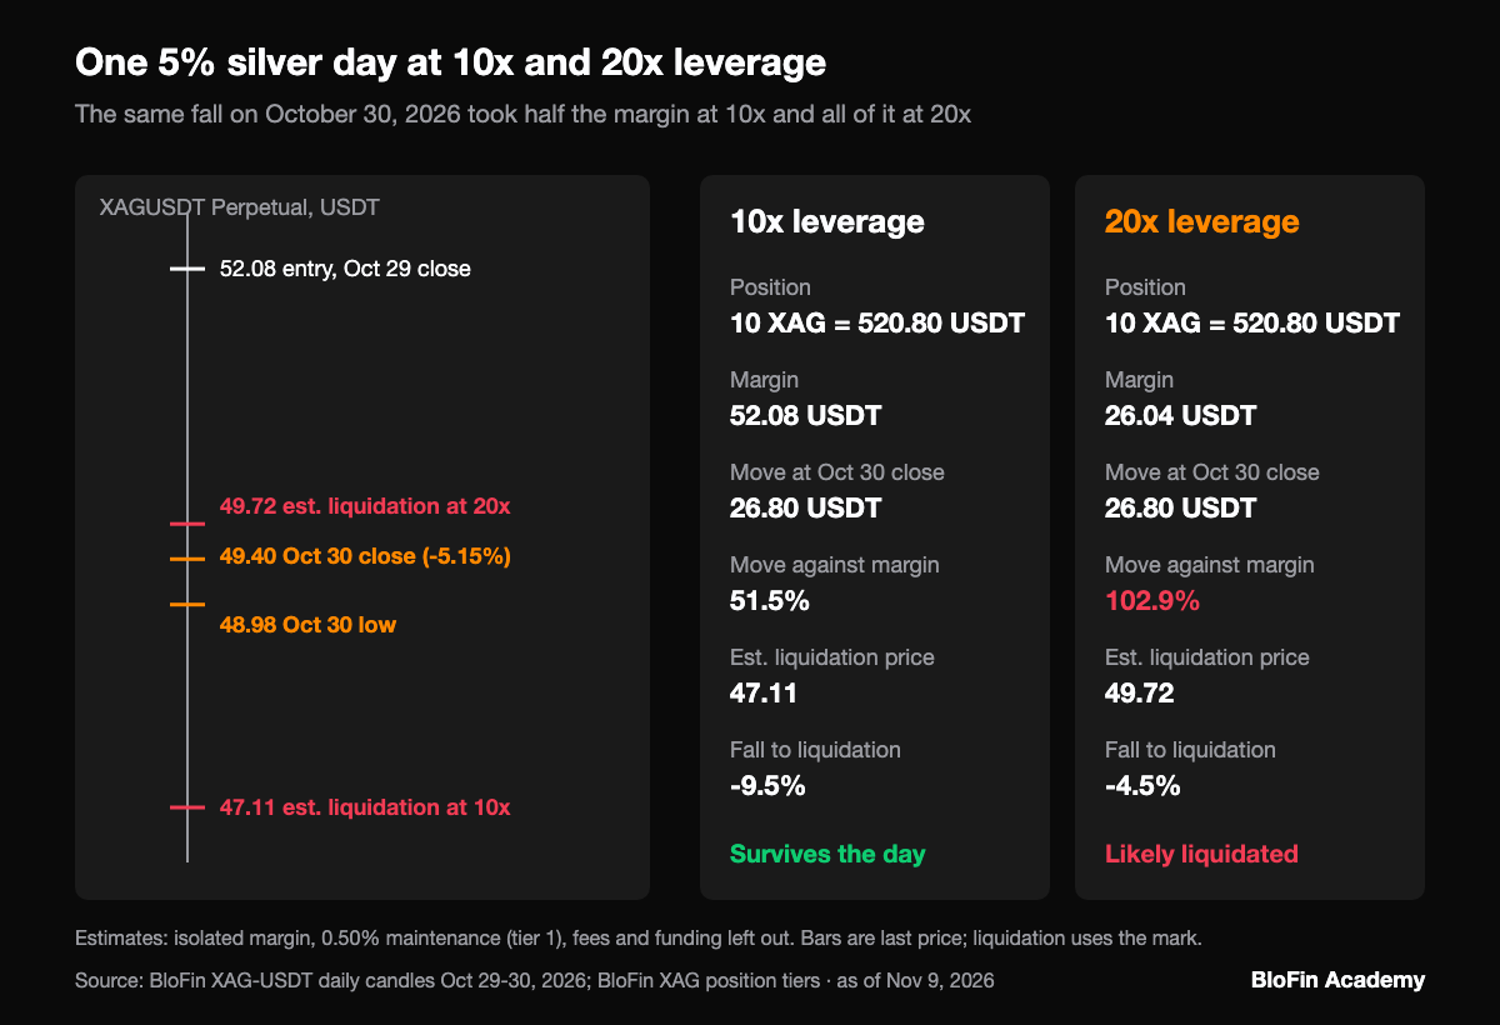
Say you bought 10 XAG, which is 10 troy ounces of silver or 1,000 contracts, at the October 29 close of 52.08. The position is worth 520.80 USDT, so it needs 52.08 USDT of margin at 10x and 26.04 USDT at 20x. By the October 30 close the price had moved 26.80 USDT against the position. That is 51.5% of the 10x margin, and a move larger than the whole 20x margin. The taker fee of 0.0600% adds about 0.31 USDT to open and 0.30 USDT to close (source: BloFin fees).
The 20x position would very likely have been liquidated before the day was out. As a rough estimate on isolated margin, liquidation comes when the loss leaves only the maintenance margin. On BloFin that is 0.50% of the position value on the first tier, which covers positions up to 400 XAG (source: BloFin XAG position tiers). That puts the 20x liquidation price near 49.72, a fall of about 4.5%, which the day's low went through. The 10x liquidation price sits near 47.11, about 9.5% under the entry.
Those estimates leave out fees and funding, and they use the last traded price. BloFin liquidates on the mark price, which can sit a little away from the last price of the most recent trade. So check the order panel's estimated Liq. Price before you confirm any order. Any one of the XAGUSDT Perpetual's four 5% days since September 1 could have closed a 20x position.
A stop changes the sum. With a stop-loss order on BloFin in place, the loss you take is fixed by the size of the trade and the gap between entry and stop, while leverage only sets how much margin you post. That is why sizing a silver position for its volatility starts from how far silver can move in a day.
Looking to trade silver? To get started, you'll need to first create a BloFin account, fund your account with cryptocurrency, and navigate to the XAGUSDT Perpetual trading page.

Frequently asked questions
How is annualized volatility calculated?
Annualized volatility scales a daily figure up to a year. Over the ten years to November 6, 2026, the silver fund's daily closing changes had a standard deviation of 2.06%. Multiplying that by the square root of 252, about 15.87, gives about 32.7% a year. Bitcoin's daily figure of 3.51% is multiplied by the square root of 365, about 19.10, and that gives about 67.0% (source: Nasdaq, SLV historical prices, Coin Metrics, bitcoin reference rate).
Does silver get more volatile when its price falls?
By the options measure, silver gets more volatile when its price jumps than when it falls. Its implied volatility, VXSLV, has risen more on big up days than on big down days. From November 2016 to February 2022 it gained an average of 4.51 points on days the silver fund rose 3% or more, against 1.55 points on days it fell 3% or more. Since its closes resumed in May 2025, it has gained 3.33 points on big up days and lost 0.66 points on big down days (source: Cboe, VXSLV daily history, Nasdaq, SLV historical prices).
What time of day does silver move most on BloFin?
On the XAGUSDT Perpetual's four-hour bars from January 13 to November 9, 2026, the weekday bar starting at 12PM UTC moved most. It moved 1.38% on average from open to close, while the bar starting at 8PM UTC moved least, at 0.61%. Weekend daily bars were far calmer, with an average change of 0.73% against 2.76% on weekdays (source: BloFin XAGUSDT Perpetual four-hour and daily candles).
Has silver risen 10% in a single day in the past decade?
The silver fund's biggest one-day rise in the ten years to November 6, 2026 was 9.1%, on October 3, 2022, just short of 10%. Over the same decade it fell 10% or more on five separate days. Those include the 28.5% drop of January 30, 2026 and a 15.8% drop on February 5, 2026 (source: Nasdaq, SLV historical prices). Its sharpest moves have been falls.
How volatile was silver before 2026?
From November 2016 to the end of 2025, the silver fund's annualized volatility was 28.0%, against 14.6% for the gold fund. So silver ran at close to twice gold's level even in calmer years. Including 2026 lifts the decade's figure to 32.7%, and leaving out January 30, 2026 alone brings it back to 31.4% (source: Nasdaq, SLV historical prices, Nasdaq, GLD historical prices).
Researched and written by the BloFin Academy editorial team with AI-assisted drafting. All facts independently verified. Primary sources include Nasdaq's fund price histories, Coin Metrics, Cboe's VXSLV history file, CME Group's 2021 rule filing with the CFTC, the Silver Institute's World Silver Survey 2026 and BloFin's XAGUSDT Perpetual candles, current as of November 10, 2026.
Nothing in this article constitutes financial advice. Silver has moved 5% or more in a day dozens of times since January 2026, and on the XAGUSDT Perpetual a move that size can take half the margin at 10x and close a position at 20x before the day ends. Past volatility does not tell you how far silver will move next, and implied volatility is an expectation, never a promise. Past performance does not indicate future results. Do your own research and consider your risk tolerance before you trade on BloFin.