
Silver set a record above $121 an ounce in late January 2026, then lost more than half its value over the next nine months. October brought a fresh slide, and this time gold barely moved while silver fell by almost a tenth.
Most headlines give one reason for each drop, usually the Federal Reserve or the dollar. The record is messier, because the reasons changed from month to month, and in October the usual suspects even moved the wrong way. Bond yields eased over the month while silver kept falling.
Each fall is easier to understand once it is dated, measured against gold and matched to what was actually reported on the day.
Why is silver going down?
Silver is going down because traders expect the Federal Reserve to keep raising interest rates while oil-driven inflation stays high, and because silver's industrial half suffers when growth slows. On top of that, heavy selling by leveraged futures traders turned each piece of bad news into a large one-day fall.
The rate story runs the opposite way to the usual "Fed cuts" explainer. The Fed raised its target range by a quarter point to 3.75% to 4.00% on September 16, 2026, on a 12 to 0 vote (source: Federal Reserve, September 16, 2026). Natixis called it the first hike in three years (source: Kitco, October 27, 2026). Silver pays no interest, so every expected hike makes holding it more expensive compared with cash or Treasury bills.
Inflation is the reason the hikes are expected. The war involving Iran was already driving oil prices higher and stoking inflation fears by May (source: Kitco, May 15, 2026). Uncertainty around the Strait of Hormuz was still keeping oil elevated in late October (source: Kitco AM report, October 27, 2026). Say you compare $10,000 of silver with $10,000 in Treasury bills paying 4%. The bills earn about $400 a year, and each further quarter-point hike adds about $25 that the silver holder gives up. When inflation runs hot, traders price in another hike, the case for a metal that pays nothing weakens, and silver falls.
Selling pressure inside the market does the rest. Many silver positions are held with borrowed money in futures, and when the price drops, those traders are forced to cut. On October 22, Kitco noted that positioning, liquidation pressure and the outlook for tighter policy outweighed the support from falling yields (source: Kitco, October 22, 2026). That is why bad news tends to hit silver in large single days.
What pushed silver lower in October 2026
October's slide came in two sharp steps, each set off by an inflation scare. Between them the price drifted lower as traders braced for more tightening.
The minutes of the September meeting came out on October 7. They showed that all participants had supported the hike, and that most expected another increase "would likely be appropriate by year end" (source: Federal Reserve, September 2026 minutes). A week later, on October 14, the September consumer price index came in hotter than forecast. Inflation was reported at 3.7% from a year earlier and 0.6% on the month, and gasoline accounted for more than half of the monthly rise. Spot silver fell about 6% that day as bets on further tightening grew (source: Kitco, October 14, 2026).
The second step came on October 22. More Houthi attacks in Saudi Arabia pushed Brent crude to its highest level since May, Reuters reported (source: Reuters, October 22, 2026). Spot silver fell 5.9% as the oil spike revived inflation and rate-hike fears, and it was also hit by worries about industrial demand and slowing growth (source: Kitco, October 22, 2026). Both of those falls are Kitco's spot-price moves, and BloFin's UTC daily closes for the same days come out slightly smaller.
That second fall is a useful lesson in reading the news. The 10-year Treasury yield fell from 5.13% to 4.96% that day (source: US Treasury, daily par yield curve rates), and the Fed's broad dollar index barely moved, from 121.34 to 121.35 (source: Federal Reserve, H.10 broad dollar index). Over the month the 10-year yield eased from 5.24% on October 1 to 4.99% on October 27 (source: US Treasury, daily par yield curve rates). Silver fell that day even though yields fell and the dollar barely moved.
Going into the October 27 to 28 meeting, 94 of 100 economists in a Reuters poll expected the Fed to hold, and all 100 expected a hike in December (source: Reuters, October 20, 2026). On October 28 the Fed held its target range at 3.75% to 4.00% on a 10 to 2 vote, with Lisa Cook and Beth Hammack voting for another quarter-point hike (source: Federal Reserve, October 28, 2026). What happens at an FOMC meeting covers how those decisions are made and announced.
How far has silver fallen in 2026?
Silver has fallen by more than half since its January record. On BloFin's silver perpetual, the daily close peaked at $117.72 on January 28, 2026 and stood at $54.57 on October 27, a drop of 53.6%. Gold fell 26.2% over the same dates, so silver lost about twice as much.
The peak itself depends on which price you read. Reuters put spot silver's record at $121.64 (source: Reuters, February 2, 2026). The Silver Institute gives $118.45 on the London fix of January 29, after a 64.5% rise from the end of December (source: Silver Institute, gold/silver ratio report, July 2026). Daily closes on BloFin's perpetuals, in UTC, trace the path since then, with the gold/silver ratio, gold's price divided by silver's, alongside:
Date (2026) | Silver close | Gold close | Gold/silver ratio |
|---|---|---|---|
January 28 | $117.72 | $5,516.09 | 46.9 |
January 30 | $85.95 | $4,902.93 | 57.0 |
February 5 | $67.12 | $4,703.13 | 70.1 |
March 31 | $74.90 | $4,696.22 | 62.7 |
June 30 | $58.41 | $4,005.13 | 68.6 |
September 30 | $60.46 | $4,160.70 | 68.8 |
October 27 | $54.57 | $4,070.07 | 74.6 |
The fall was never a straight line. Silver recovered to the mid-$70s by early April, as the Silver Institute also noted (source: Silver Institute, April 15, 2026), then slid through the summer as inflation and rate-hike fears built. A rally from about $58 in early August to above $67 in late September also faded. Even after the fall, the price sits above the $49.45 London peak of January 1980 (source: Silver Institute, gold/silver ratio report, July 2026). Silver's 50 years of boom and bust compares this cycle with the earlier ones.
What caused the January 30 and February 5 crashes
Two days did most of the early damage, and the reported triggers were different each time. Each one also had something that made a bad day much worse:
Day | Silver close change | Reported trigger | What made it worse |
|---|---|---|---|
January 30 | −26.8% | President Trump named Kevin Warsh as the next Fed chair, and the dollar index rose (source: Kitco, January 30, 2026) | Silver was already down about 15% before the announcement (source: Philstar, February 2, 2026) |
February 5 | −24.9% | The dollar index hit a two-week high and oil fell (source: Kitco, February 5, 2026) | Long liquidation, as short-term traders who had bought the dip earlier that week sold out (source: Kitco, February 5, 2026) |
The Warsh news was a trigger, and the size of the fall came from how crowded the trade had become. Société Générale's analysts said the moves showed the drop "was about positioning", made worse by risk limits being hit, trend-following funds cutting exposure and the timing at month-end (source: Kitco, February 2, 2026).
Margins explain why selling fed on itself. A futures margin is the deposit a trader must keep against a position, and CME switched precious-metals margins to a percentage of contract value on January 13 (source: Reuters, February 6, 2026). It announced a rise in silver margins to 15% on January 30, effective after the close on Monday, February 2 (source: Motilal Oswal, January 31, 2026), so that increase arrived after the crash day itself. The next rise, to 18% from 15%, was announced on February 5. It took effect after the close on February 6 (source: Reuters, February 6, 2026), so it too came after the fall. As prices fall, traders who cannot top up their deposit are forced to sell, which pushes prices lower and triggers more margin calls. Margin calls have broken a silver rally before: on March 27, 1980, silver fell 50% after the Hunt brothers could not meet a $100 million margin call (source: Silver Institute, gold/silver ratio report, July 2026).
What moves the silver price?
Four forces move the silver price: interest rates and the dollar, industrial demand, a supply that responds slowly, and leveraged trading in futures. Rates and the dollar set the background, factories and solar makers set much of the demand, and futures traders decide how quickly prices react to news.
Rates matter because silver pays nothing, and the dollar matters because silver is priced in dollars. Say you buy silver in euros and an ounce costs $54. If the dollar rises 5% against the euro, you now pay about 5% more in euros for the same ounce, so buyers like you outside the US tend to buy less. Higher expected rates raise the cost of holding the metal, and a stronger dollar raises its price for everyone paying in another currency. How real interest rates affect gold explains the same link for gold, and gold and the dollar index covers the currency side.
Industry is the bigger difference from gold. Industrial uses took 657.4 million ounces in 2025, about 58% of total demand of 1,130.6 million ounces, by the Silver Institute's figures (source: Silver Institute, World Silver Survey 2026). Solar panels are a large part of that, and solar makers have been using less silver per panel as costs rose, a process called thrifting, which cut solar demand in 2025 (source: Silver Institute, World Silver Survey 2026). When traders fear slower growth, this industrial half is the part of demand they mark down.
Supply cannot respond quickly to price. Only 26% of mined silver came from primary silver mines in 2025, a record low, so roughly three-quarters is a by-product of mining for copper, lead, zinc and gold (source: Silver Institute, World Silver Survey 2026). Mines do not produce much more silver when the price rises, or much less when it falls, so the adjustment happens through price.
Why silver can fall during a supply deficit
The silver market has used more metal than it produced for five years running. The 2025 shortfall was 40.3 million ounces, and the World Silver Survey 2026 forecasts a sixth deficit of 46.3 million ounces in 2026 (source: Silver Institute, World Silver Survey 2026). A deficit sounds like a reason for prices to rise, so falling prices during one confuse many readers.
The answer is that a deficit is drawn from large stockpiles. London vaults held 28,985 tonnes of silver at the end of September 2026, 1.95% more than a month earlier (source: LBMA, London vault data). A shortfall of 40 million ounces is about 1,250 tonnes, less than 5% of that London stock alone. Prices over a few months are set by what investors and futures traders do with existing metal, and that can swamp a yearly gap of this size. Forecasters also disagree about the next step. Deutsche Bank's head of metals research said in October that the silver market had likely tipped into oversupply (source: Kitco, October 2, 2026), while the Silver Institute's April forecast was for a deficit.
Why does silver fall harder than gold?
Silver falls harder than gold because its market is far smaller and about half its demand is industrial, so it reacts to growth fears that barely touch gold. Thin markets also amplify forced selling. In October 2026 silver's average daily move on BloFin was about twice gold's.
The size gap is large. At the end of September 2026, the gold in London vaults was valued at $1.3 trillion against $56.6 billion for the silver (source: LBMA, London vault data). The same amount of money moving in or out therefore shifts silver's price much further. The Silver Institute expects liquidity to be thinner and "price moves likely to be larger than investors have grown used to" (source: Silver Institute, World Silver Survey 2026).
BloFin's daily closes (UTC) for its XAGUSDT Perpetual on silver and its gold perpetual put numbers on the gap:
Period or day (2026) | Silver | Gold |
|---|---|---|
January 28 to October 27 | −53.6% | −26.2% |
January 30 | −26.8% | −9.9% |
February 5 | −24.9% | −6.2% |
October 14 | −5.5% | −1.0% |
October 22 | −5.1% | −2.4% |
September 30 to October 27 | −9.7% | −2.2% |
Average daily move, October 1 to 27 | 1.24% | 0.63% |
The same pattern shows up in the Silver Institute's own figures. By the end of May, silver had fallen 36% from its January peak while gold had fallen 18% (source: Silver Institute, gold/silver ratio report, July 2026). Gold has no comparable industrial half, so when traders expect higher rates to slow factories down, silver takes the larger hit.
You can trade that gap in either direction on the XAGUSDT Perpetual, which follows silver around the clock.
What is the gold/silver ratio?
The gold/silver ratio is the number of ounces of silver needed to buy one ounce of gold, found by dividing the gold price by the silver price. A rising ratio means silver is losing ground against gold, and a falling ratio means silver is outperforming.
The calculation is a single division. On October 27, BloFin's gold perpetual closed at $4,070.07 and its silver perpetual at $54.57, so the ratio was 4,070.07 ÷ 54.57 = 74.6. In other words, one ounce of gold bought about 75 ounces of silver, up from 46.9 at the January 28 peak in silver. The Silver Institute dates the low point of that move to 45.6 on January 27 (source: Silver Institute, gold/silver ratio report, July 2026).
Readings this high or low have happened before, and history shows how wide the range is:
Date | Gold/silver ratio | What was happening |
|---|---|---|
January 18, 1980 | 16.7 (lowest since 1968) | The Hunt brothers' attempt to corner silver |
April 28, 2011 | 31.7 | Silver's spike to near $49 |
March 18, 2020 | 125.7 (record high) | Silver at its weakest against gold |
April 2025 | 107 | Before silver's 2025 rally |
January 27, 2026 | 45.6 | Silver's record run |
October 27, 2026 | 74.6 | After the 2026 fall (BloFin closes) |
The readings come from the Silver Institute's ratio report (source: Silver Institute, gold/silver ratio report, July 2026) and its World Silver Survey (source: Silver Institute, World Silver Survey 2026), apart from the October 2026 reading, which comes from BloFin's closes. The median since 1971, based on monthly averages, has been 62.9 (source: Silver Institute, gold/silver ratio report, July 2026). The October reading of 74.6 is above that, which means silver is priced low against gold compared with its history. It does not say when that will change: the ratio stayed above 85 for months in 2025 before falling.
Will silver go back up?
Nobody can say whether silver will go back up or when, but the forces that pushed it down are clear, and so are the events that could change them. Oil and inflation, the Fed's next move and the outlook for factory demand matter most, and each has a date when new information arrives.
The first is inflation. If oil falls back and price rises cool, traders would have less reason to expect a December hike. Say you are watching the October consumer price index, and it shows prices up 0.2% on the month, a third of September's 0.6%. Traders would then have to rethink how many hikes are coming, and silver's biggest headwind would weaken. The September personal consumption expenditures index, the Fed's preferred inflation gauge, is due on October 29 (source: Kitco AM report, October 27, 2026), and the October consumer price index on November 10 at 8.30AM ET (source: BLS, CPI release schedule). How the PCE report moves markets explains why that release matters.
The second is the Fed itself. The next meeting runs December 8 to 9 (source: Federal Reserve, FOMC calendar), and all 100 economists in the pre-meeting Reuters poll expected a hike there (source: Reuters, October 20, 2026). A hike that arrives as expected tends to move prices less than a surprise in either direction. The third is industry: news that factories and solar makers are cutting back would weigh on the industrial half of demand, while signs of recovery would support it.
Forecasts point both ways, which is a reason to treat any single one with care. J.P. Morgan forecast in August that silver would average $63 an ounce in the fourth quarter of 2026 (source: J.P. Morgan Global Research, August 13, 2026), a level silver has already fallen below.
How to trade silver on BloFin
BloFin lists the XAGUSDT Perpetual, which tracks the silver price in USDT at up to 100x leverage. Each contract is 0.01 ounce of silver, and a perpetual lets you go long if you expect a rise or short if you expect a fall.
The silver perpetual trades 24 hours a day, seven days a week, but trading is much thinner at weekends, when the main silver markets are closed. On BloFin, XAGUSDT traded about 1.1 million contracts on Saturday, October 24 and about 0.8 million on Sunday, against 2.0 million on Tuesday, October 27. A thin market can gap when the main markets reopen. 24/7 gold trading and the liquidity gaps explains the same effect on gold. Longs and shorts on XAGUSDT exchange a funding fee every four hours, and how funding rates work shows how the fee is calculated.
Size from the loss you can accept before you choose leverage. Say you open a 1,000 USDT long on XAGUSDT at 5x, which ties up 200 USDT of margin and, at a $54.57 price, comes to about 1,833 contracts. A 5.1% fall, the size of silver's drop on October 22, costs about 51 USDT, or 25.5% of that margin. Four such falls in a row would cost about 189 USDT, nearly 95% of the margin, leaving about 11 USDT. The position could be liquidated before the fourth fall ends. How leverage and liquidation work shows where the liquidation price sits, and BloFin uses the mark price rather than the last trade to trigger it.
To open a position on XAGUSDT:
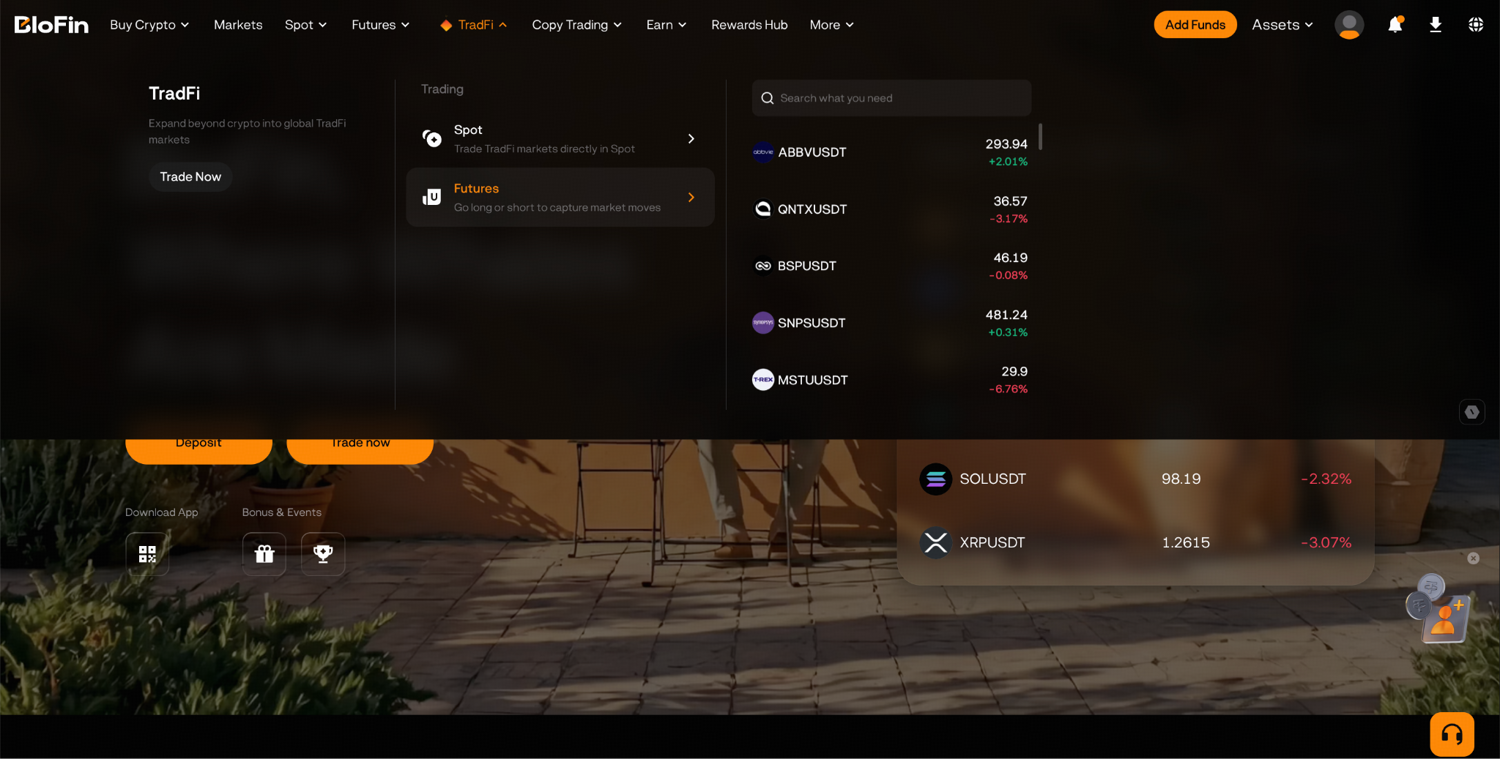
Step 1: Log in to your BloFin account and hover your cursor over the TradFi tab. Then, click Futures.
Step 2: Click the trading pair shown above the chart to open the pop-up window, type XAG in the search field and select the XAGUSDT Perpetual.
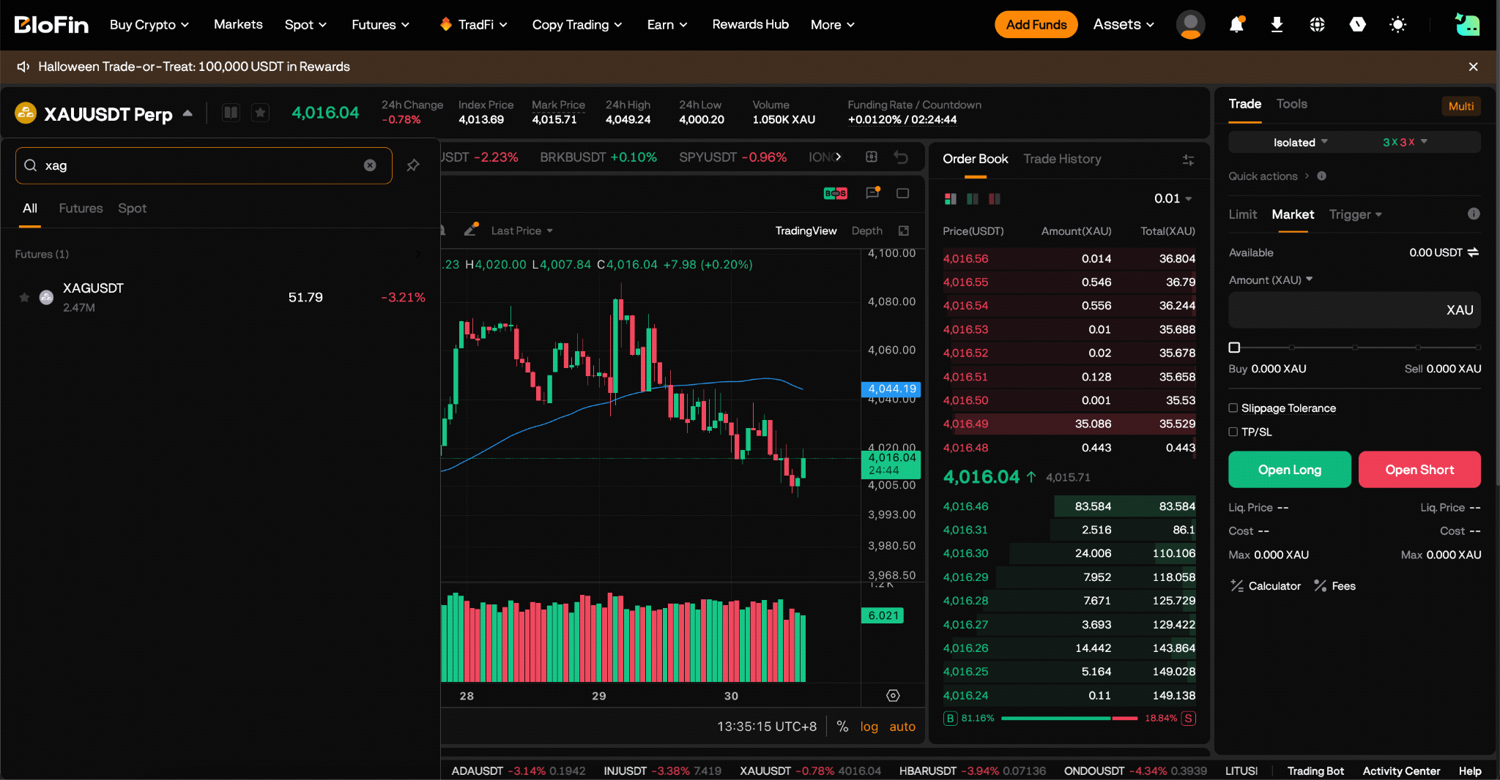
Step 3: Set your margin mode to Isolated and choose your leverage before entering any order.
Step 4: On the order panel, select Buy long or Sell short, choose Market or Limit as the order type, and enter your size.
Step 5: Review the estimated margin and liquidation price, then submit. The trade appears in Positions with its entry price, size, margin used and estimated liquidation price.
A stop-loss limits a gradual move against you, but a 25% day like January 30 can jump past it. How to set a stop-loss on BloFin shows how to place one. XAGUSDT is also open to copy trading, so you can follow a lead trader's silver positions instead of placing each one yourself, as how to copy trade on BloFin explains.
Looking to trade silver? To get started, you'll need to first create a BloFin account, fund your account with cryptocurrency, and navigate to the XAGUSDT Perpetual page.
Frequently asked questions
Is silver more volatile than bitcoin?
In 2026 it has been. On BloFin's daily closes from January 8 to October 27, 2026, the silver perpetual moved 2.19% on an average day against 1.59% for the bitcoin perpetual. Silver had 29 days with a move of 5% or more against 14 for bitcoin, and its worst day, January 30, was a 26.8% fall against bitcoin's worst of 14.1%.
What is silver's all-time high?
Silver's all-time high came on January 29, 2026, when the Silver Institute says it rose above $121 an ounce (source: Silver Institute, April 15, 2026). The earlier London record of $49.45, set on January 18, 1980 (source: Silver Institute, gold/silver ratio report, July 2026), survived a near miss at $48.70 in 2011 (source: Silver Institute, World Silver Survey 2026). It fell in 2025, when silver broke $50 for the first time since 1980 (source: Silver Institute, World Silver Survey 2026).
How much silver is mined each year?
Mines produced 846.6 million ounces of silver in 2025, up 3% on the year, and recycling added a 12-year high of 197.6 million ounces (source: Silver Institute, April 15, 2026). Total supply of 1,090.4 million ounces still fell short of demand, leaving the fifth deficit in a row (source: Silver Institute, World Silver Survey 2026).
How much silver goes into solar panels?
Solar panels used 186.6 million ounces of silver in 2025, about 16.5% of total silver demand, after more than doubling between 2020 and 2024 (source: Silver Institute, World Silver Survey 2026). The figure fell in 2025 because manufacturers cut the silver in each cell, and the Silver Institute forecasts 151 million ounces for 2026 (source: Silver Institute, World Silver Survey 2026).
Did China ban silver exports?
Reports of Chinese silver export restrictions were wrong, the Silver Institute's World Silver Survey says, though they added to silver's rally (source: Silver Institute, World Silver Survey 2026). China did end its export tax rebate on solar products from April 1, 2026 (source: Xinhua, January 10, 2026), and J.P. Morgan said strong Chinese silver imports in March likely reflected buying ahead of that change (source: J.P. Morgan Global Research, August 13, 2026).
Researched and written by the BloFin Academy editorial team with AI-assisted drafting. All facts independently verified. Primary sources include the Federal Reserve, the US Treasury, the Silver Institute's World Silver Survey 2026 and gold/silver ratio report, LBMA vault data, the Bureau of Labor Statistics, Reuters, Kitco and BloFin, current as of October 28, 2026.
Nothing in this article constitutes financial advice, and nothing in it is a recommendation to buy, sell or hold silver, gold or any crypto asset. Silver can fall by a quarter in a single day, and a stop-loss may not fill at its trigger price in a gap. XAGUSDT trades around the clock with thinner liquidity at weekends, and a leveraged position can be liquidated and lose all the margin behind it. BloFin services are not available in restricted locations, including the United States. Past performance does not indicate future results. Do your own research and consider your risk tolerance before you trade on BloFin.