
Open any silver chart and a headline is ready to explain each swing: the Fed, the dollar, China, solar panels, a squeeze in London. Silver is both a precious metal and a factory input, so almost any economic news can be tied to it after the fact, and the explanations rarely agree from one week to the next.
That makes lists of what moves silver easy to write and hard to use. A typical list says a stronger dollar hurts silver and rate cuts help it, then leaves out the years when the opposite happened. Without those years, you cannot tell a reliable link from a story that happened to fit one chart.
A fairer test of each driver runs both ways: how closely has silver followed it, and when did the link break? Measured over decades of monthly prices, gold comes out well ahead of the rest, and even it fails often enough that no single driver can carry a trade.
BloFin's silver market is the XAGUSDT Perpetual, a USDT-settled contract whose mark price follows an index price for silver. The same drivers reach that contract through its mark price, the reference BloFin uses to value positions, so news that moves silver can also change your margin.
What moves the silver price?
The silver price moves with gold first, then with the dollar, real interest rates, industrial demand, oil, investor positioning and index flows. Gold has been the closest partner by a wide margin since 2006, yet the Silver Institute's own study found "no magic formula" that consistently explains the price (source: Silver Institute factors report).
These drivers work through the markets that set the silver price, including COMEX futures in New York and over-the-counter trading in London. Each one matters at some times and fades at others, partly because silver is both an investor's metal and an industrial one. Sometimes it trades on the dollar and interest rates, and sometimes on factory output and growth (source: Silver Institute factors report).
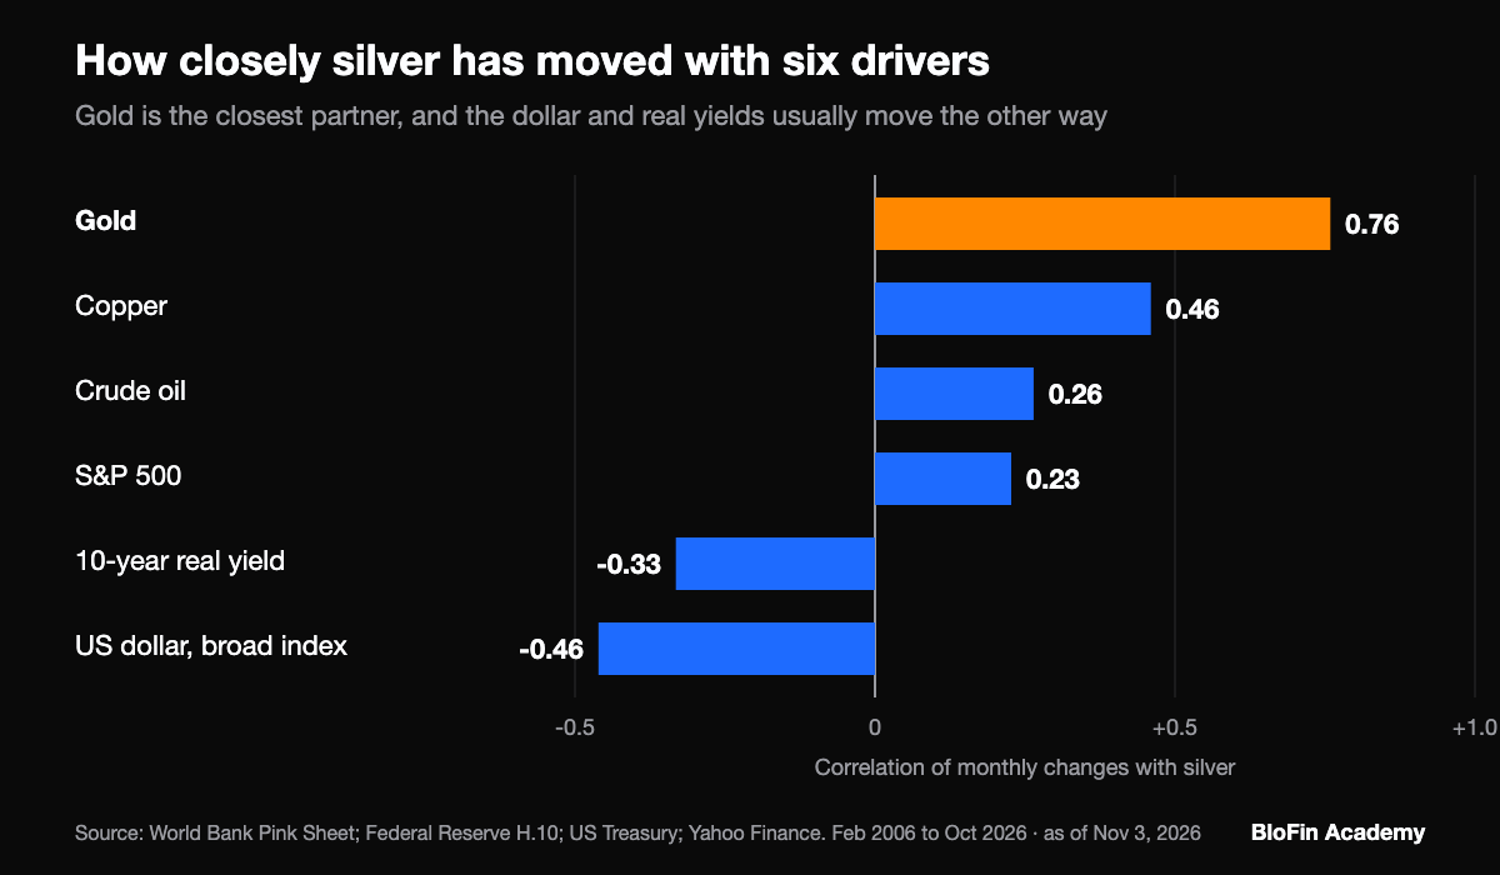
To compare them on one basis, take the monthly change in silver against the monthly change in each driver, from February 2006 to October 2026, the longest stretch all six series share. Correlation scores how closely two prices have tracked each other, where 1.0 means always in step and -1.0 means always opposite. It never proves that one causes the other, because gold and silver can both be reacting to a third force such as the dollar.
Driver | Correlation with silver | Months silver moved the usual way | A period that went the other way |
|---|---|---|---|
Gold | 0.76 | 87.6% (same direction) | 2007 to 2008: gold +22.7%, silver -16.3% |
US dollar, broad index | -0.46 | 70.7% (opposite direction) | Year to January 2025: dollar +7.2%, silver +32.8% |
Copper | 0.46 | 69.0% (same direction) | 1991 to 1995: correlation of -0.16 |
10-year real yield | -0.33 | 68.3% (opposite direction) | March to October 2023: yield +1.05 points, silver +1.8% |
Crude oil | 0.26 | 61.9% (same direction) | December 2021 to June 2022: oil +60.2%, silver -4.0% |
S&P 500 | 0.23 | 58.5% (same direction) | August 2011: S&P 500 -10.6%, silver +6.3% |
The prices are monthly averages (source: World Bank Pink Sheet; Federal Reserve H.10; US Treasury real yields; Yahoo Finance S&P 500). The percentages count only months in which both series changed. The World Bank rounds silver to 10 cents, so some months show no change. If the two series moved independently, about half of months would still match.
How closely silver follows gold
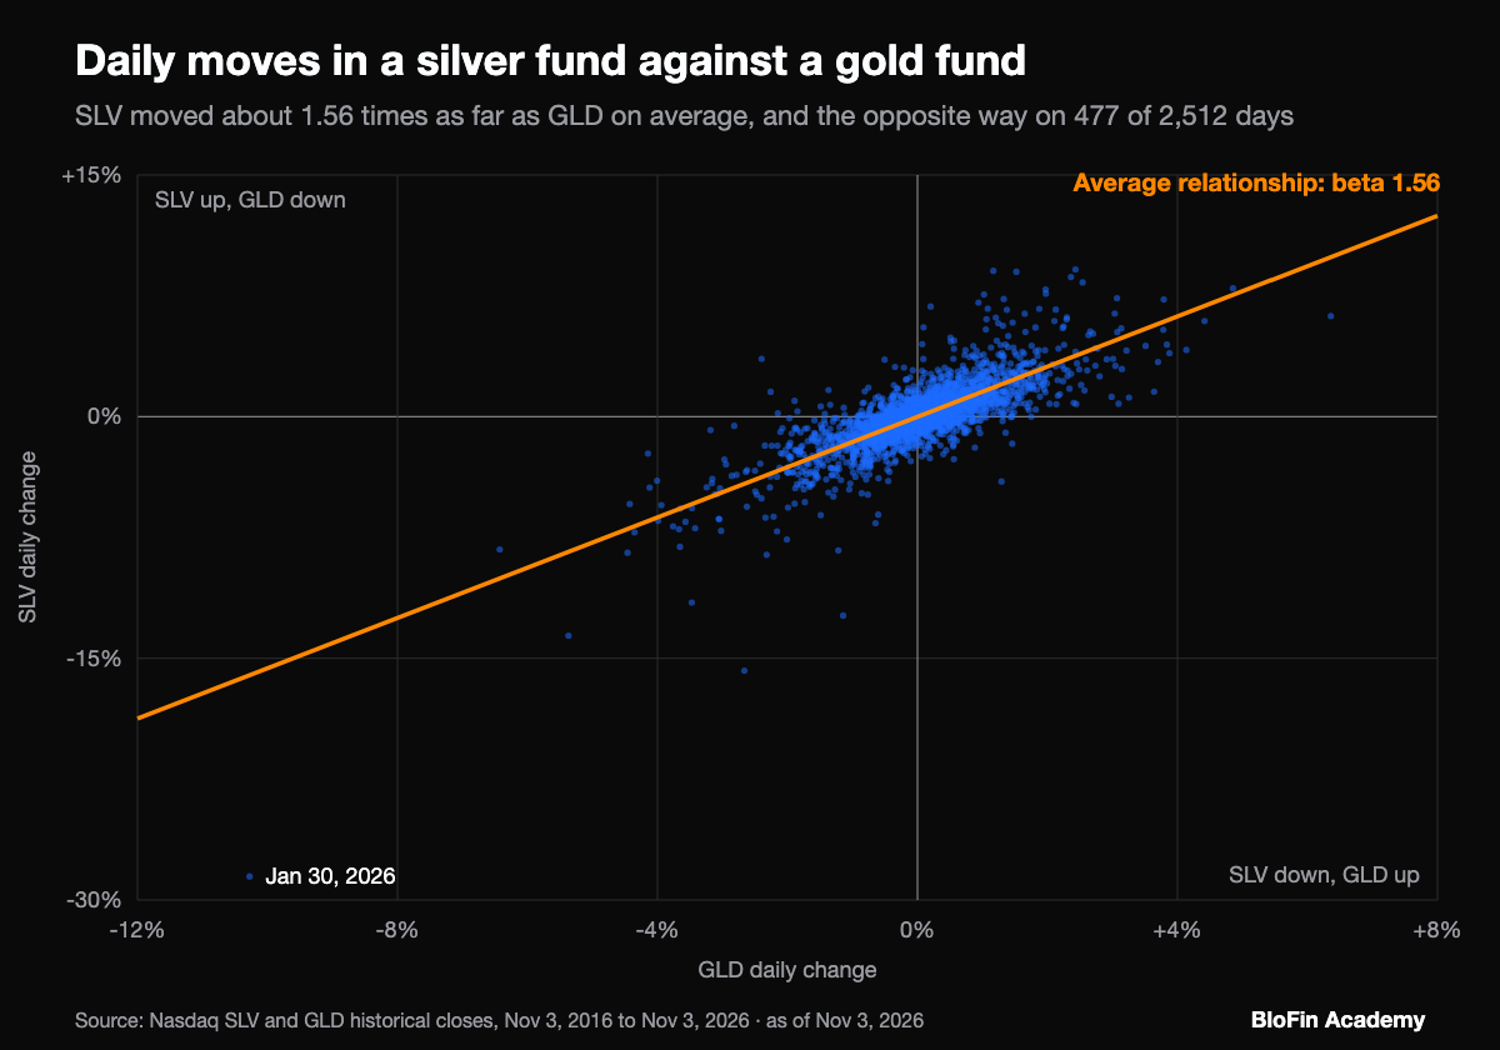
Silver follows gold more closely than it follows any other driver, and it usually moves further. In the decade to November 3, 2026, daily changes in the SLV silver fund ran about 1.56 times those of the GLD gold fund, a ratio traders call beta (source: Nasdaq SLV prices; Nasdaq GLD prices).
Beta tells you the average size of the move, so a 2% day for GLD would suggest about 3.1% for SLV. It is a poor guide to any one day, because the two funds moved in opposite directions on 477 of 2,512 trading days, about 19%. Beta also changes with the year, ranging from 1.07 in 2025 to 1.84 in 2026 so far. It was 1.44 on days GLD rose and 1.72 on days GLD fell, but that gap comes from 2026: through 2025 the two were 1.41 and 1.42 (source: Nasdaq SLV prices; Nasdaq GLD prices).
The longer record has more failures in it. On monthly averages from February 1971 to October 2026, the same measure is 1.22, a blend of 1.18 to 1990, 0.81 from 1991 to 2005 and 1.54 since 2006 (source: World Bank Pink Sheet). Gold moved 5% or more in 146 of those 669 months. Silver went the same way in 127 of them, but it moved further than gold in only 80, so "silver always moves more" overstates the pattern.
The link can also go slack for years, as it did from 1996 to 2000, when silver's monthly correlation with gold fell to 0.24 and its beta to 0.33 (source: World Bank Pink Sheet). Silver also lacks gold's large official buyer: governments were net sellers of just 1.5 million ounces in 2025, against total supply of 1,090.4 million (source: World Silver Survey 2026). Central banks' gold purchases reached 321 tonnes in the July to September 2026 quarter, and 675 tonnes in the year to date (source: World Gold Council, Q3 2026), and that buying can lift gold without giving silver any direct support.
Industrial demand and China PMI data
Industrial demand is the main way silver differs from gold, and factories used 657.4 million ounces of the metal in 2025. That was about 58% of demand before counting fund buying, or about 47% with it (source: World Silver Survey 2026). Copper, another metal tied to factories, is a rough stand-in for that link, because copper also moves with the dollar.
Silver's monthly correlation with copper is 0.46 since 2006, and the Silver Institute measured 0.35 from 1990 to 2023. Part of that link comes from mining, since copper mines produced 26% of the silver mined in 2022 (source: Silver Institute factors report). The strength has varied widely, from -0.16 in 1991 to 1995 to 0.67 over the five years to October 2026, when it came close to gold's 0.72 (source: World Bank Pink Sheet).
China's official manufacturing purchasing managers' index (PMI) is the monthly survey traders watch for factory demand, and a reading under 50 signals contraction. The October 2026 reading was 49.3 (source: National Bureau of Statistics of China, PMI for October 2026). Silver has also fallen with factory metals in a crisis: from March to December 2008, copper's monthly average fell 63.6%, silver's 46.6% and gold's 15.7%, so a wider panic was at work too (source: World Bank Pink Sheet).
One clear miss came in 2025, when China's official PMI had been under 50 for seven straight months by that October (source: FXStreet, UOB Group on China's PMI). Silver's monthly average still rose 48.8% from March to October (source: World Bank Pink Sheet). Industrial demand fell 3.2% that year and solar demand fell 5.5%, as panel makers cut the silver they use per panel. Silver's average price still climbed 42%, while fund buying jumped from 67.5 million ounces to 278.1 million (source: World Silver Survey 2026). When investors arrive in that size, factory data can point the wrong way for a long time.
The US dollar and real yields
A stronger dollar and higher real yields usually go with a weaker silver price. Since 2006, silver has moved against the broad dollar index in about seven months out of 10 and against the 10-year real yield in about two out of three. That makes both useful background and unreliable signals for any single month (source: Federal Reserve H.10; US Treasury real yields).
The two links share a logic. Silver is quoted in dollars, which means a stronger dollar raises its cost for buyers paying in other currencies. It also pays no interest, so a higher real yield, the return on a Treasury bond after expected inflation, raises the cost of holding it. Gold works the same way, through its dollar index relationship and real interest rate link.
The big moves fit that logic well. From March 2009 to April 2011, the broad dollar index fell about 16% and silver's monthly average rose 226.0%. From June 2014 to December 2015, the dollar rose 20.2% and silver fell 29.1%. From March to October 2022, the 10-year real yield went from -0.72% to 1.59% and silver fell 23.3% (source: Federal Reserve H.10; US Treasury real yields; World Bank Pink Sheet).
The failures are just as easy to find. Across 238 overlapping 12-month windows since January 2007, silver and the dollar moved the same way in 68, or about 29%. In the year to January 2025, both rose. From March to October 2023, the real yield climbed by more than a full point, and silver still rose (source: Federal Reserve H.10; US Treasury real yields; World Bank Pink Sheet). The Silver Institute reports the same gap in the late 1990s, when a falling dollar failed to lift silver because investors were selling bars and coins (source: Silver Institute factors report).
Fed rate cuts and hikes
Silver's record across Fed cycles runs against the usual story. Across the six full Fed cycles since 2004, silver's monthly average ended higher in all three hiking cycles, by only 2.1% and 3.4% in the last two, and lower in two of the three cutting cycles (source: Federal Reserve, open market operations; World Bank Pink Sheet).
Fed cycle | Direction | Silver | Gold |
|---|---|---|---|
June 2004 to June 2006 | Hikes | +83.1% | +55.2% |
September 2007 to December 2008 | Cuts | -16.3% | +22.7% |
December 2015 to December 2018 | Hikes | +2.1% | +15.1% |
August 2019 to March 2020 | Cuts | -5.7% | +12.7% |
March 2022 to July 2023 | Hikes | +3.4% | +5.1% |
September 2024 to December 2025 | Cuts | +118.6% | +74.5% |
Each change runs from the month before the first move to the month of the last, on World Bank monthly averages (source: World Bank Pink Sheet). Dates are the Fed's effective dates, so the 2019 cycle's first cut, decided on July 31, is listed as August (source: Federal Reserve, open market operations). Three cycles of each is far too few to set a rule. The 2022 gain turns into a loss if the window starts or ends a month later, and the 2015 gain does if it starts a month earlier.
Endpoints matter in other ways too, because the 2008 and 2020 cutting cycles ended in market panics, with silver falling alongside stocks. In the 12 months after those last cuts, silver rose 70.9% and 71.8%. The gains in the 12 months after the last hikes were 21.3%, 15.5% and 22.6% (source: World Bank Pink Sheet). Silver's average 12-month change since mid-2004 was about 17%, with a median near 11%, so the gains after hikes are close to ordinary. The gains after the two cuts are far above that, but each starts at or close to a panic low, and the 2024 to 2025 cuts have no full year after them yet (source: World Bank Pink Sheet).
Silver is often said to respond to rates with a delay, and the monthly data gives that little support. Its correlation with the change in the real yield is -0.33 in the same month, -0.12 a month later and close to zero at two, three and six months (source: US Treasury real yields; World Bank Pink Sheet). Most of that link shows up in the same month, so a move in real yields that is already in the news is a weak reason to expect silver to catch up later. This tests the 10-year real yield only, not the Fed's own rate.
Rates have since turned back up: the Fed lifted its target range on September 16, 2026, to 3.75% to 4% (source: FOMC statement, September 16, 2026). It held the range on October 28, when two voters preferred another increase (source: FOMC statement, October 28, 2026). Those meetings and US inflation reports run on a published calendar, so silver positions around those dates can be planned ahead.
Oil and energy prices
Oil has the weakest steady link with silver among the commodities tested, with a correlation of 0.26 since 2006 and just 0.06 over the five years to October 2026 (source: World Bank Pink Sheet). High oil can raise inflation fears, which sounds good for a metal, but it can also raise rate fears, which works against it.
The 1970s are a poor test of the first effect. Silver's 527.4% rise from January 1979 to January 1980, against 122.9% for crude's monthly average during the oil shock, says little about oil, because that peak came during the Hunt brothers' attempt to corner the market (source: World Bank Pink Sheet). The Silver Institute also says other factors lay behind that peak (source: Silver Institute factors report). Silver far outran gold in those months, when gold rose 197.4% as part of its record during stagflation. Oil and silver also fell together from June 2014 to January 2016, with oil down 72.5% and silver down 29.1% (source: World Bank Pink Sheet).
Oil and silver also parted from December 2021 to June 2022, with oil up 60.2% and silver down 4.0%, which is consistent with the second effect without proving it. The 2026 result depends heavily on the start date. From February, the last monthly average before oil's March jump, to October, oil rose 59.6% while silver fell 30.4%, but February's silver average was still high after January's record. From December 2025 silver's fall is 8.5%, and from October 2025 it shows a 15.4% rise while oil gained 72.2% (source: World Bank Pink Sheet). The Silver Institute, writing in April, described the market as focused on an inflationary oil shock, a stronger dollar and fading hopes of Fed easing (source: World Silver Survey 2026). Oil was only part of that fall, whose dated steps are in BloFin Academy's guide to why silver is going down.
Is silver a safe haven?
Silver has been a poor safe haven in the sharpest stock-market falls. In the 12 months since 1971 when the S&P 500's monthly average fell most, silver rose in three, fell in seven and showed no change in two at the World Bank's 10-cent rounding. Gold rose in six of those months (source: World Bank Pink Sheet; Yahoo Finance S&P 500).
Silver lost an average of 5.6% in those 12 months, and gold lost 0.3%. Without March 1980, silver's average is -3.4% and gold's is +1.2% (source: World Bank Pink Sheet). The list includes October and November 2008 and March 2020. Across the wider 2008 slide, from March to November, silver's monthly average fell 48.7% and gold's fell 21.4% (source: World Bank Pink Sheet). In early 2020, the SLV fund fell 35.6% between its closes on February 24 and March 18, while the GLD fund fell 12.5% between March 9 and March 19 (source: Nasdaq SLV prices; Nasdaq GLD prices). The Silver Institute ties that 2020 slump to the early hit on commodity demand (source: Silver Institute factors report).
The exceptions are real, though. Silver's monthly average gained 4.8% in September 2001 and 6.3% in August 2011, both months when the S&P 500's monthly average fell more than 10%. The rebounds have also been larger than gold's. Silver's monthly average rose 331.3% from November 2008 to April 2011, against 94.6% for gold (source: World Bank Pink Sheet; Yahoo Finance S&P 500). From SLV's low on March 18 to the end of 2020, SLV gained 119.2% and GLD 26.8% (source: Nasdaq SLV prices; Nasdaq GLD prices). So silver has tended to fall with the panic and rise with the recovery, which is a different job from protecting a portfolio during the fall.
Positioning and squeezes in silver futures
Positioning means who holds which side of the silver futures market, and forced exits can deepen a move: the Silver Institute says the closing of "substantial leveraged positions" made silver's early-2026 decline worse (source: World Silver Survey 2026). The Commodity Futures Trading Commission's weekly Commitments of Traders report splits open interest, the number of futures contracts still open, into groups such as managed money, and traders read positioning from that split (source: CFTC, Commitments of Traders).
A squeeze is the extreme case, when traders who are short have to buy back while metal or liquidity is scarce. The Silver Institute uses that word for two recent episodes. It mentions a "Reddit-driven squeeze" in early 2021, without saying how shorts fared (source: World Silver Survey 2026). SLV rose 13.2% from January 26 to February 1 that year, then fell 15.2% by March 31 (source: Nasdaq SLV prices). It also describes a liquidity squeeze in October 2025, set off by strong Indian demand, as shorts had to cover in a London market short of metal (source: World Silver Survey 2026).
Both moves gave back ground within weeks. After rising 16.0% from September 30 to October 16, 2025, SLV fell 13.2% by October 28, then gained 50.9% by the end of December (source: Nasdaq SLV prices). A squeeze can tell you how tight the market is at that moment, while saying little about where the price goes months later.
On a perpetual, funding shows which side is paying to stay in. The XAGUSDT Perpetual page shows the current rate, so you can check it before you pick a side.
Commodity index rebalancing each January
Commodity index rebalancing is a yearly reset that can force index funds to buy or sell silver futures whatever the news. Bloomberg raised silver's target weight to 4.56% for 2027, from 3.94% for 2026, effective in the January 2027 roll period, the days when those funds move their positions to the new weights (source: Bloomberg 2027 weights).
The Bloomberg Commodity Index, or BCOM, sets those weights from liquidity (two-thirds) and world production (one-third), with no single commodity above 15% (source: Bloomberg 2027 weights). Over a year, a metal that outruns the others grows past its target. Funds tracking the index then sell futures in the roll window to get back to it (source: Deep News on JPMorgan). They buy when a metal sits below target: a JPMorgan note reported by Deep News expected buying in lead for January 2026 (source: Deep News on JPMorgan). So a higher 2027 target does not by itself mean buying. The direction depends on whether silver's share of the index is above or below that target on the fourth business day of January, when Bloomberg fixes the contract amounts for the year (source: Bloomberg index methodology).
January 2026 is one case. After silver's 2025 surge, Deep News, citing market sources, reported that the JPMorgan note expected selling equal to about 9% of silver futures open interest in the BCOM roll. It dated the windows of BCOM and the S&P GSCI, another commodity index, together as January 8 to 15 (source: Deep News on JPMorgan). Saxo cited estimates of roughly low-double-digit percentages of COMEX open interest and about $6 billion to $7 billion in each metal (source: Saxo, index rebalancing, January 2026).
Silver fell first: Saxo reported two-day declines of around 8% by January 8, and SLV closed at $73.71 on January 6 and $69.71 on January 8. It then rose, reaching $84.56 on January 14, up 19.2% from the January 7 close of $70.96, and closed at $83.32 on January 15, up 17.4% (source: Saxo, index rebalancing, January 2026; Nasdaq SLV prices). The Silver Institute credits that month's rally largely to physical buying, along with flows into funds and retail futures and options (source: World Silver Survey 2026). One January cannot show how much the selling mattered, because those figures are forecasts of the flow rather than a count of what was sold. The same Deep News report says similar sales failed to disrupt gains in January 2025.
Mine supply, deficits and inventories
Supply moves silver slowly, because mine output has moved up or down by about 2.6% a year on average since 2017, and by 5.6% at most (source: World Silver Survey 2026). Most silver is also mined as a by-product of other metals (source: Silver Institute factors report). A yearly deficit, when demand exceeds supply, gets the headlines, yet 2022's largest recent deficit came with a falling yearly average price, in a year funds sold 117.4 million ounces. With fund flows counted, 2025 has the widest gap, 318.4 million ounces, and the price rose 41.6% (source: World Silver Survey 2026).
The Silver Institute puts the 2022 deficit at 254.0 million ounces, the widest in its table running from 2017 (source: World Silver Survey 2026). The average London price in the same table fell 13.6% that year, from $25.14 to $21.73, yet it rose in the other four deficit years from 2021 to 2025. The Silver Institute says that for several years the stocks above ground, though falling, were large enough to keep the market supplied, so a shortfall does not by itself force buyers to pay more (source: World Silver Survey 2026).
Those stocks are where supply can matter fast. In 2025, tariff-related outflows, investment demand and earlier deficits cut London inventories outside the funds to a record reported low of 136 million ounces by the end of September. That thin stock helped set up October's squeeze (source: World Silver Survey 2026). BloFin Academy's guide to silver inventories at COMEX and the London Bullion Market Association (LBMA) covers what those stocks signal, and a thin stock can leave the market more exposed to any of these drivers.
Does silver have a seasonal pattern?
Silver has at most a weak seasonal pattern. January shows the highest average gain since 1971, at 3.78% on monthly averages, but two extreme Januaries supply much of that figure, and calendar months explain only about 2.6% of the variation in silver's monthly moves (source: World Bank Pink Sheet).
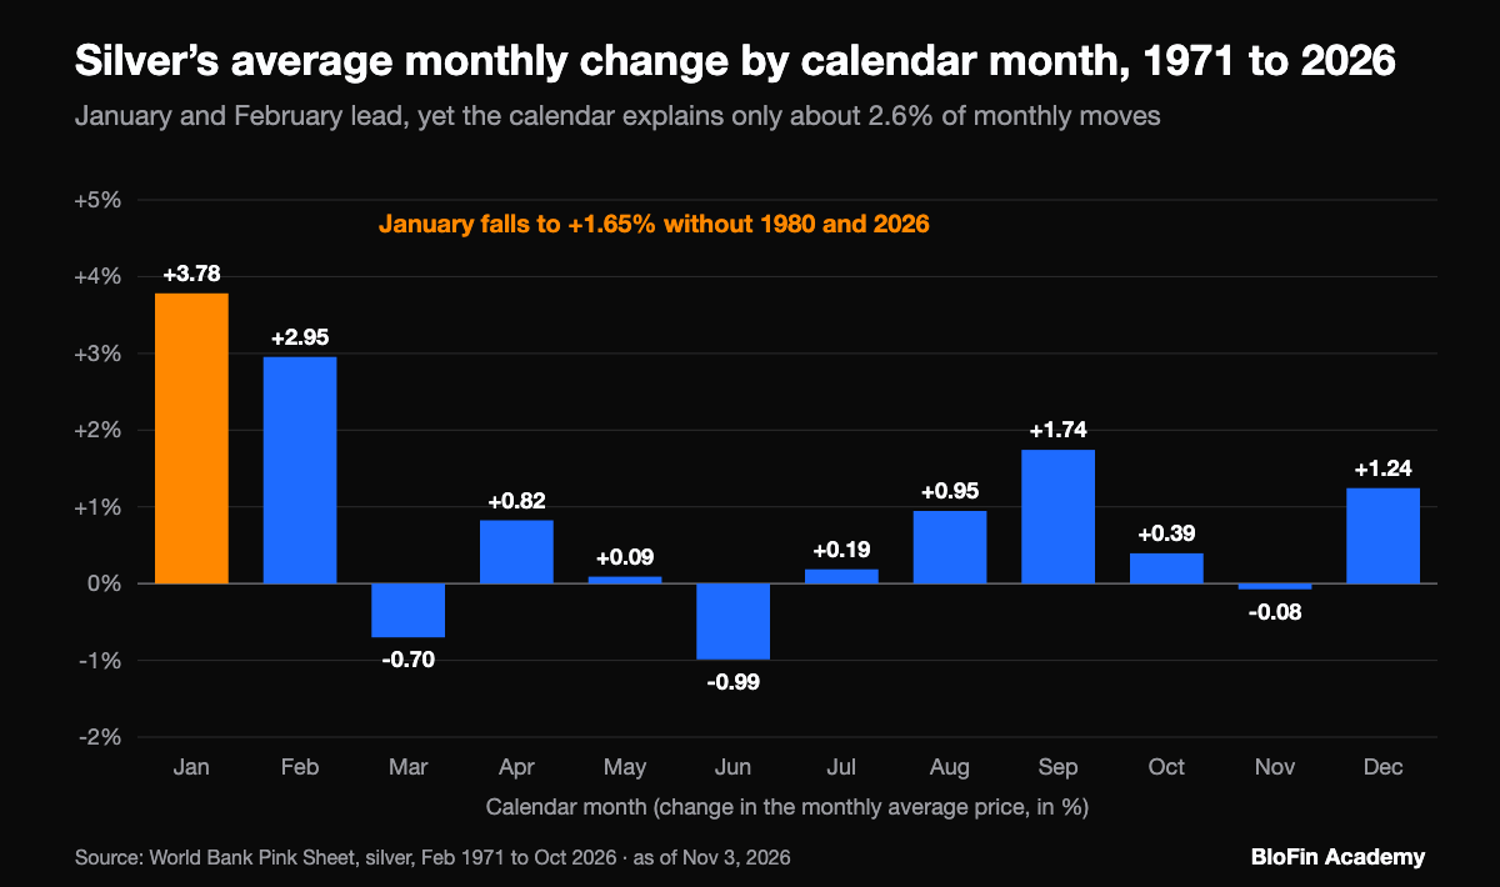
Take out January 1980 and January 2026, up 72.9% and 47.8%, and January's average falls to 1.65%. Its median is about 1.7%, and it rose in 32 of the 46 Januaries when the average price changed, about 70%, against about 51% for all months. January and February were the top two months in both halves of the record, 1971 to 1998 and 1999 to 2026. Without January 1980, though, the first half's leaders are February, September and December, so any early-year tilt is mild and rests on few months (source: World Bank Pink Sheet).
Twelve months give chance twelve opportunities to produce a winner, though. When the same returns were shuffled at random across the calendar 5,000 times, a best month that high appeared about 7% of the time, so January's lead is hard to separate from luck. A different measure also gives a different answer: across a decade of SLV month-end closes, the best average month was December at 5.4%, with January third at 3.6% and February slightly negative (source: Nasdaq SLV prices).
A festival-season lift from India fares no better. The Silver Institute does name strong Indian demand as the trigger in October 2025 (source: World Silver Survey 2026). Across the whole record, though, October rose in 23 of 46 months with a change and September in 22 of 49, which is no better than a coin toss (source: World Bank Pink Sheet). A calendar is a weak reason to enter a silver trade.
How silver price drivers affect a perpetual trade
The XAGUSDT Perpetual responds to the same drivers through its mark price, which follows an index price for silver. BloFin uses the mark price to value positions and trigger liquidation, so a driver that moves silver sharply affects your margin straight away, and funding every four hours adds a running cost or income.
Funding payments settle every four hours from 12AM UTC. Longs pay shorts when the rate is above zero, and shorts pay longs when it is below. Between the January 8, 2026 listing and November 5, 2026, 271 of 1,805 settlements were negative, about 15% (source: BloFin, XAG funding history). Past funding is no forecast of future funding. A high rate tells you longs are paying more to stay in. It does not tell you which way silver goes next.
Position size matters more than any view on a driver, because silver often moves a lot in a day. SLV moved 3% or more on 254 of 2,512 trading days in the decade to November 3, 2026, about one day in 10. Those days cluster: it was 5.6% of days through 2020 and 36.0% of days in 2026 so far, and 22% over the last three months (source: Nasdaq SLV prices). At 10x, a 10% move against you roughly equals your whole margin, and position liquidation, which is triggered on the mark price, comes before that point because a position must also keep a maintenance margin. Before you send an order, the order panel gives an estimated Liq. Price for that trade.
Looking to trade silver? To get started, you'll need to first create a BloFin account, fund your account with cryptocurrency, and navigate to the XAGUSDT Perpetual trading page.
Frequently asked questions
Does inflation make silver go up?
It has at times, and the record is uneven. Silver tripled in the first big US inflation episode of the 1970s and soared in the second. The Silver Institute says the most recent wave had far less effect, with most of the gains coming before inflation surged (source: Silver Institute factors report). Silver's record as an inflation hedge therefore depends on which episode you test.
Can you predict the silver price?
Its drivers explain some of its past moves and much less of its future ones. The Silver Institute calls silver's price neither a random walk nor entirely predictable from past trends, and in its regression, gold's price changes alone explain just under half of silver's (source: Silver Institute factors report). Published bank forecasts for silver rest on assumptions about these same forces.
Does India's demand affect the silver price?
It can, because India buys so much and imports most of it. India took 54% of world jewelry and silverware demand in 2022 and imported 232.2 million ounces in 2025, and the rupee affects what those buyers pay (source: Silver Institute factors report) (source: World Silver Survey 2026). High prices can also cut that buying, as they did in 2025, when India led the fall in jewelry fabrication (source: World Silver Survey 2026).
Do tariffs move the silver price?
They can move metal first and price second, because fear of US tariffs drew silver out of London and into US vaults in 2025, which tightened supply elsewhere (source: World Silver Survey 2026). Yet after the April 2, 2025 tariff announcement, investors sold assets including silver to meet margin calls, so the same policy pushed in two directions within one year (source: World Silver Survey 2026).
Does war push the silver price up?
It may lift silver briefly, and the boost can fade fast. The Silver Institute says the war in Iran gave silver only a brief safe-haven lift at first in 2026, and that the war had weighed on the price by the time of its April report (source: World Silver Survey 2026).
Researched and written by the BloFin Academy editorial team with AI-assisted drafting. All facts independently verified. Primary sources include the World Bank, the Silver Institute, the Federal Reserve, the US Treasury, the National Bureau of Statistics of China, the CFTC, Bloomberg, Nasdaq, the World Gold Council and BloFin's XAG contract and funding data, current as of November 5, 2026.
Nothing in this article constitutes financial advice, and nothing in it is a recommendation to buy, sell or hold silver in any form. Every link described here has failed for months or years at a time, so a trade built on one driver can lose money even when that driver moves the way you expected. On the XAGUSDT Perpetual, a sharp move can liquidate a leveraged position and funding can cost a long or short every four hours. Past performance does not indicate future results. Do your own research and consider your risk tolerance before you trade on BloFin.