
Every big move in silver brings a fresh round of price forecasts from banks, consultancies and polls of analysts. Those numbers travel fast once they leave the original note, and a headline rarely keeps the detail that gave the number its meaning.
That detail decides how much a forecast can tell you. One figure may be an average for a whole year, another a level for the last day of December, and a third a best case that depends on something else happening first. Many were also set when silver traded at a very different price, then repeated for months as if they were new.
Reading a silver price prediction well means lining up the bank forecasts by date, by the kind of figure each one is and by what it assumes. The calls that missed belong beside them, because they show how far a careful forecast can drift within a few months.
BloFin sets no silver price target of its own. Silver trades there as the XAGUSDT Perpetual, which settles in USDT, and its dated price gives you a starting point for measuring how far each forecast sits from the market.
What is a silver price prediction?
A silver price prediction is a forecast of silver's dollar price per ounce at a future date or over a future period, published by a bank, a consultancy or a poll of analysts. A Reuters poll of October 27, 2026 put the 2026 average at $70.30 and the 2027 average at $66.75 (source: Reuters poll via WHTC, October 27, 2026).
The poll's gold forecast drew on 30 analysts and traders, and it gave silver's price as $53 when it was published (source: Reuters poll via WHTC, October 27, 2026). Silver has swung since. The XAGUSDT Perpetual started the 24 hours to 2.52AM UTC on November 5, 2026 at 49.41 USDT and last traded at 53.41 USDT, up 8.1%. Every forecast named here came before that jump, and the reasons silver is going up now are a dated story of their own.
Any gap measured from 53.41 USDT is approximate. The contract is quoted in USDT and follows its own index, so its price can differ a little from the dollar spot price.
Forecasters publish five kinds of figure, and each makes a different promise:
Period average. The mean price across a year or quarter, such as J.P. Morgan's $63 for the fourth quarter of 2026 (source: JPMorgan Global Research). Silver can spend weeks away from this number and the forecast can still come true.
Period-end target. The price on or near one date, such as Commerzbank's $67 for the end of 2026, set in July (source: FXStreet, Commerzbank, July 28, 2026).
Window target. A level expected within a stretch of time, such as Citi's "zero to three months" (source: Yahoo Finance, Citi).
Conditional call. A level that depends on something else, such as the view from Bank of America that a rally in gold could lift silver above $100 (source: Kitco, Bank of America, May 27, 2026).
Consensus. An average or median of many views, such as the Reuters poll or the London Bullion Market Association (LBMA) survey.
Averaging these together would mix answers to different questions.
Silver price forecast for 2026
Silver price forecasts for 2026, taken from one recent report by each of eight named sources, dated May to October, start at a $63 fourth-quarter average (source: JPMorgan Global Research) and reach a $75 yearly average (source: Investing.com, HSBC, May 14, 2026). One conditional call goes above $100 (source: Kitco, Bank of America, May 27, 2026). The newest is the Reuters poll's $70.30 (source: Reuters poll via WHTC, October 27, 2026). All sit above silver's BloFin perpetual at 53.41 USDT on November 5, 2026.
World Bank monthly averages show how much silver has moved since each report, and all of these reports are older than the rally of early November (source: World Bank Pink Sheet, November 2026).
Forecaster | Date reported | Figure | What the figure is | Source | Average price that month |
|---|---|---|---|---|---|
HSBC | May 14, 2026 | $75 and $70 | 2026 average, and end of 2026 | (source: Investing.com, HSBC, May 14, 2026) | $78.00 |
Bank of America | May 27, 2026 | Above $100 | Possible in the fourth quarter if gold rallies; the bank does not expect it to last | (source: Kitco, Bank of America, May 27, 2026) | $78.00 |
Commerzbank | July 28, 2026 | $67 | End of 2026 | (source: FXStreet, Commerzbank, July 28, 2026) | $58.80 |
J.P. Morgan | August 13, 2026 | $63 and $70.60 | Fourth-quarter average, and 2026 average | (source: JPMorgan Global Research) | $65.40 |
Citi | August 14, 2026 | $75 | Zero to three months, so to about mid-November | (source: Yahoo Finance, Citi) | $65.40 |
UBS | September 27, 2026 | $70 | By December 2026 | $64.60 | |
Metals Focus | October 19, 2026 | $72.60 | 2026 average | (source: Kitco, Metals Focus, October 19, 2026) | $57.00 |
Reuters poll | October 27, 2026 | $70.30 | 2026 average | (source: Reuters poll via WHTC, October 27, 2026) | $57.00 |
From 53.41 USDT, Commerzbank's July figure of $67 sits 25.4% higher, and the $70 from HSBC and UBS sits 31.1% higher. Citi's $75 is 40.4% higher.
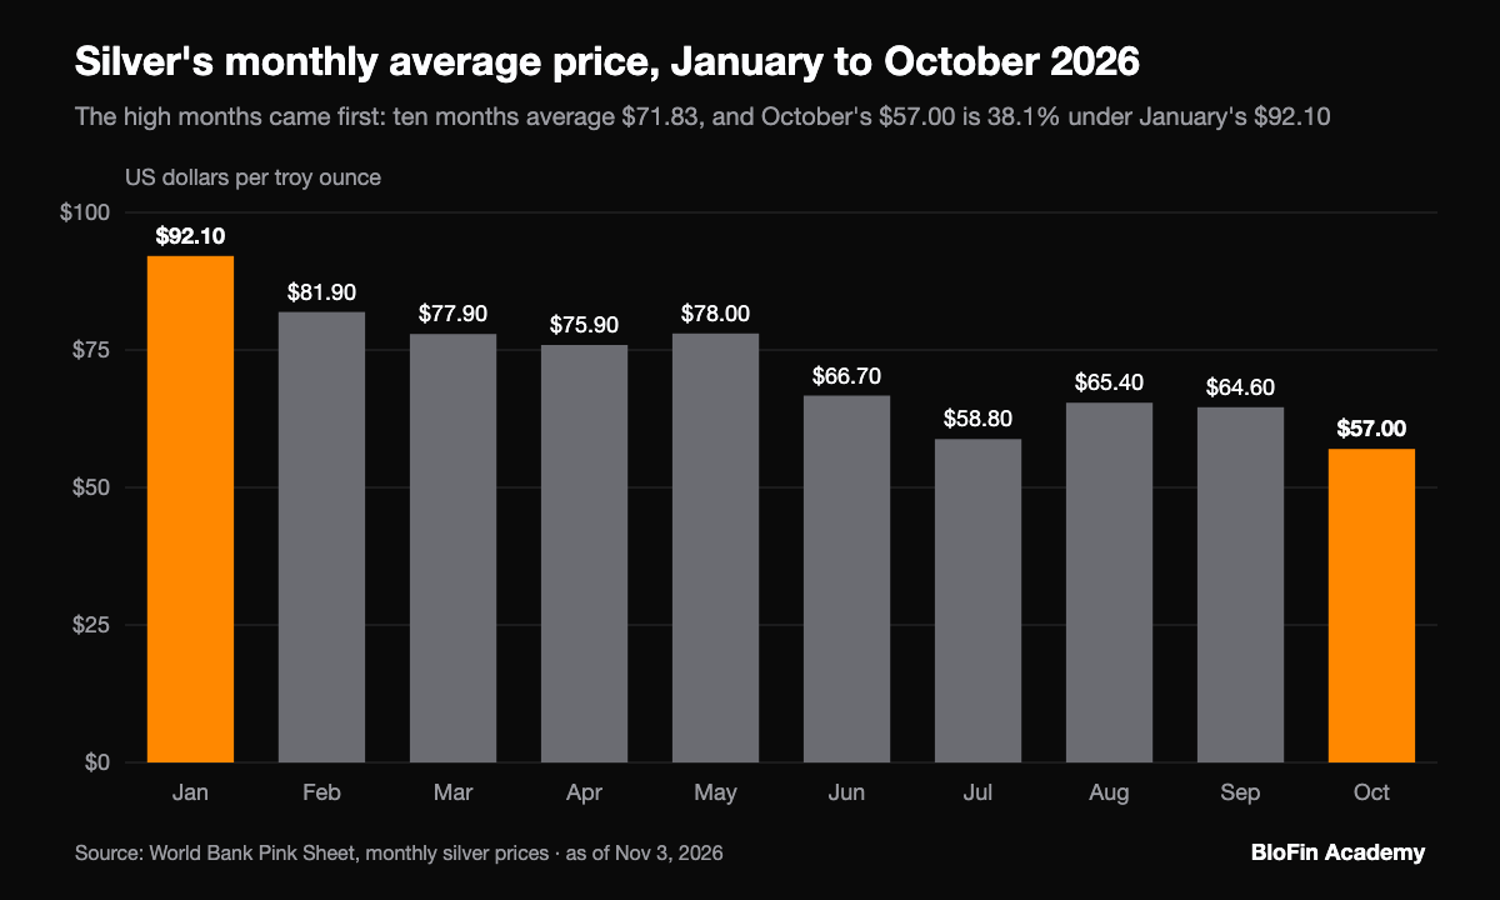
What the 2026 yearly averages now need
Ten months of 2026 have passed, so a forecast for the year's average has become mostly arithmetic. Monthly averages from the World Bank for January to October add up to $718.30, which works out at $71.83 a month, and the high months came first (source: World Bank Pink Sheet, November 2026). January averaged $92.10 and October $57.00, a fall of 38.1%.
Weight each month equally, and each yearly forecast tells you what the last two months must average. Here is that sum for five of the yearly figures:
Forecast for the 2026 average | Figure | November and December must average |
|---|---|---|
Reuters poll, October 27 | $70.30 | $62.65 |
J.P. Morgan, August 13 | $70.60 | $64.45 |
Metals Focus, October 19 | $72.60 | $76.45 |
HSBC, May 14 | $75.00 | $90.85 |
LBMA analyst survey, January | $79.57 | $118.27 |
If November and December averaged 53.41 instead, the year would finish at about $68.76, under all five. That sum predicts nothing about the next eight weeks, and each forecaster may measure a slightly different price series. It does show how far each number now sits from the market: the Reuters poll needs an average about 17.3% over 53.41 for two months, and the January survey would need about $118.
Silver price prediction for 2027
Silver price predictions for 2027 run from J.P. Morgan's $63.90 yearly average (source: JPMorgan Global Research) to $94.70 from delegates at an LBMA conference, whose view covers the next 12 months (source: Kitco, LBMA delegate survey). The Reuters poll's $66.75 sits near the low end (source: Reuters poll via WHTC, October 27, 2026), and every figure here is higher than that 53.41 USDT.
World Bank monthly averages again show the price backdrop of each report, and every one of these reports predates the rally of early November (source: World Bank Pink Sheet, November 2026).
Forecaster | Date reported | Figure | What the figure is | Source | Average price that month |
|---|---|---|---|---|---|
HSBC | May 14, 2026 | $68 and $65 | 2027 average, and end of 2027 | (source: Investing.com, HSBC, May 14, 2026) | $78.00 |
Bank of America | May 27, 2026 | About $75 | Trading level by the second quarter of 2027 | (source: Kitco, Bank of America, May 27, 2026) | $78.00 |
Commerzbank | July 28, 2026 | $80 | End of 2027 | (source: FXStreet, Commerzbank, July 28, 2026) | $58.80 |
J.P. Morgan | August 13, 2026 | $63.90 | 2027 average in its table; its text says $63 | (source: JPMorgan Global Research) | $65.40 |
Citi | August 14, 2026 | $90 | Six to 12 months | (source: Yahoo Finance, Citi) | $65.40 |
UBS | September 27, 2026 | $75 and $80 | March and June 2027, then September 2027 | (source: Yahoo Finance UK, UBS, September 27, 2026) | $64.60 |
LBMA conference delegates | October 6, 2026 | $94.70 | Next 12 months | (source: Kitco, LBMA delegate survey) | $57.00 |
Deutsche Bank | October 7, 2026 | About $70 | Average in the second quarter of 2027 | $57.00 | |
Metals Focus | October 19, 2026 | $84.40 and above $90 | 2027 average, and the fourth quarter of 2027 | (source: Kitco, Metals Focus, October 19, 2026) | $57.00 |
WisdomTree | October 22, 2026 | Toward $70 | By the third quarter of 2027; its model gives $70.55 | (source: WisdomTree, October 22, 2026) | $57.00 |
Reuters poll | October 27, 2026 | $66.75 | 2027 average | (source: Reuters poll via WHTC, October 27, 2026) | $57.00 |
Yearly averages alone stretch from J.P. Morgan's $63.90 to the $84.40 from Metals Focus on October 19, which is 19.6% to 58.0% over 53.41 USDT. The Reuters figure is 25.0% over, and UBS's $80 for September 2027 is 49.8% over. The delegates' $94.70 is a survey of people at an industry conference, so it reads differently from one bank's research (source: Kitco, LBMA delegate survey).
To measure any of these targets yourself, take the live mark price from the XAGUSDT Perpetual page and work out the percentage gap.
Bull, base and bear cases for silver
Bull, base and bear labels for silver appear in some reports. UBS called a sideways path its base case in April 2026 (source: Investing.com, UBS), and TheStreet's writers used "bull case" for Citi (source: Yahoo Finance, Citi). Ranked by 2027 figure, which mixes averages with level targets, the higher calls rest on investment buying and gold, and the lower ones on weak solar demand.
These three groups are BloFin Academy's own sort, not the forecasters' categories.
- The high group: $84 to $95. Citi's $90 assumes tension around the Strait of Hormuz eases, a less hawkish Federal Reserve brings lower yields and a weaker dollar, and investment demand makes up for softer industry (source: Yahoo Finance, Citi). Metals Focus's $84.40 of October 19 comes with a condition, saying a sustained rally would probably need stronger inflows into silver-backed funds (source: Kitco, Metals Focus, October 19, 2026).
- The middle group: $70 to $80. UBS leans on higher gold prices and calls silver a higher-beta version of gold, meaning it tends to move further than gold in the same direction. UBS sees data centers, power grids and electric cars offsetting some of the fall in silver per solar panel (source: Yahoo Finance UK, UBS, September 27, 2026). WisdomTree's October 22 outlook also treats higher gold as the main driver, with gold approaching $4,800 and silver moving toward $70 by the third quarter of 2027. Its model gives $70.55, and it expects industrial weakness to limit the upside (source: WisdomTree, October 22, 2026).
- The low group: $63 to $68. J.P. Morgan points to the unwinding of tight physical markets, a possible fall of about 30% in solar demand this year, weaker Indian imports after a duty rise, and a rate hike (source: JPMorgan Global Research). In the Reuters poll, analysts cite weakening solar demand, and StoneX's Rhona O'Connell says the big reversal in fund holdings has left the market oversupplied (source: Reuters poll via WHTC, October 27, 2026).
Two things stand out when you compare the groups. Even the low group's price figures sit above the price of November 5. Some still expect a fall: on October 29, Metals Focus saw further downside risks in the near term from higher rates and bond yields (source: Kitco, Metals Focus, October 29, 2026). The gap reflects when these calls were made as much as what they expect, since most came when silver cost more. A lower view is older and has already failed. In January, TD Securities' Bart Melek gave a $44.25 average for 2026 with a $42 low, and January to October alone put the year out of reach of that average (source: LBMA 2026 forecast survey).
Supply views also separate the high calls from the low ones less than headlines suggest. On October 19, Metals Focus expected a deficit in 2026 to turn into a surplus in 2027 and still forecast a higher average price, on the condition that investors return (source: Kitco, Metals Focus, October 19, 2026).
Can silver reach $100 again?
Silver would need to rise 87.2% from the XAGUSDT Perpetual's 53.41 USDT on November 5, 2026 to reach $100 an ounce. It has traded there before, with spot silver setting a record of $121.64 in January 2026 (source: Reuters via BNN Bloomberg, February 2, 2026). None of these 2027 figures reaches $100, and the one 2026 call that does, from May 27, is conditional.
Silver rose above $100 for the first time on January 23, 2026 (source: Reuters via BNN Bloomberg, January 23, 2026), and it was back at $83.73 by February 2 (source: Reuters via BNN Bloomberg, February 2, 2026). So that first stay above $100 lasted days, and no month has averaged that much: January 2026's $92.10 is the highest monthly figure in the World Bank series (source: World Bank Pink Sheet, November 2026). From the $121.64 spot record to the perpetual's 53.41 is a fall of about 56%, and a return would take a rise of about 128%.
The gold/silver ratio, which is gold's price divided by silver's, offers one test. BloFin's gold and silver perpetuals had mark prices of 4,142.08 USDT and 53.38 USDT at 2.52AM UTC on November 5, 2026, which gives a ratio of about 77.6. With gold unchanged, $100 silver would mean a ratio of about 41.4, and on monthly averages from the World Bank it last stood lower than that in May 2011 (source: World Bank Pink Sheet, November 2026).
Silver could also get there with gold's help, which is the route Bank of America described in May. It said a gold rally could lift silver above $100, and added that it did not see silver outpacing gold on a sustained basis (source: Kitco, Bank of America, May 27, 2026). J.P. Morgan expects the ratio to stay far from 41.4, at around 75 over 2027 (source: JPMorgan Global Research). UBS's view points the other way, with limited scope for a sustained rise above 70, a level the ratio has since passed at about 77.6 (source: Yahoo Finance UK, UBS, September 27, 2026).
Silver forecasts that missed
Silver forecasts have missed in both directions within two years, and the direction followed the price: calls made before the 2025 run came in too low, and calls made during 2026 have mostly come in too high. Across 2010 to 2025, the LBMA's January average was too high in 10 years and too low in 6, and off by 11.1% on average (source: LBMA 2010-2026 performance). The January 2025 LBMA survey averaged $32.86 for a year that averaged $40.03 (source: LBMA 2025 forecast survey; LBMA 2026 forecast survey), and Citi's January 2026 call for $150 within three months overshot silver's record by $28.36 (source: Yahoo Finance, Citi). A fair score compares the same kind of price on both sides.
Each comparison sets a call against the closest measure of the same kind. For 2026 averages, which are not finished, the table shows January to October and, in brackets, the $68.76 the year would reach if November and December averaged 53.41.
Forecaster and date | The call | Compared with | Result | Source |
|---|---|---|---|---|
LBMA analyst survey, January 2025 | $32.86, 2025 average | $40.03, the LBMA's 2025 average | $7.17 too low | (source: LBMA 2025 forecast survey; LBMA 2026 forecast survey) |
Reuters poll, October 2025 | $50, 2026 average | 71.83,JanuarytoOctober(68.76 on the full-year sum) | 21.83toolow(18.76) | (source: Reuters poll via Profit) |
Metals Focus, October 2025 | $60 rally target for 2026 | $121.64, spot record | $61.64 too low | (source: Kitco, Metals Focus 2025 outlook) |
Metals Focus, October 2025 | $57, 2026 average | 71.83,JanuarytoOctober(68.76 on the full-year sum) | 14.83toolow(11.76) | (source: Kitco, Metals Focus 2025 outlook) |
LBMA conference delegates, October 2025 | $59.10 in 12 months | About $61 spot, early October 2026 | About $2 too low | (source: Kitco, LBMA delegate survey; CarbonCredits, Deutsche Bank, October 7, 2026) |
LBMA analyst survey, January 2026 | $79.57, 2026 average | 71.83,JanuarytoOctober(68.76 on the full-year sum) | 7.74toohigh(10.81) | (source: LBMA 2026 forecast survey) |
TD Securities' Bart Melek, January 2026 | $44.25, 2026 average | 71.83,JanuarytoOctober(68.76 on the full-year sum) | 27.58toolow(24.51) | (source: LBMA 2026 forecast survey) |
Citi, late January 2026 | $150 in zero to three months | $121.64, spot record | $28.36 too high | (source: Yahoo Finance, Citi) |
Reuters poll, February 2026 | $79.50, 2026 average | 71.83,JanuarytoOctober(68.76 on the full-year sum) | 7.67toohigh(10.74) | (source: Reuters poll via Profit) |
UBS, April 30, 2026 | $85 for June 2026 | $66.70, June's monthly average | $18.30 too high | (source: Investing.com, UBS) |
UBS, April 30, 2026 | $85 for September 2026 | $64.60, September's monthly average | $20.40 too high | (source: Investing.com, UBS) |
J.P. Morgan, May 2026 | $85.00, third-quarter average | $62.93, third-quarter average | $22.07 too high | (source: JPMorgan Global Research) |
J.P. Morgan, May 2026 | $84.30, 2026 average | 71.83,JanuarytoOctober(68.76 on the full-year sum) | 12.47toohigh(15.54) | (source: JPMorgan Global Research) |
HSBC, May 14, 2026 | $75, 2026 average | 71.83,JanuarytoOctober(68.76 on the full-year sum) | 3.17toohigh(6.24) | (source: Investing.com, HSBC, May 14, 2026) |
J.P. Morgan, August 13, 2026 | $62.50, third-quarter average | $62.93, third-quarter average | $0.43 too low | (source: JPMorgan Global Research) |
The $71.83 and the June, third-quarter and September averages come from the monthly series published by the World Bank (source: World Bank Pink Sheet, November 2026).
Two calls came close, and neither is as impressive as it looks. The delegates' 2025 call ended within about $2 of the mark, yet silver went to more than twice $59.10 along the way and had fallen back below $59.10 by late October. A leveraged position on that view had to survive the whole trip. J.P. Morgan's August figure for the third quarter was published halfway through that quarter, when part of the answer was already known.
One call did land, with a short way to go. LBMA forecasters submitted around January 12 with silver at $84.07, and seventeen of the 26 had a high of $100 or more. Spot silver passed $100 on January 23, though only four of the 26 had a high at or above the $121.64 record (source: LBMA 2026 forecast survey; Reuters via BNN Bloomberg, January 23, 2026).
Why silver forecasts keep changing
Silver forecasts change because their inputs change and because the price they start from keeps moving. January's analysts expected lower real rates, and by October Reuters was reporting that the Iran war had driven oil and Treasury yields higher (source: LBMA 2026 forecast survey; Reuters poll via WHTC, October 27, 2026). J.P. Morgan cut its 2026 yearly average from $84.30 in May to $70.60 in August, citing the unwind of tight physical markets (source: JPMorgan Global Research). The Reuters poll for 2026 went from $50 to $79.50 to $70.30 inside twelve months (source: Reuters poll via Profit; Reuters poll via WHTC, October 27, 2026).
The same pattern runs through individual banks. UBS's December 2026 target was $85, then $80 on April 30 (source: Investing.com, UBS), and $70 by September (source: Yahoo Finance UK, UBS, September 27, 2026). Commerzbank's end-2026 figure fell from $80 to $67 in July (source: FXStreet, Commerzbank, July 28, 2026). J.P. Morgan's 2027 average dropped 25.5%, from $85.80 to $63.90, in a single update (source: JPMorgan Global Research).
Citi moved the furthest. Its short-term target went to $150 in late January, stood at $60 by June, and was then raised to $70 and $75 (source: Yahoo Finance, Citi). Its three-month window is a short horizon, so frequent changes are built into it, and a reader who saw only the January headline would have had a very wrong idea of the bank's later view.
One figure ran against the price. HSBC raised its 2026 and 2027 averages in May and still set an end-2026 target of $70 while silver traded above $86 (source: Investing.com, HSBC, May 14, 2026). That made it one of the few calls here set under the market at the time, and silver now trades under that target too.
How to read a silver price forecast
You can read a silver price forecast in under a minute by asking who made it, when, what kind of figure it is, how long it runs and what it assumes. A number that cannot answer those questions tells you little, however confident the page that carries it sounds.
Who made it. Look for a named institution or a named poll. If a page lists a price for every future month and names nobody, ask what model produced it and how the model has done before. The named forecasts here stop at 2027, so when a page shows 2030 or 2040, ask whether that number is a model's output or an assumed yearly return compounded forward.
When it was made. Compare the date with silver's price that month. A target set when silver averaged $78 and one set when it averaged $57 are answers to different markets.
What kind of figure it is. Yearly average, quarter average, period end or peak each need a different check.
How long it runs. A window target expires. Citi repeated its $75 in mid-August for the next three months, so that call runs out in mid-November.
What it assumes. Most calls depend on gold, interest rates, solar demand or fund flows. If an assumption has already failed, the number is on weak ground before its date arrives.
Which price it means. Spot, COMEX futures, the LBMA benchmark and the XAGUSDT Perpetual can differ at any moment, so compare a forecast with the series it was built on when the source says which one that is.
Whether a newer call exists. Check the publisher before you quote it. Reuters polls come about every three months and can replace these figures (source: Reuters poll via WHTC, October 27, 2026).
Funding and leverage while you wait for a silver target
A silver forecast gives you a view, and it leaves out your entry, your stop-loss order and your position size. On the XAGUSDT Perpetual, a long position waiting for a 2027 target pays funding when the rate is positive. Leverage can also close it long before that date, so time and the route matter as much as the number.
On BloFin, funding payments move from long positions to short positions when the rate is positive, and the other way round when it is negative. The XAGUSDT Perpetual settles it every four hours, starting at 12AM UTC. On a fixed position value, BloFin's funding history sums to 6.28% over the 90 days to 12AM UTC on November 5, 2026 and 15.01% over the 180 days to the same time. Those windows include 85 and 162 negative settlements. Since listing on January 8, 2026, the sum is 38.88%, with 271 of 1,805 settlements negative (source: BloFin XAG funding history).
Those sums matter when you set them beside a target a year away. A full year at the 90-day pace comes to about 25.5% of position value, and at the 180-day pace about 30.4%, so either pace would match or pass the 25.0% gap to the Reuters poll's 2027 average. Past funding is no forecast, and the rate changes every four hours, but a long-dated call on a perpetual has a running cost that a yearly target never mentions. A short collects that funding when rates are positive, and takes the opposite risk on price.
Leverage shortens the time you have. Liquidation on BloFin runs on the mark price, and you can read the estimated Liq. Price on the order panel before sending an order. As a rough estimate, the margin on a 10x position is about 10% of its value. During that jump into November 5, the contract traded between 49.09 and 53.52 USDT within 24 hours, a range of 9.0%, so a single day can use up most of that margin. A forecast can come true after your position has gone.
Turning a view into a plan takes more, and silver trading strategies such as trend, range and event trades set entries and exits in different ways. Owning the metal for years raises a different question, since silver pays no income and silver as a long-term investment has to earn its return from price alone.
Looking to trade silver? To get started, you'll need to first create a BloFin account, fund your account with cryptocurrency, and navigate to the XAGUSDT Perpetual trading page.
Frequently asked questions
How high do analysts think silver could go?
The highest figures published since October are the $94.70 from LBMA conference delegates for the next 12 months and above $90 from Metals Focus for the fourth quarter of 2027 (source: Kitco, LBMA delegate survey) (source: Kitco, Metals Focus, October 19, 2026). In January 2026, with silver near $84, the LBMA's 26 silver forecasters gave a highest price of $165 and a lowest of $42 for the year (source: LBMA 2026 forecast survey). In February, Bank of America set out ratio-based scenarios of $135 to $309 before the end of 2026. TheStreet's report framed them as scenarios, not certainties, called $135 a base case and said the top needed a squeeze or a surge in physical demand (source: Yahoo Finance, Bank of America, February 28, 2026). By May its language had come down to a possible move above $100 (source: Kitco, Bank of America, May 27, 2026).
Is silver expected to do better than gold?
It depends on where you measure from. The Reuters poll of October 27 has gold's average rising 3.4% from $4,495 in 2026 to $4,650 in 2027 and silver's falling 5.0%, and StoneX's Rhona O'Connell says silver is likely to underperform gold (source: Reuters poll via WHTC, October 27, 2026). From the mark prices of 53.38 and 4,142.08 USDT at 2.52AM UTC on November 5, 2026, those 2027 figures sit about 25.0% higher for silver and 12.3% higher for gold. Metals Focus's October 19 averages rise about equally in 2027, 16.3% for silver and 15.9% for gold (source: Kitco, Metals Focus, October 19, 2026). On October 29, Metals Focus said the gold/silver ratio had room to move higher as silver lagged, and it does not expect that to last indefinitely (source: Kitco, Metals Focus, October 29, 2026).
Does a silver surplus mean the price will fall?
Forecasters disagree, and none of these 2027 figures has been tested yet. Deutsche Bank says the market could enter surplus as early as 2027. It expects an average near $70 in that year's second quarter, about 15.3% over the $60.72 at which silver traded when the view was reported (source: CarbonCredits, Deutsche Bank, October 7, 2026). StoneX's Rhona O'Connell treats oversupply as a drag, expecting silver to underperform gold (source: Reuters poll via WHTC, October 27, 2026).
How often do silver forecasts get updated?
Banks update when markets move, with no fixed timetable. UBS changed its figures between April and September 2026, and J.P. Morgan between May and August. The LBMA analyst survey comes out each January, with 30 analysts across the 2025 survey (source: LBMA 2025 forecast survey) and 26 silver forecasters in 2026 (source: LBMA 2026 forecast survey), while its conference delegates give their view each autumn.
Do silver forecasts all use the same price?
Many of these reports never say which price they mean, so small gaps are normal. For 2025, the LBMA gives an average of $40.03 (source: LBMA 2026 forecast survey), while monthly figures from the World Bank average $39.80 (source: World Bank Pink Sheet, November 2026). That 23-cent gap is tiny beside forecast errors measured in tens of dollars.
Researched and written by the BloFin Academy editorial team with AI-assisted drafting. All facts independently verified. Primary sources include J.P. Morgan Global Research, the London Bullion Market Association, the World Bank, WisdomTree and BloFin's XAG and XAU contract, funding and liquidation pages, with bank and poll figures as reported by Reuters, Kitco, Investing.com, Yahoo Finance, FXStreet and CarbonCredits, current as of November 5, 2026.
Nothing in this article constitutes financial advice, and nothing in it is a recommendation to buy, sell or hold silver in any form. Every forecast quoted is the view of the party named, made on the date given, and past calls have missed by tens of dollars in both directions. Silver more than halved from its January 2026 record within ten months, so a position opened on a target can lose heavily before that target's date. On the XAGUSDT Perpetual, funding can cost a long position every four hours, and leverage can liquidate your margin on a one-day move. Past performance does not indicate future results. Do your own research and consider your risk tolerance before you trade.