
Silver is going up again after months of falling, and the jump in early November has been sudden enough to make people ask what changed. Several headlines landed at once: an election, a slide in oil and a weaker dollar, each offered as the reason.
A one-line answer tends to mislead here. Reports stress different causes and quote their own price at their own hour. Few say how much of the earlier fall the rise has won back, so a rebound can read like the start of a new boom.
Reading a rally well takes the cause each source actually gave, the window its figures cover and one price series followed from start to finish. A perpetual contract adds another view from a crypto account, with a last price, a mark price and a funding rate you can check.
BloFin offers silver as the XAGUSDT Perpetual, and the move shows clearly there: its last price rose 8.1% over the 24-hour window ending at 2.52AM UTC on November 5.
Why is silver going up?
Silver jumped on November 4, reports say, because the Democratic sweep of the US midterm elections pushed the dollar, Treasury yields and oil lower (source: Kitco PM report, November 4, 2026; Guardian Gold market note). The jump also followed steep losses in October, Kitco's report says (source: Kitco PM report, November 4, 2026). Spot silver gained about 5% on November 4, and silver traded near $53 the next day (source: CNBC, November 4, 2026; Trading Economics, silver).
The size of the move depends on the hour of the report. CNBC had spot silver up 5.1% at $52.29 in the afternoon in New York, and silver futures up 5.1% at $52.28 (source: CNBC, November 4, 2026). A Reuters report written earlier in the session had spot at $52.13, up 4.8% (source: Reuters gold report, November 4, 2026). At 3.42AM UTC on November 5, Trading Economics showed silver at $53.20, up 1.80% on the previous day, and that figure moved during the day (source: Trading Economics, silver).
Silver also outran gold on November 4. Guardian Gold's market note said silver outperformed, as it often does in rebounds when investors are taking on risk again (source: Guardian Gold market note). CNBC's report had spot gold up 3.4% against 5.1% for spot silver (source: CNBC, November 4, 2026).
What moved silver day by day in early November
Silver rose on two of the first three trading days of November and fell on the other, while oil dropped on all three. The iShares Silver Trust (SLV), a fund, closed 2.2% higher, then 1.6% lower, then 5.2% higher, so no single driver explains all three days (source: Nasdaq, SLV historical prices; Kitco PM report, November 4, 2026).
Date (2026) | SLV close, change on the day | Oil | 10-year Treasury yield at the close | Cause the report gave for silver |
|---|---|---|---|---|
November 2 | +2.2% | 7.6% lower | 4.91% | Iran diplomacy pushed oil down and eased inflation worries, after heavy selling; Kitco says industrial-demand concerns limited silver's recovery |
November 3 | −1.6% | About 1% lower | 4.95% | Strong data lifted yields and hike expectations; for silver, Kitco adds industrial-demand worries and liquidation |
November 4 | +5.2% | Nearly 9% lower | 4.90% | The Democratic sweep sent the dollar, yields and oil lower |
The SLV closes are Nasdaq's and the yields are the US Treasury's (source: Nasdaq, SLV historical prices; US Treasury, daily par yield curve rates). Kitco's late reports gave Brent's fall and a cause for silver on each of the three days, and Guardian Gold's note on the November 4 session gave the same cause for that day (source: Kitco PM report, November 2, 2026; Kitco PM report, November 3, 2026; Kitco PM report, November 4, 2026; Guardian Gold market note).
November 3 is the clearest test of the oil story. Oil fell about 1% that day and silver fell anyway. Kitco's report blamed stronger US data, which pushed the 10-year yield up by 0.04 of a point (source: Kitco PM report, November 3, 2026; US Treasury, daily par yield curve rates). One day with a smaller oil move proves little, and Kitco's explanation for silver that day was different from its explanation for gold: worries about industrial activity, financing costs and continued liquidation.
November 4 raises the opposite question. The 10-year yield closed just 0.05 of a point lower, and CNBC had the dollar index down about 0.3%, small changes beside a 5.2% jump in SLV (source: US Treasury, daily par yield curve rates; CNBC, November 4, 2026). Neither looks large beside the jump, though oil's fall was far larger, and Kitco's report also describes the metals recovering from October's steep losses (source: Kitco PM report, November 4, 2026).
Where reports disagree about the rally
Reports agree on the order of events and differ on the reason behind the moves, and only some speak about silver directly. One account points to less federal spending, Capital Economics to more worry about government finances, and others to AI regulation or hopes of peace with Iran. These explanations overlap, and most were written about gold or the dollar first.
The Kitco report for November 4 says congressional gridlock could limit further fiscal stimulus, which helped take yields lower and encouraged buying of precious metals (source: Kitco PM report, November 4, 2026). Capital Economics told Reuters almost the reverse. It said investors had become more worried about the fiscal outlook, and that this worry was supporting other precious metals as well as gold (source: Reuters gold report, November 4, 2026). A third account, in the same Reuters report, ties the dollar's drop to investors weighing tighter AI regulation and its possible drag on growth (source: Reuters gold report, November 4, 2026).
By November 5, Trading Economics was leading with Iran. It said the Democratic wins had raised hopes for an end to the conflict and triggered the sharp fall in oil (source: Trading Economics, silver). That hope has limits. On November 3, election day, a senior Iranian official had told Reuters that the two sides were still far from a deal (source: Reuters gold report, November 4, 2026).
Safe-haven demand in the rally
Guardian Gold calls the early November rise a risk-on rebound, and US stocks surged the same day, which CNBC put down to easing political risk. Capital Economics' fiscal worry from that session points the other way (source: Guardian Gold market note; Reuters gold report, November 4, 2026). In a note on November 3, the day before that jump, Capital.com's Daniela Hathorn wrote that geopolitical uncertainty does not automatically become safe-haven demand when investors also fear tight monetary policy (source: CNBC, November 4, 2026). The Silver Institute said in April that, apart from an initial short-lived safe-haven boost, the war with Iran had acted as a headwind for silver (source: World Silver Survey 2026). Brookings notes that weakness in wartime runs against the safe-haven reputation of precious metals (source: Brookings).
Is the Federal Reserve behind the silver rally?
None of these reports puts the Federal Reserve behind the rally directly, and its last move was a rate rise. Kitco says the election led some investors to reassess further tightening, yet the reported odds of a December hike stayed high. It lifted its target range to 3.75% to 4.00% in September and held it in October, and traders still expected another hike in December while silver climbed (source: Federal Reserve, September 16, 2026; Federal Reserve, October 28, 2026; Reuters gold report, November 4, 2026).
The September rise was a quarter point (source: Federal Reserve, September 16, 2026), and two policymakers voted for another at the October meeting (source: Federal Reserve, October 28, 2026). CME's FedWatch tool put the chance of a December hike near 75% on November 2, as reported by Kitco, and at 82% on November 4, as reported by Reuters. Trading Economics reported 79% on both November 4 and November 5 (source: Kitco PM report, November 2, 2026; Reuters gold report, November 4, 2026; Trading Economics, silver). Neither report shows a clear fall in those odds, and a hike remained the likely outcome. Higher rates raise the cost of holding a metal that pays no interest, as Reuters says of gold. Kitco says high financing costs weigh on silver (source: Reuters gold report, November 4, 2026; Kitco PM report, November 3, 2026). The decision gets made at an FOMC meeting.
How far has silver risen?
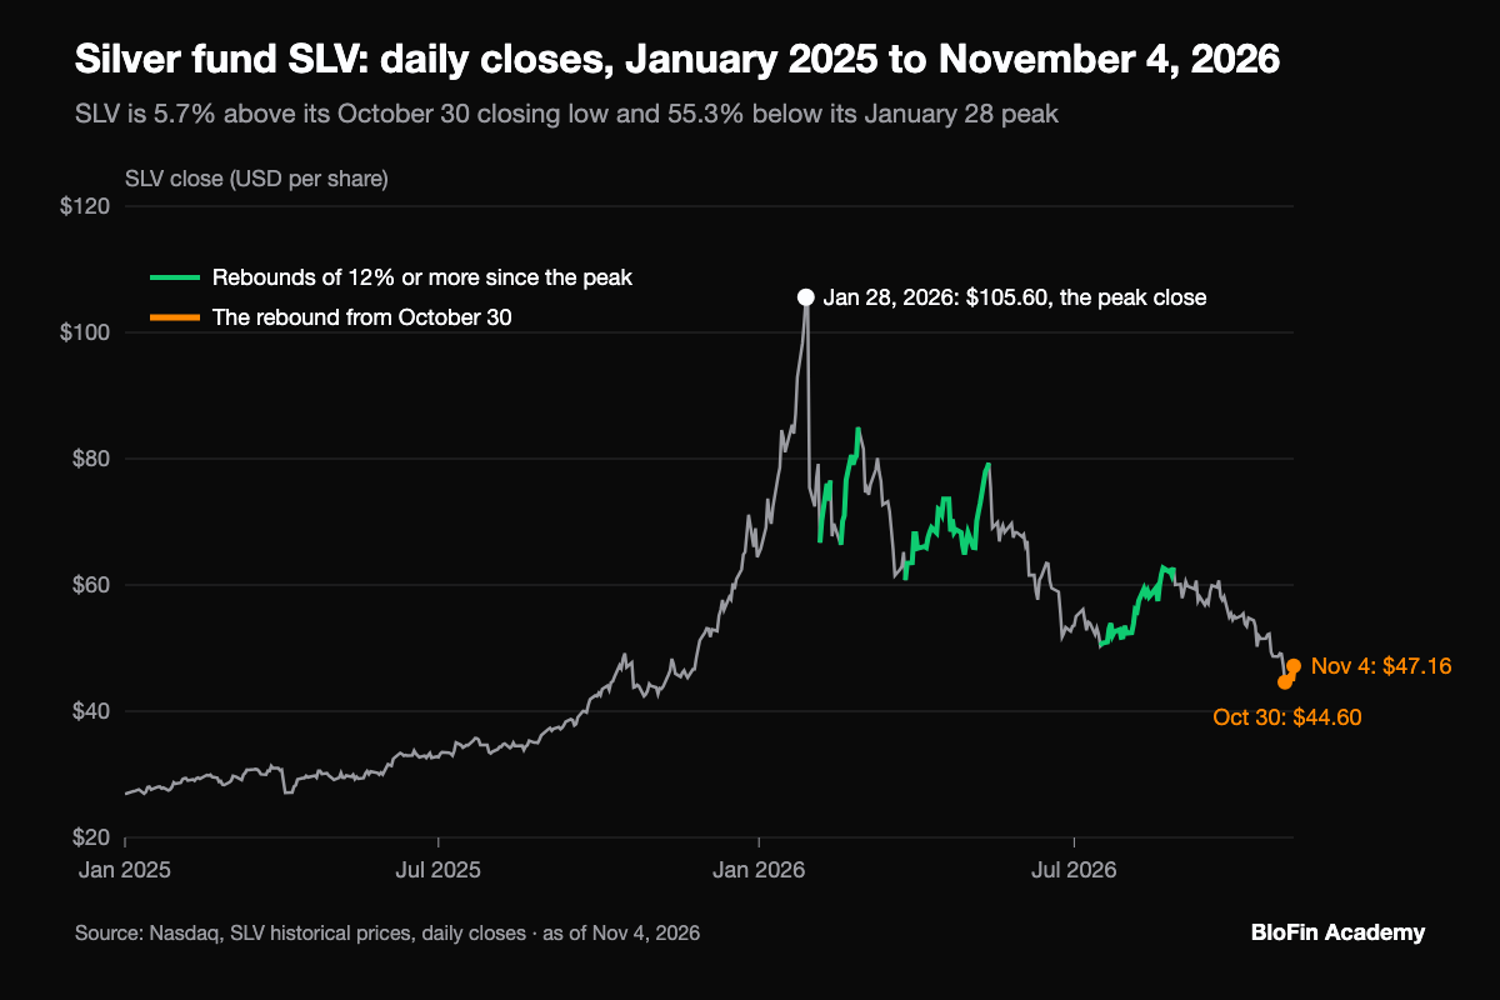
On closing prices the SLV fund has risen 5.7% from its October 30 low (source: Nasdaq, SLV historical prices). On Trading Economics' series silver stood at $53.20 at 3.42AM UTC on November 5, about 56.3% below its January record of $121.64 (source: Trading Economics, silver). That makes it a rebound inside a much larger fall, and regaining the record from there would take a rise of about 128.6%.
Measured from the lowest spot print, the rise looks larger: about 8.9% from a dip to $48.85, a figure only Guardian Gold's note dates to November 4, to that $53.20. It joins two sources and is approximate (source: Guardian Gold market note). BullionVault had reported a separate dip beneath $49 overnight into November 3 (source: BullionVault, November 3, 2026). The $53.20 and the $121.64 record both come from Trading Economics, so that comparison stays on one series. Silver is priced across spot, futures and benchmark markets, so "the silver price" can mean several series.
One series makes the windows easy to compare. SLV is a fund that tracks the London silver benchmark, and each share held about 0.90 of an ounce on November 4 (source: iShares Silver Trust). Its $47.16 close that day works out at about $52.25 an ounce, close to the futures price of $52.28. Fees slowly reduce the silver behind each share, so SLV's returns run slightly below the metal's. Nasdaq's closes give these changes to November 4 (source: Nasdaq, SLV historical prices).
Window to the November 4, 2026 close | SLV close at the start | Change |
|---|---|---|
From November 3, 2026 | $44.84 | +5.2% |
From October 30, 2026, the lowest close since the peak | $44.60 | +5.7% |
From September 30, 2026 | $54.51 | −13.5% |
From January 28, 2026, the peak close | $105.60 | −55.3% |
From December 31, 2025 | $64.42 | −26.8% |
From November 4, 2025 | $42.74 | +10.3% |
On these closes the rise has won back $2.56 of the $61.00 lost between January 28 and October 30, about 4.2%, and the November 4 close was still below the $49.06 close of October 28 (source: Nasdaq, SLV historical prices).
So silver is going up over days and over a full year. It is going down since the end of September, since the start of this year and since January. CNBC put silver's drop for the year at around 26%, and Guardian Gold's note said almost 28%. The figure moves with the source and the hour (source: CNBC, November 4, 2026; Guardian Gold market note). The 2026 fall in silver came in steps, with rate-hike fears and forced selling behind them.
How earlier 2026 rebounds compare
SLV has made several large rises during this fall, some much larger than this one so far. Count a rebound as a rise of at least 12% that ends with a fall of at least 12%, and SLV's closes show four since the January peak (source: Nasdaq, SLV historical prices).
Low close | High close | Rise | Fall that followed |
|---|---|---|---|
February 5: $66.69 | February 11: $76.56 | +14.8% | −13.3% |
February 17: $66.37 | February 27: $84.99 | +28.1% | −28.5% |
March 26: $60.77 | May 13: $79.35 | +30.6% | −36.5% |
July 16: $50.39 | August 27: $62.77 | +24.6% | −28.9% |
The 12% line is a choice. Set it at 10% and the same months show six rebounds, and at 15% they show three, so the count moves while the pattern of large swings stays. The count requires a later fall and comes from one falling market, so it cannot show how a lasting recovery looks or how this rebound ends. The rebound from the March 2020 low kept going for months: SLV rose from $11.21 on March 18, 2020 to $27.00 on August 10, about 140.9% (source: Nasdaq, SLV historical prices).
One big day tells you little. SLV has had 44 closes up 5% or more in the 10 years to November 4, and 20 of them came in 2026. Of the 43 that have 20 trading days of later data, SLV was higher after those 20 days in 19 cases, with a median change of −2.0% (source: Nasdaq, SLV historical prices). Before 2026 it was higher in 14 of 24, and in 2026 in 5 of 19. Those days cluster and their later periods overlap, so they count as fewer separate tests than the numbers suggest, and they say little about what comes next.
Why did silver rise to its January 2026 record?
The Silver Institute says silver rose to its January 2026 record because tight physical supply met a wave of investment buying, helped by a weaker dollar, tariff fears, geopolitical flare-ups and worry over Fed independence. Silver began 2025 below $29, peaked at $84 that December and passed $121 on January 29, according to the Institute (source: World Silver Survey 2026).
The World Silver Survey 2026 gives the fullest account (source: World Silver Survey 2026). It says the January rally stood out for the outsized effect of physical investment, with coin and bar shortages, higher premiums and queues outside dealers. Flows into exchange-traded funds and retail buying of futures and options also exploded, and the Survey says fear of missing out and leverage amplified the rise as it accelerated in late 2025. Silver's addition to the US critical minerals list helped too, as did reports of Chinese export restrictions that the Survey calls erroneous.
The popular explanations hold up unevenly when you test them against the record:
The supply deficit. The market ran its fifth straight deficit in 2025, at 40.3 million ounces. Yet the Survey says that for several years deep deficits showed up in neither the price nor lease rates (source: World Silver Survey 2026). What changed in 2025 was access to metal, as bars moved from London to US vaults and into funds, which led to a squeeze in London that October.
Solar demand. Solar is a common explanation. Yet silver use in solar panels fell to 186.6 million ounces in 2025, and the Survey forecasts 151 million for 2026 (source: World Silver Survey 2026). Silver hit its record while that demand was already shrinking.
Rate cuts. The Fed cut in September, October and December 2025, taking its target range to 3.50% to 3.75% (source: Federal Reserve, December 10, 2025; World Silver Survey 2026). The timing fits the rally's late months, and the September 2026 hike came long after silver had turned down.
The debasement trade. This is the idea that investors leave paper currencies for assets such as gold because they fear governments will inflate their debts away. Brookings treats it as a possible explanation with many open questions, and its October 2 figures show silver rising further than gold since the start of 2025 (source: Brookings).
Between them, those accounts cover the run to January, and they draw on the usual drivers of the silver price: rates, the dollar, supply and investment demand. The early November rise is a much smaller move, and of the January list, the weaker dollar and the worry over government finances carry over into the reports on it.
What the rally did on XAGUSDT
The XAGUSDT Perpetual's last price rose from 49.41 to 53.41 USDT, or 8.1%, over the 24-hour window ending at 2.52AM UTC on November 5. BloFin's gold perpetual rose 5.0% over the same window. These are contract prices, so they differ from the spot quotes and cover a different window.
Volume on the later read was higher. Over that 24-hour window it was 67,994.81 XAG, about 33.2% above the 51,032.21 XAG on BloFin's 24-hour read at 8.18AM UTC on November 4 (source: XAGUSDT Perpetual). Those two windows overlap, so the comparison is a rough one.
Here is what the move meant in money. Say you held a 10 XAG position through it, worth 494.10 USDT at the start and 534.10 USDT at the end, a change of 40 USDT. At 5x, your margin would be 98.82 USDT, so a long gained about 40.5% on margin before fees and funding, and a short lost the same. A rise of 8.1% equals all the margin on a short at about 12.4x, and the position would close before that point. On BloFin, liquidation comes once the mark price hits a position's liquidation price, the level at which margin stops covering the loss. That 12.4x is an estimate from the price move alone, so read the Liq. Price on the order panel before you size anything.
Funding stayed positive through the rally, and on BloFin a positive funding rate means longs pay shorts. The six settlements inside that window, from 4AM UTC on November 4 to 12AM UTC on November 5, were 0.0180%, 0.0120%, 0.0036%, 0.0086%, 0.0057% and 0.0086%, against a 0.0157% average for the seven days to that point (source: XAGUSDT funding history). Those six add up to 0.0565%, or about 0.30 USDT on a steady 534.10 USDT position, and past rates are no guide to the next ones. Today's mark price and current funding are on the XAGUSDT Perpetual page.
What to watch while silver is rising
The reports behind this rise point to three things to watch: oil and the Iran talks, US jobs and inflation data, and the Fed's December decision. Those reports tie this month's moves to oil, job figures and hike expectations (source: Kitco PM report, November 2, 2026; Kitco PM report, November 3, 2026). Each can push silver in either direction, so none of them tells you where the price goes next.
Trading Economics ties silver to oil directly, saying cheaper oil could ease inflation pressure and worry about near-term rate rises (source: Trading Economics, silver). That can reverse quickly. Kitco's report on November 4 described recent US strikes near the Strait of Hormuz, and it said the drop in oil reflected lower expectations of escalation, with the supply threat still there (source: Kitco PM report, November 4, 2026).
US data matters because of what happened on November 3, when strong figures lifted yields and silver fell. Each monthly jobs report and price report can do the same in either direction. The December hike odds can shift with them, since two policymakers already wanted a hike in October. A trade on any of this starts with a silver trading plan that sets the stop and the size before the order goes in.
Looking to trade silver? To get started, you'll need to first create a BloFin account, fund your account with cryptocurrency, and navigate to the XAGUSDT Perpetual trading page.
Frequently asked questions
Why is silver so expensive?
Silver is well above where it started last year and far below its January record. A price near $53 on November 5 compares with a start to 2025 below $29 and a 2025 average of just over $40, on the Silver Institute's figures (source: World Silver Survey 2026). The Survey ties those gains to a tight physical market and heavy investment buying, which also pushed up dealers' premiums on coins and bars.
What was silver's highest price ever?
Silver's all-time high came in January 2026, at $121.64 on Trading Economics' series, and the Silver Institute dates it to January 29 at over $121 (source: Trading Economics, silver; World Silver Survey 2026). Other series peaked at different levels and on different days, and SLV's highest close was $105.60 on January 28 (source: Nasdaq, SLV historical prices). So compare a current price only with the record from its own series.
Did silver go up more than gold in 2025?
Silver rose far more than gold in 2025. CNBC put the gains at 135% for silver and 66% for gold, while SLV's closing price rose 144.7%, so the figure depends on the series and the dates (source: CNBC, November 4, 2026; Nasdaq, SLV historical prices). The direction reversed in 2026, when silver's loss for the year stood at around 26% on November 4 against more than 6% for gold (source: CNBC, November 4, 2026).
Does a silver rally mean longs pay funding?
A rising price does not settle who pays, because funding depends on how the contract trades against the price it follows. Shorts paid longs at about 15.0% of the XAGUSDT Perpetual's settlements from listing on January 8, 2026 to November 5. Its highest reading, +0.6504%, came on March 1, 2026, well after silver's peak (source: XAGUSDT funding history).
Why is the silver price different on different websites?
Silver prices differ between websites because each one shows its own series at its own hour. On November 4, SLV's closing price rose 5.17%, while its net asset value, which follows the London benchmark, rose 6.09% (source: Nasdaq, SLV historical prices; iShares Silver Trust). Trading Economics quotes a contract for difference that tracks the benchmark market, and a 24-hour exchange figure starts from a different hour than a daily close (source: Trading Economics, silver).
Researched and written by the BloFin Academy editorial team with AI-assisted drafting. All facts independently verified. Primary sources include the Silver Institute, the Federal Reserve, the US Treasury, Nasdaq, iShares, CNBC, Reuters, Kitco, Brookings and BloFin's XAGUSDT trading and funding pages, current as of November 5, 2026.
Nothing in this article constitutes financial advice, and nothing in it is a recommendation to buy, sell or hold silver in any form. SLV's four completed rebounds of 12% or more since January 2026 were each followed by a fall of at least 13%, and that count requires a later fall, so it cannot say how this rebound ends. A move of about 8% can take all the margin from a position held at about 12x. Reasons reported for a rally can change within days, so buying because of a headline can leave you holding a position after its reason has gone. Past performance does not indicate future results. Do your own research and consider your risk tolerance before you trade on BloFin.