
Crypto prices can swing hard in a day, but the mood behind them often swings harder. When a scary headline lands, traders want to know whether everyone else is panicking too. Many of them look at one number, on a scale from 0 to 100, that tries to sum up how the whole market feels.
That number got a real test in late October 2026. On October 29, 2026, Binance said about $6.3 billion in coins had been taken from its wallets, and it paused deposits and withdrawals while it ran security checks (source: Bitcoin.com News, October 29, 2026). The next morning, Alternative.me's crypto sentiment score had dropped from 51 to 30, a fall of 21 points in one day. Bitcoin's daily close barely moved, staying between about $77,100 and $78,200 from October 29 to November 1 (source: calculated from Coin Metrics and Alternative.me data).
That gap between mood and price is exactly what the crypto fear and greed index is built to show. Used well, it tells you how one-sided the market's mood is, and it can stop you from chasing a move that everyone else is already chasing. Used badly, it turns into a buy or sell signal it was never designed to be, and nearly nine years of data show why that goes wrong.
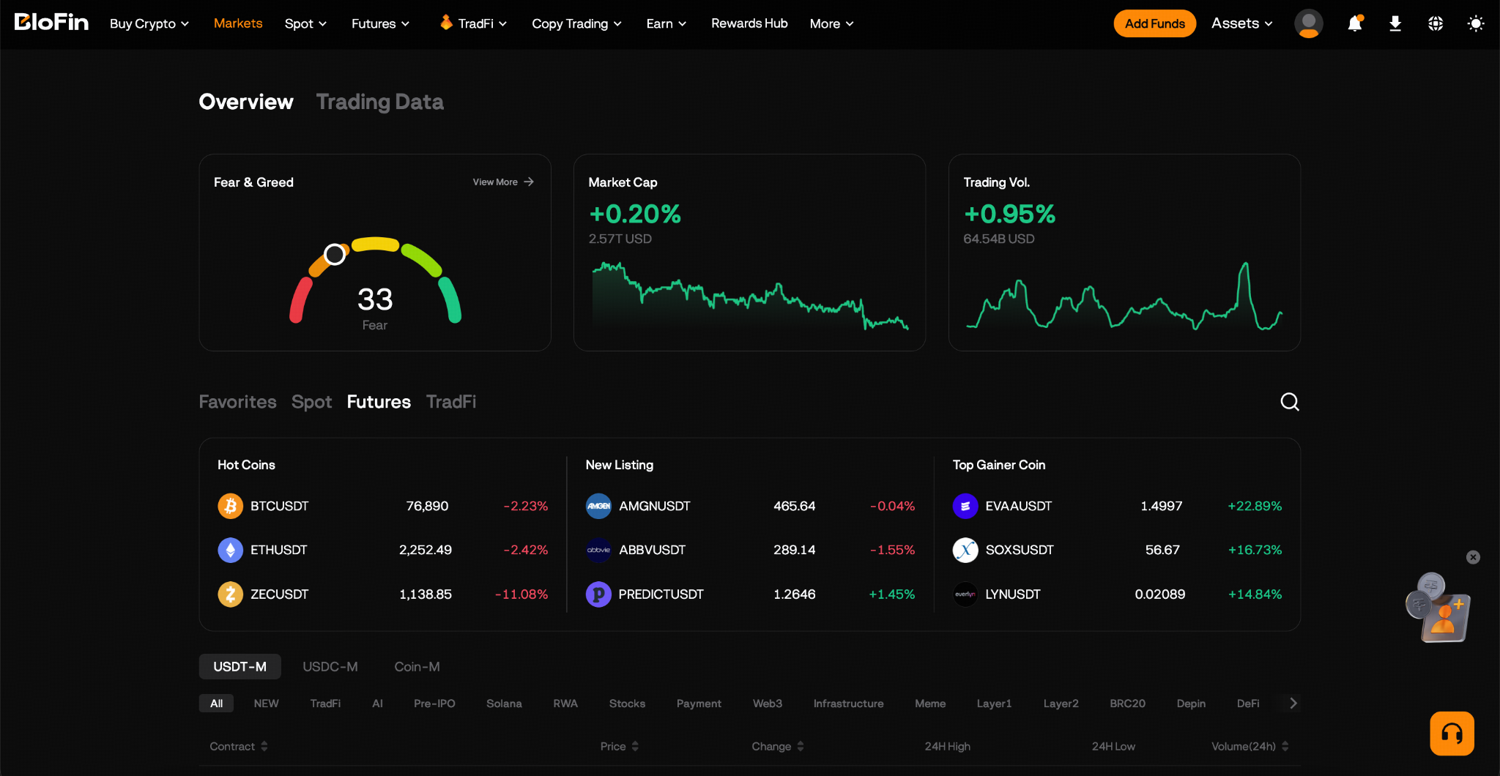
BloFin shows a live fear and greed gauge on its Markets page, right beside market cap, trading volume and bitcoin ETF flows, so you can read the score in the same place you check the wider market.
What is the crypto fear and greed index?
The crypto fear and greed index is a daily score from 0 to 100 that measures the crypto market's mood. Low scores mean traders are fearful and selling, and high scores mean they are greedy and buying. Alternative.me publishes the original version, built mostly from bitcoin's price swings, volume and social media (source: Milk Road, Crypto Fear and Greed Index).
The score describes the conditions you are trading in today. A score of 10 means the market is in a panic, with big daily swings and heavy selling. A score of 90 means it is in a buying frenzy, with fast gains and a lot of excitement online. Most days sit somewhere in between. Each reading is one number for a whole day, so it means most when you compare it with the readings before it. That is why Alternative.me and BloFin's gauge both show yesterday's, last week's and last month's scores beside today's.
The index is built from inputs that move with price, so it reacts fastest after a sharp move. That is why it often reads "Extreme Fear" after a crash, when the selling has already happened, and "Extreme Greed" after a rally, when the buying has already happened. Keeping that in mind is most of what you need to read it well.
Alternative.me's daily record starts on February 1, 2018, which gives 3,193 daily readings up to November 2, 2026. Across that whole stretch the average reading is 45.8, slightly on the fearful side of the middle, and the market has spent more days in fear than in greed (source: calculated from Alternative.me data).
Crypto fear and greed index ranges
Every index splits its 0 to 100 scale into five labels, but providers draw the lines in different places. That matters because the same number can carry a different label on two sites. A reading of 22 is "Extreme Fear" on Alternative.me but only "Fear" on CoinMarketCap.
Label | Alternative.me range | CoinMarketCap range | Share of days on Alternative.me, February 2018 to November 2026 |
|---|---|---|---|
Extreme Fear | 0 to 25 | 0 to 20 | 23.1% |
Fear | 26 to 46 | 20 to 40 | 28.6% |
Neutral | 47 to 54 | 40 to 60 | 12.8% |
Greed | 55 to 75 | 60 to 80 | 26.6% |
Extreme Greed | 76 to 100 | 80 to 100 | 8.8% |
The Alternative.me ranges come from the labels attached to each reading in its own data, and the CoinMarketCap ranges from the dial on its index page (source: CoinMarketCap, Crypto Fear and Greed Index). Alternative.me's record shows how rare greed at the top of the scale is: the market has spent more than half its days in Fear or Extreme Fear, and fewer than one day in ten in Extreme Greed.
How is the crypto fear and greed index calculated?
Alternative.me builds its index from six weighted inputs, all about bitcoin: volatility and market momentum count for 25% each, social media and surveys for 15% each, and bitcoin dominance and Google Trends for 10% each. The survey input is currently paused. Each input is turned into a score, and the weighted scores are added up into one number.
Here is what each input looks for, and which way it pushes the score (source: Alternative.me):
Input | Weight | What it measures | What pushes the score down (fear) |
|---|---|---|---|
Volatility | 25% | Bitcoin's current price swings and drawdowns compared with its 30-day and 90-day averages | An unusual rise in volatility |
Market momentum and volume | 25% | Current trading volume and momentum compared with the same 30-day and 90-day averages | Heavy selling in a falling market |
Social media | 15% | How many posts appear on bitcoin hashtags and how fast they get interactions | Not stated: Alternative.me names only the greed side, where unusually high interaction pushes the score up |
Surveys | 15% | Weekly polls of crypto investors, currently paused | Bearish poll answers |
Dominance | 10% | Bitcoin's share of the total crypto market value | A rising bitcoin share, read as money leaving riskier coins |
Trends | 10% | Google search interest in bitcoin-related phrases | Searches with a worried tone, such as "bitcoin price manipulation" |
Half the weight sits on volatility and momentum, which both come from bitcoin's own trading: its price and volume. That is the main reason the index follows the market so closely. The dominance input works on a simple idea: when traders get nervous, they sell smaller coins and hold bitcoin, so bitcoin's share of the market rises. How bitcoin dominance works explains that share and why it moves.
CoinMarketCap uses a different recipe. Its index draws on the price momentum of the 10 largest coins (leaving out stablecoins), implied volatility for bitcoin and ether from Volmex's indices, and the put/call ratio in bitcoin and ether options. It adds the Stablecoin Supply Ratio and its own search and user data, and its index page does not publish the weights (source: CoinMarketCap).
Why fear and greed indexes show different numbers
Different indexes use different inputs, weights and update times, so they rarely agree to the point. Alternative.me measures bitcoin alone, and CoinMarketCap looks across the 10 largest coins and adds options data. Each site also updates on its own schedule, so two of them can show different numbers on the same morning even when their inputs are similar.
On the morning of November 2, 2026, three sources gave these readings:
Source | Reading | Day before | About a week earlier |
|---|---|---|---|
Alternative.me | 37, Fear | 34 | 50 |
CoinMarketCap | 36, Fear | 36 | 43 |
BloFin Markets page | 37, Fear | 36 | 43 |
The November 2 readings sit within one point of each other, but the history columns show the gap. A week earlier, Alternative.me read 50, in the middle of its Neutral band, while CoinMarketCap and the gauge on BloFin's Markets page both showed 43, a reading CoinMarketCap labels Neutral and Alternative.me's scale would call Fear. When you compare a reading with last week's, compare it with the same source.
CNN's Fear and Greed Index is a separate gauge for the US stock market, built from seven stock and bond indicators such as stock price breadth and junk bond demand (source: CNN, Fear and Greed Index). When a headline quotes "the fear and greed index" next to the S&P 500, it means CNN's, and that number can sit far from the crypto reading on the same day.
How to read today's fear and greed index
Read four things before you act on a fear and greed score: the label and its source, the direction over the past week, how long the reading has lasted, and whether the price moved with it. A single number tells you today's mood. The other three tell you whether that mood is fresh, fading or settled in.
Say you open the gauge on the morning of November 2 and see 37, Fear. Here is how to work through it, using Alternative.me's figures:
Start with the label. A reading of 37 sits in the middle of the Fear band, which makes it a nervous reading and a long way from the 5 to 10 readings seen in the worst crashes. Then check the direction. The score fell from 51 on October 29 to 30 the next day, after the Binance news, and stayed at 30 on October 31. Since then it has climbed back to 34 on November 1 and 37 on November 2 (source: Alternative.me).
Next, check how long the reading has lasted. The move from Neutral to Fear is four days old, which makes it a fresh reaction to one event. That is a different situation from a long, grinding fear such as the 46-day run of Extreme Fear from January 30 to March 16, 2026. Finally, compare the score with the price. Bitcoin's close barely changed while the score fell 21 points, so the drop most likely came from the inputs that react to news, such as social media, search interest and short bursts of volatility.
Put together, those four checks describe a market that got a fright, kept its price, and is calming down. That is useful context for how much risk to take, and a second piece of bad news could still push the score lower within a day.
The wider backdrop matters too. Bitcoin's close on November 1 was 37.4% below its record close of $124,824 on October 6, 2025, and the index has spent 77.8% of the days since October 11, 2025 in Fear or Extreme Fear (source: calculated from Coin Metrics and Alternative.me data). After a year like that, a reading of 37 is close to normal, and why crypto is crashing covers the forces behind the slide.
Fear and greed index readings during past crashes and hacks
The index has hit its lowest readings in long sell-offs and forced-selling crashes, while single hacks moved it less. It read 10 during the March 2020 COVID crash and 12 during the Terra collapse in May 2022, but 29 as FTX's troubles broke and 49 the day after the Bybit hack. The lowest reading on record is 5.
Here are the readings on the days of some of crypto's best-known shocks (source: calculated from Alternative.me data):
Date | Event | Index reading | Label |
|---|---|---|---|
March 13, 2020 | COVID crash | 10 | Extreme Fear |
May 12, 2022 | Terra and LUNA collapse | 12 | Extreme Fear |
November 9, 2022 | FTX crisis | 29 | Fear |
February 22, 2025 | Day after the Bybit hack | 49, down from 55 | Neutral |
October 11, 2025 | Day after a record wave of forced liquidations | 27, down from 64 | Fear |
February 12, 2026 | 2026 sell-off | 5 | Extreme Fear |
October 30, 2026 | Day after the Binance theft | 30, down from 51 | Fear |
Side by side, these events suggest a pattern. The Bybit hack in February 2025 took about $1.5 billion, and the Binance theft about $6.4 billion, the largest on record according to TRM Labs (source: TRM Labs, October 29, 2026). Both moved the index, but each hit a single exchange in a market that was otherwise working, so the score fell without collapsing. The deepest readings came when selling fed on itself for weeks, as it did in 2022 when Extreme Fear lasted 74 days straight from May 6 to July 18, and in early 2026. The biggest one-day fall in the past five years was the 37-point drop on October 11, 2025. It came after more than $19 billion of leveraged positions were liquidated in 24 hours, the largest wipeout on record at the time (source: Decrypt, October 11, 2025).
The record low of 5 has appeared three times: on August 22, 2019, and on February 12 and February 23, 2026. The record high of 95 first appeared on June 26, 2019 and came back many times between December 2020 and February 2021, during the rally that took bitcoin past its 2017 high. Two of the three most fearful days in the index's history have come in 2026.
Does the fear and greed index predict bitcoin's price?
The record says it mostly looks backward. Across 3,193 days, the index tracked bitcoin's price change over the previous 30 days closely, with a correlation of 0.70, but tracked the next 30 days only weakly, at 0.13. It works better as a mirror of what the market just did than as a forecast.
A correlation runs from −1 to 1. At 0.70, high scores go with recent gains and low scores with recent losses most of the time. At 0.13, knowing today's score tells you very little about the month ahead.
The popular way to use the index is the contrarian rule. It comes from Warren Buffett, who wrote in 1986 that he tries "to be fearful when others are greedy and to be greedy only when others are fearful" (source: Berkshire Hathaway, 1986 shareholder letter). Alternative.me's own page says extreme fear "could be a buying opportunity". The record since 2018 tells a more mixed story. Here is what bitcoin did after the first day of each new spell of Extreme Fear or Extreme Greed. A spell counts as new after at least 30 days without that label (source: calculated from Coin Metrics and Alternative.me data):
Starting point | Days or spells counted | Median change over the next 30 days | Median change over the next 90 days | Share higher after 90 days |
|---|---|---|---|---|
Any day, February 2018 to November 2026 | 3,162 (3,102 with a 90-day result) | +1.4% | +3.4% | 54% |
First day of a new Extreme Fear spell | 14 | −6.8% | −11.1% | 6 of 14 (43%) |
First day of a new Extreme Greed spell | 12 | +2.3% | +26.7% | 9 of 11 (82%) |
These are past results from small samples, and a few big years drive them. One new Extreme Fear spell, starting March 9, 2020, was followed by a 23.4% gain in 90 days and nearly sevenfold in a year. Many others kept falling: the spell that began on November 27, 2021 was followed by a 28.0% drop in 90 days as the 2022 bear market set in. In most of these spells, the first day of fear came early, and more selling followed. Only 11 of the 12 new Extreme Greed spells have a 90-day result, because the latest one, which began on September 22, 2026, is not yet 90 days old (source: calculated from Coin Metrics and Alternative.me data).
Milk Road found a similar result in an earlier study of the same data: streaks of greed were followed by stronger 90-day returns than streaks of fear (source: Milk Road). The reason is the same one that gives the 0.70 correlation. The index is largely a measure of momentum, and in the 2018 to 2026 record, bitcoin more often kept moving the same way for three months after a new spell began than turned around. The greed and fear pendulum explains why markets overshoot in both directions, and the biases behind investor fear and greed covers why traders act on that mood.
How long extreme fear and extreme greed last
Extreme readings can last for weeks, which is why a low score on its own is a poor timing tool. The longest run of Extreme Fear lasted 74 days in 2022, and the longest run of Extreme Greed lasted 76 days, from November 6, 2020 to January 20, 2021, while bitcoin kept climbing.
Year by year, the index tracks the market's big swings. In 2022, the year of Terra, Celsius and FTX, the average reading was 25.3 and the index spent 207 days in Extreme Fear with no Extreme Greed at all. In 2024, the year US spot bitcoin ETFs launched, the average was 63.3, with 86 days of Extreme Greed and 8 of Extreme Fear. In 2026, up to November 2, the average is 32.7, with 137 days of Extreme Fear and only one day of Extreme Greed. The bitcoin 4 year cycle shows how those years fit into bitcoin's longer pattern of peaks and lows.
Both extremes also come with bigger price swings. On Extreme Fear days, bitcoin's daily close moved 2.59% on average, and on Extreme Greed days 2.96%, against 1.81% on Neutral days. One Extreme Fear day in 20 brought a move of 8.4% or more (source: calculated from Coin Metrics and Alternative.me data). The extremes are the loudest days in either direction, and they are when position size matters most.
Using the fear and greed index with funding rates and open interest
The fear and greed index is most useful as a first check that you confirm with derivatives data. Funding rates show whether traders using leverage are mostly long or short, and open interest shows how much money is in open futures positions. When the index, funding and open interest all point the same way, the mood is likely crowded.
A funding rate is a small payment between longs and shorts on a perpetual contract that keeps its price close to the spot price. When it is positive, longs pay shorts, which usually means more traders are betting on a rise. On BloFin, the BTCUSDT Perpetual settles funding every eight hours, and on the morning the index read 37, the rate was mildly positive, even with the index in Fear. Open interest is the total value of futures contracts still open. A rising number with a falling price means new short positions or trapped longs are building up, and how crypto funding rates work covers the fee itself.
Here is how the three readings combine:
Fear and greed reading | Funding rate | Open interest | What it usually describes |
|---|---|---|---|
Extreme Greed | High and positive | Rising | A crowded long trade, with many leveraged buyers who could be forced out by a drop |
Greed | Mildly positive | Steady | A rising market without heavy leverage |
Fear | Near zero or mildly positive | Steady | Nervous mood, but traders using leverage have not turned bearish |
Extreme Fear | Negative | Rising | A crowded short trade, where a bounce can force shorts to buy back |
Extreme Fear | Negative | Falling fast | Forced selling and liquidations clearing out positions |
Those two readings, 37 on the index and mildly positive funding, match the Fear line: a nervous score, funding still mildly positive. That suggests the hack scared people without pushing traders using leverage into big short bets. Funding and open interest signals shows how to read the two together in more detail.
The index also helps with position size. Say you plan a 1,000 USDT long on the BTCUSDT Perpetual at 5x leverage, which ties up 200 USDT of margin and, with bitcoin at about $78,000, comes to about 12.8 contracts of 0.001 bitcoin each. If bitcoin falls 8.4%, the position loses about 84 USDT, or 42% of your margin, and a daily move that large, up or down, came on about one Extreme Fear day in 20 (source: calculated from Coin Metrics and Alternative.me data). On an Extreme Fear day, you might cut the size or the leverage so that a move that large still leaves you inside your limit. How leverage and liquidation work shows where the liquidation price sits for each leverage level.
The BTCUSDT Perpetual trading page shows the live funding rate and a countdown to the next payment at the top of the page. Check it next to the fear and greed reading before you size a position.
How to check the fear and greed index and trade bitcoin on BloFin
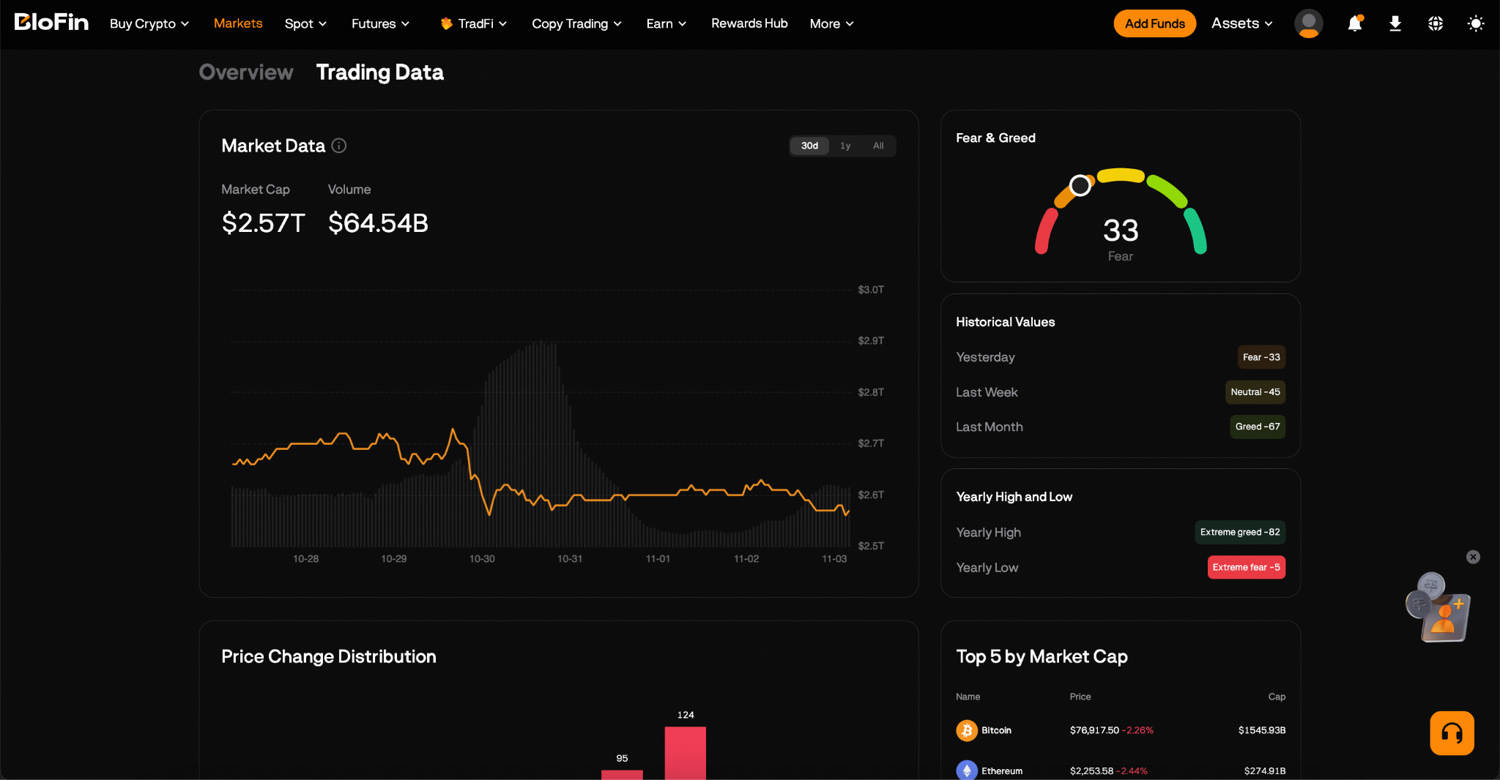
On BloFin's Markets page, the gauge's View More panel adds yesterday's, last week's and last month's readings, plus the yearly high and low, which stand at 82 and 5 for the past year. You can trade bitcoin on the BTCUSDT Perpetual from the same account.
To read the gauge and open a position:
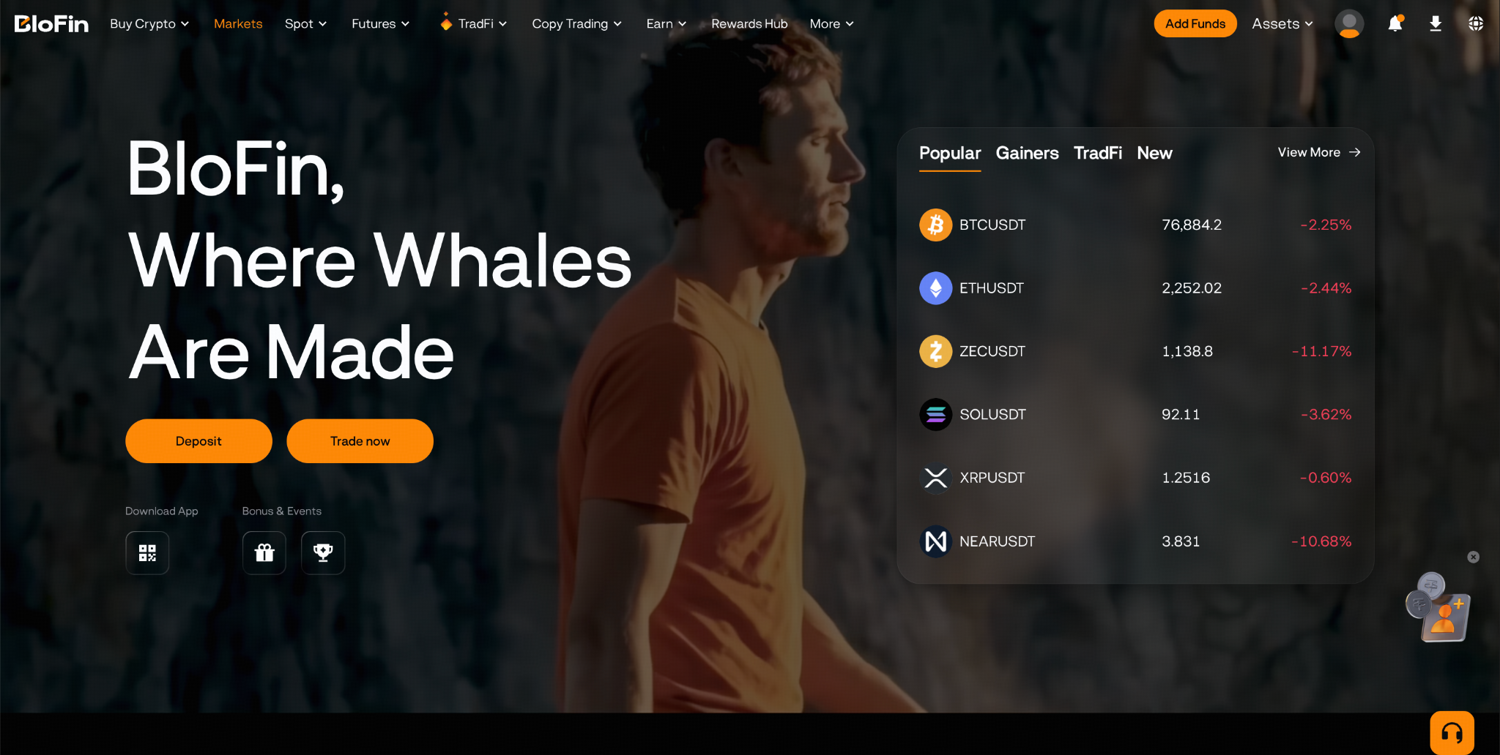
Step 1: On the BloFin website, click Markets in the top menu. The page opens on the Overview tab, where the Fear & Greed gauge is the first panel, beside Market Cap and Trading Vol.
Step 2: Click View More on the gauge to open the Trading Data tab. Check the Historical Values for Yesterday, Last Week and Last Month to see the direction, and the Yearly High and Low to see how far the reading sits from the extremes.
If you’re ready to trade bitcoin following this, simply continue with the steps below:
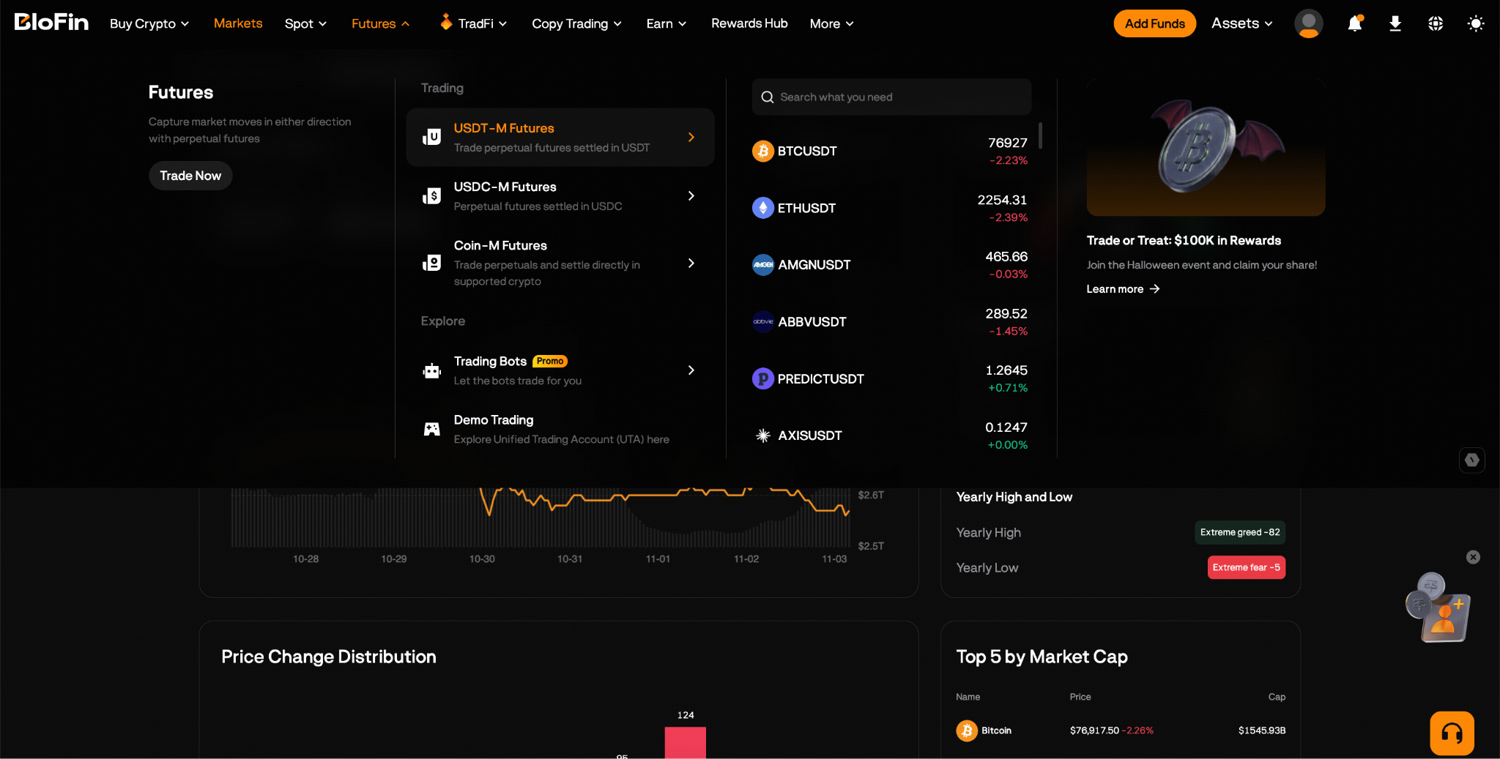
Step 1: Hover your cursor over the Futures tab and click USDT-M Futures. It will automatically direct you to the BTCUSDT Perpetual trading page.
Step 2: On the order panel, click the margin mode button, shown as Cross by default, to choose your margin mode, and click the leverage button beside it to set your leverage. Then choose Limit or Market and enter your amount.
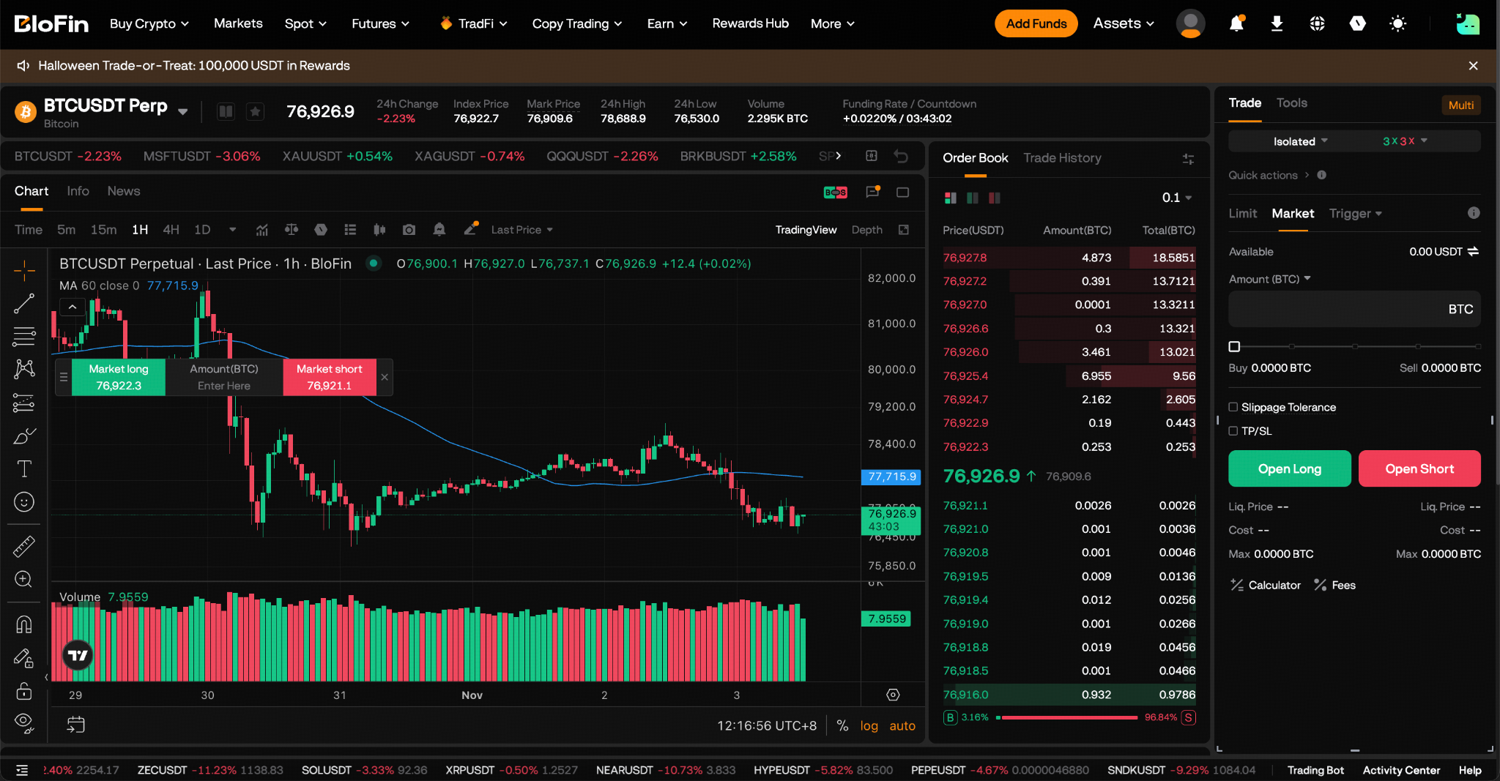
Step 3: Tick TP/SL and enter a stop-loss price, so the position closes if the price moves against you by more than you planned. Before you click Buy to go long or Sell to go short, check Liq. Price and Cost.
A stop-loss is most useful on the high-swing days the index flags, though in a fast fall a triggered stop fills at the next available price and can come past your level. How to set a stop-loss on BloFin shows how to place one.
Looking to trade bitcoin? To get started, you'll need to first create a BloFin account, fund your account with cryptocurrency, and navigate to the BTCUSDT Perpetual page.
Frequently asked questions
Who created the crypto fear and greed index?
Alternative.me, a website best known for listing software alternatives, publishes the original crypto fear and greed index. The idea came from the stock market: CNN built the original Fear and Greed Index for US stocks, and crypto sites adapted the same approach (source: Milk Road).
Is there a fear and greed index for Ethereum and altcoins?
Yes. CFGI publishes separate fear and greed scores for Ethereum and hundreds of other coins, so you can check an altcoin's mood on its own instead of reading it from bitcoin's (source: CFGI, Crypto Fear and Greed Index by Coin). Alternative.me says it plans separate indexes for large altcoins.
How often is the crypto fear and greed index updated?
Alternative.me updates its index once a day and shows a countdown to the next update on its page. CFGI refreshes its scores every 15 minutes (source: CFGI), and CoinMarketCap shows the time of its latest update beside the score, so you can see how fresh a reading is.
Can I get fear and greed index data through an API?
Both main providers offer free access. Alternative.me's API returns the latest reading, or the full daily history since 2018 if you set the limit to zero, and allows commercial use as long as you credit the source next to the data (source: Alternative.me). CoinMarketCap offers its index through its API as well, with an endpoint for historical values (source: CoinMarketCap).
Can you use the fear and greed index for day trading?
Alternative.me's index changes only once a day, so it misses moves inside the day, and a day trader would see the same number all session. For short-term trades, traders tend to watch faster data instead: price action, funding rates, open interest and liquidations, which change by the minute on a perpetual contract. The daily index works better as background for how much risk to take that day.
Researched and written by the BloFin Academy editorial team with AI-assisted drafting. All facts independently verified. Primary sources include Alternative.me, CoinMarketCap, Coin Metrics, CFGI, CNN, Berkshire Hathaway, Milk Road, TRM Labs, Decrypt, Bitcoin.com News and BloFin, current as of November 2, 2026.
Nothing in this article constitutes financial advice, and nothing in it is a recommendation to buy, sell or hold bitcoin or any crypto asset. The fear and greed index describes past market mood and has not reliably predicted prices: new spells of Extreme Fear were followed by further falls more often than by gains. Extreme readings come with the biggest daily swings, and a leveraged position on those days can lose most of its margin or be liquidated. BloFin services are not available in restricted locations, including the United States. Past performance does not indicate future results. Do your own research and consider your risk tolerance before you trade on BloFin.