
Every ounce of silver comes from somewhere and ends up somewhere, and the yearly tally of those flows is one of the most quoted numbers in metals. Miners, coin dealers and traders all point to it. Many of them use it to argue that a shortage has to push the price higher.
The market has run a deficit because demand grew in years when mines could barely respond. Most silver is dug up as a side effect of mining for other metals, so output follows those metals. That part of the story holds up well. The next step, from a shortfall to a higher price, holds up far less well. The price has risen in deficit and surplus years alike, and over a short record it has moved more closely with fund flows than with the balance.
To read the tally well, you need to know what each line measures, who counts it and how often the count changes. It also helps to look at the years when the usual story failed, since those years teach more than the ones that fit.
BloFin offers silver through the XAGUSDT Perpetual, a contract settled in USDT that leaves you with no metal to store. Supply and demand figures arrive too rarely to time a trade on it. They do tell you what the arguments around its price are really about.
What is silver supply and demand?
Silver supply and demand is the yearly count of metal coming to market from mines, recyclers, producer hedging and government sales, set against metal taken by industry, jewelry, silverware, photography, and coins and bars. In 2025, supply reached 1,090.4 million ounces, demand reached 1,130.6 million, and the 40.3 million gap was the market deficit (source: Silver Institute, World Silver Survey 2026).
Subtract the two totals and you get 40.2, a rounding difference inside the survey's own table. The survey comes out each April from the Silver Institute, an industry group, using data from the research firm Metals Focus. Many deficit figures in the press trace back to it, though banks such as Deutsche Bank publish their own forecasts. So when two articles disagree, check first whether they quote different editions or different forecasters.
The count is back in the news because of what Metals Focus said at the end of October 2026. Reports of its latest research say it expects the 2026 deficit to narrow further and the market to move into surplus in 2027 (source: Kitco, October 29, 2026). That is a big change of tone for a market with five straight years of deficit behind it.
Where silver comes from: Mine output by country
Mines supplied 846.6 million ounces of silver in 2025, about 78% of all supply. Mexico leads with about a fifth of that output, followed by Peru and China, and those three countries together account for roughly half of the world's mined silver, based on the Silver Institute's country table (source: Silver Institute, World Silver Survey 2026).
Country | 2025 output, million ounces | Share of world |
|---|---|---|
Mexico | 172.9 | 20.4% |
Peru | 130.6 | 15.4% |
China | 112.8 | 13.3% |
Russia | 56.0 | 6.6% |
Bolivia | 49.9 | 5.9% |
Chile | 42.7 | 5.0% |
Poland | 42.6 | 5.0% |
United States | 35.7 | 4.2% |
Australia | 32.9 | 3.9% |
Argentina | 22.1 | 2.6% |
All countries | 846.6 | 100% |
A second count gives a slightly different picture. The US Geological Survey estimates 2025 world output at 26,000 tonnes, or about 835.9 million ounces (source: US Geological Survey, Mineral Commodity Summaries 2026). It puts Mexico at 6,300 tonnes, about 202.5 million ounces, which is roughly 30 million above the Silver Institute's figure. Both counts have Mexico first and Peru ahead of China, so the ranking is firm. They disagree on Mexico's direction in 2025, though: USGS estimates a rise from 5,780 tonnes, while the survey shows a fall from 181.1 million to 172.9 million ounces.
Why silver mining is slow to react to price
Silver mining reacts slowly to price because about three-quarters of mined silver is a by-product of mines run for lead, zinc, copper or gold. Those mines expand when their main metal pays, and a 41.6% rise in the average London price in 2025 came alongside only a 2.8% rise in mine output (source: Silver Institute, World Silver Survey 2026).
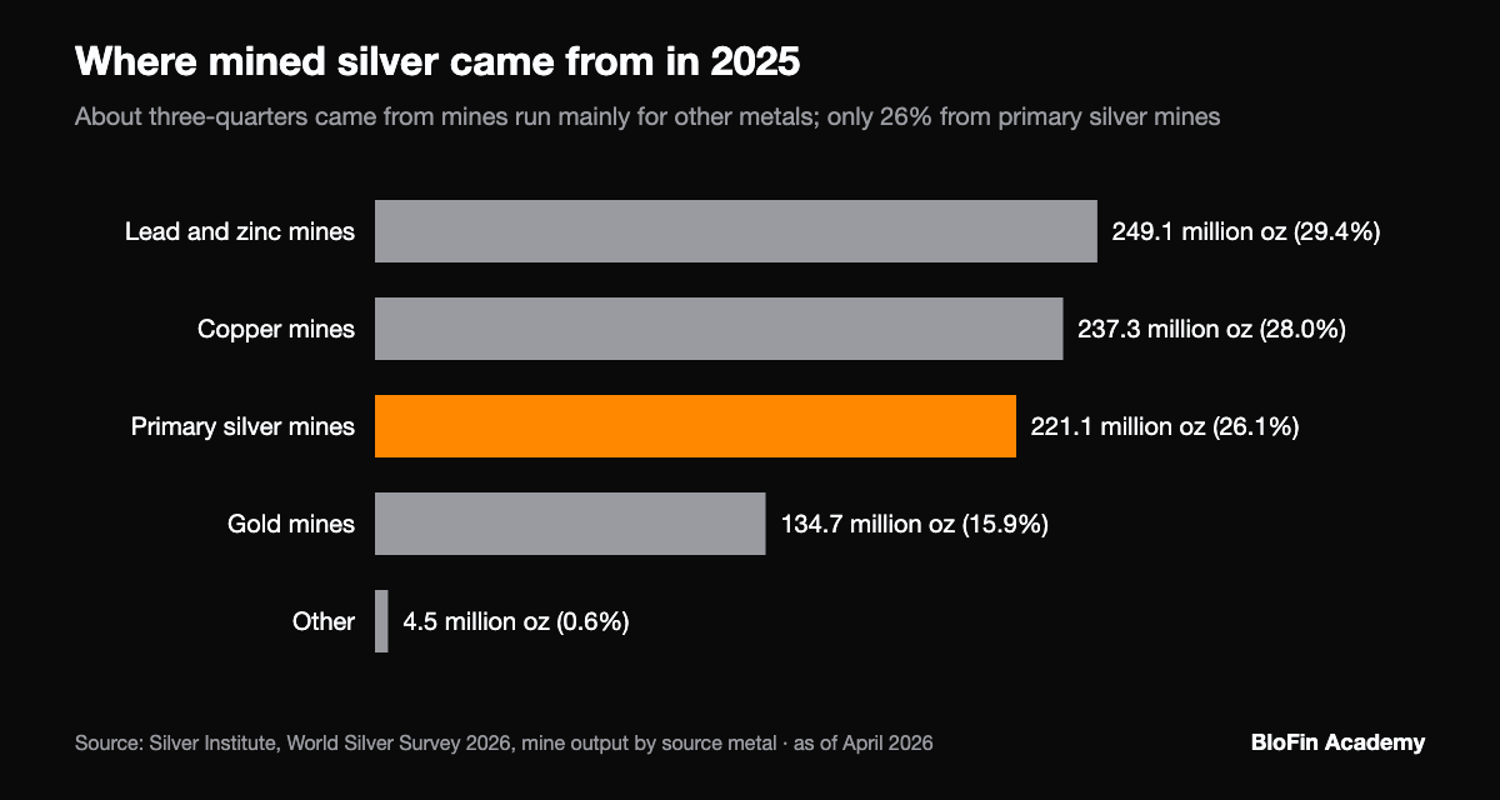
Primary silver mines, the ones that exist for the silver itself, supplied only 26% of output in 2025, and their output fell for a third year. Lead and zinc mines gave 29.4%, copper mines 28% and gold mines 15.9% (source: Silver Institute, World Silver Survey 2026). So the manager deciding whether to dig more is usually watching a copper or zinc price. Silver is a welcome extra.
That explains why output has barely moved over a long stretch. Between 2017 and 2025, mine output slipped 1.9% while the yearly average London price rose 134.8%. The link to other metals can also help silver. In 2025, silver from copper mines rose 6% and silver from gold mines rose 5%, and the survey credits project ramp-ups in Chile and higher grades in Peru for part of the gain (source: Silver Institute, World Silver Survey 2026).
Even a mine that wants more silver has to wait. The survey says that adding reserves at existing mines or new projects typically takes at least 18 to 24 months, and that comes before the extra ore is dug and processed (source: Silver Institute, World Silver Survey 2026). A price spike can come and go inside that window.
Recycling, hedging and official-sector silver
Three smaller lines make up the rest of silver supply: recycling at 197.6 million ounces in 2025, net producer hedging at 44.7 million and net government sales at 1.5 million. Recycling's most price-sensitive parts respond directly, because high prices encourage people to sell old jewelry and silverware back (source: Silver Institute, World Silver Survey 2026).
That response has limits, as 2025 showed. Jewelry recycling rose 6% and silverware recycling 7%, yet the total rose only 1.6% despite the jump in price. The survey says refinery bottlenecks and high lease rates capped volumes. Recycling is still up 22.8% since 2017, and the survey forecasts 211.3 million ounces for 2026, the highest since 2012 (source: Silver Institute, World Silver Survey 2026).
Hedging explains more of the recent tally than its size suggests. A miner can lock in a price by selling future output in advance or by using options, and the survey counts net additions to that hedge book as supply. The global hedge book rose from a multi-decade low to about 50 million ounces in 2025, and the survey expects only 10 million of net hedging supply in 2026 (source: Silver Institute, World Silver Survey 2026).
Central banks barely appear in the silver count, which is the sharpest contrast with central-bank gold buying. The Bank of England keeps gold in London's vaults but holds no silver at all (source: LBMA, London vault data). The US Treasury's stock is listed at just 498 tonnes, or about 16 million ounces (source: US Geological Survey, Mineral Commodity Summaries 2026).
Russia is the case people cite as a change. A sponsored 2024 article in The Jerusalem Post said Russia's draft budget included silver purchases for the first time, relaying an Interfax report cited by Bloomberg. It also said details of the volume were scarce (source: The Jerusalem Post, October 2024). The survey's 2025 table still shows governments as tiny net sellers, so any such buying does not show in the count.
Who buys silver: Demand by category
Industry is silver's biggest buyer, taking 657.4 million ounces in 2025, or 58.1% of demand before fund buying. Coins and bars took 19.3% and jewelry 16.7%, with silverware and photography well behind. Photography, once a major use, is down to 24.2 million ounces, a multi-decade low (source: Silver Institute, World Silver Survey 2026).
Category, million ounces | 2024 | 2025 | 2026 forecast (April) |
|---|---|---|---|
Industrial | 679.0 | 657.4 | 639.6 |
Jewelry | 205.1 | 189.3 | 159.4 |
Coins and bars | 190.9 | 217.7 | 257.6 |
Silverware | 53.5 | 42.1 | 33.5 |
Photography | 25.5 | 24.2 | 22.5 |
Net hedging demand | 3.5 | 0.0 | 0.0 |
Total | 1,157.4 | 1,130.6 | 1,112.6 |
Total demand fell in 2025 and is forecast to fall again in 2026. So the recent deficits rest on supply staying short of demand, even as demand itself shrinks (source: Silver Institute, World Silver Survey 2026).
Industrial use slipped 3% in 2025, the first fall since the pandemic. Solar and the survey's other industrial uses each lost about 11 million ounces. Solar dropped to 186.6 million ounces as makers used less silver per panel. Solar made up 28.4% of industrial use in 2025 and is forecast at 23.6% in 2026 (source: Silver Institute, World Silver Survey 2026). What silver is used for is a long list, from solar cells and data centers to brazing alloys, and each use follows its own cycle.
Investment demand has two parts, and the survey treats them differently. Coins and bars sit inside the demand total. Exchange-traded products, the silver funds, appear as a separate item below the balance. Funds added 278.1 million ounces in 2025, and if you count them in, industry's share falls from 58.1% to 46.7% on a total of 1,408.7 million ounces (source: Silver Institute, World Silver Survey 2026).
India is the buyer to watch in jewelry, silverware and bars. It imported 232.2 million ounces in 2025 (source: Silver Institute, World Silver Survey 2026). Imports over the first nine months of 2026 ran about a third below the same months a year earlier, according to Heraeus analysts (source: Kitco, November 2, 2026). India has since eased its import rules, though Heraeus warned that much of the new allowance is unlikely to be used if local demand stays weak (source: Kitco, November 2, 2026). Those rules sit within the wider picture of silver tariffs and import rules, which governments set for reasons of their own.
The silver deficit by year
The silver market ran small surpluses from 2017 through 2020, then five straight deficits from 2021 through 2025, because demand jumped far more than supply rose. The widest shortfall was 254.0 million ounces in 2022, and the five years add up to about 716 million ounces, with 2025 the narrowest of the run (source: Silver Institute, World Silver Survey 2026).
Year | Supply, million ounces | Demand, million ounces | Balance |
|---|---|---|---|
2017 | 1,024.7 | 971.5 | +53.3 |
2018 | 1,014.7 | 999.7 | +15.0 |
2019 | 1,016.9 | 1,005.8 | +11.1 |
2020 | 981.6 | 929.0 | +52.5 |
2021 | 1,018.7 | 1,102.4 | -83.7 |
2022 | 1,030.1 | 1,284.1 | -254.0 |
2023 | 997.0 | 1,197.0 | -200.1 |
2024 | 1,019.6 | 1,157.4 | -137.9 |
2025 | 1,090.4 | 1,130.6 | -40.3 |
Demand is what opened the gap. It jumped from 929.0 million ounces in pandemic-hit 2020 to 1,284.1 million in 2022, led by coins and bars, jewelry and industry. Supply rose only from 981.6 million to 1,030.1 million. Demand has since fallen back to 1,130.6 million and supply has reached 1,090.4 million, which is why the gap has narrowed (source: Silver Institute, World Silver Survey 2026).
Past years do not stay fixed, because each new survey revises them. The 2022 deficit has read 237.7, 263.5, 249.6 and now 254.0 million ounces across four editions, and 2019 has flipped from surplus to deficit and back. The 2024 shortfall began as a forecast of 215.3 million and now stands at 137.9 million (source: Silver Institute, World Silver Survey 2023; Silver Institute, World Silver Survey 2024; Silver Institute, World Silver Survey 2025).
Deficit in, million ounces | 2024 edition | 2025 edition | 2026 edition |
|---|---|---|---|
2021 | 95.4 | 79.3 | 83.7 |
2022 | 263.5 | 249.6 | 254.0 |
2023 | 184.3 | 200.6 | 200.1 |
2024 | 215.3 (forecast) | 148.9 | 137.9 |
2025 | Not given | 117.6 (forecast) | 40.3 |
So when you compare two deficit figures, check that they come from one edition. A gap between editions can be as large as a change between years. Running totals vary for the same reason, and the survey's own six-year total of 762.1 million ounces includes its 2026 forecast (source: Silver Institute, World Silver Survey 2026).
2026 silver deficit forecasts
Forecasts for the 2026 silver deficit have moved a long way within the year. The Silver Institute said 67 million ounces in February and its April survey said 46.3 million. Metals Focus was reported at the end of October as expecting the deficit to narrow further, with a surplus in 2027 (source: Silver Institute, February 2026 outlook; Silver Institute, World Silver Survey 2026; Kitco, October 29, 2026).
The Silver Institute's newest published number for 2026 is still the April figure of 46.3 million ounces, which is wider than the 40.3 million of 2025. A Kitco report on October 19 put Metals Focus's figures at a 35.4 million ounce deficit in 2026 and a 37.3 million surplus in 2027, so the 2026 figure sits below both (source: Kitco, October 19, 2026). These figures reach readers through news reports of the firm's research rather than a table it has published, so treat them as less settled (source: Economic Times, October 30, 2026). Deutsche Bank reached a similar view earlier in October. It said a surplus could arrive in 2027 and estimated that solar use will fall more than 20% this year (source: Mining.com, October 5, 2026).
In April, the survey said a swing to sustained surplus would take "a rather extreme combination" of changes (source: Silver Institute, World Silver Survey 2026). One surplus year is a smaller claim than a long run of them, so the two views do not strictly clash. Even so, the same firm has moved its timing. In April it saw the deficit eroding over time, and by October it expected a surplus next year, though its analyst Matthew Piggott said the market was not facing an overwhelming surplus (source: Silver Institute, World Silver Survey 2026; Kitco, October 19, 2026).
The record gives a reason to hold any single forecast loosely, and the misses run both ways. Set against the 2026 edition's figures, the 2021 survey expected a 23.3 million ounce surplus for its own year, which now stands as an 83.7 million deficit (source: Silver Institute, World Silver Survey 2021). The next two surveys forecast deficits that were too small, by 182.5 million ounces for 2022 and by 58.0 million for 2023 (source: Silver Institute, World Silver Survey 2022; Silver Institute, World Silver Survey 2023). The two after that were too large, by 77.4 million for 2024 and by 77.3 million for 2025 (source: Silver Institute, World Silver Survey 2024; Silver Institute, World Silver Survey 2025; Silver Institute, World Silver Survey 2026).
Part of the 2025 surprise came from a line few people watch. The 2025 edition forecast 0.9 million ounces of net hedging supply, and 44.7 million arrived. Over the year the deficit narrowed by 97.6 million, with supply up 70.8 million and demand down 26.8 million (source: Silver Institute, World Silver Survey 2025; Silver Institute, World Silver Survey 2026). If you subtract the hedging line and hold everything else fixed, the 2025 gap is about 85 million ounces, more than double the headline. That is plain subtraction, and the survey does not print that figure.
What a deficit has meant for the silver price
The yearly balance has given no reliable reading of the silver price in either direction. The widest deficit, in 2022, came with a 13.6% fall in the average London price, and the narrowest, in 2025, came with a 41.6% rise, yet that price also rose in four of the five deficit years (source: Silver Institute, World Silver Survey 2026).
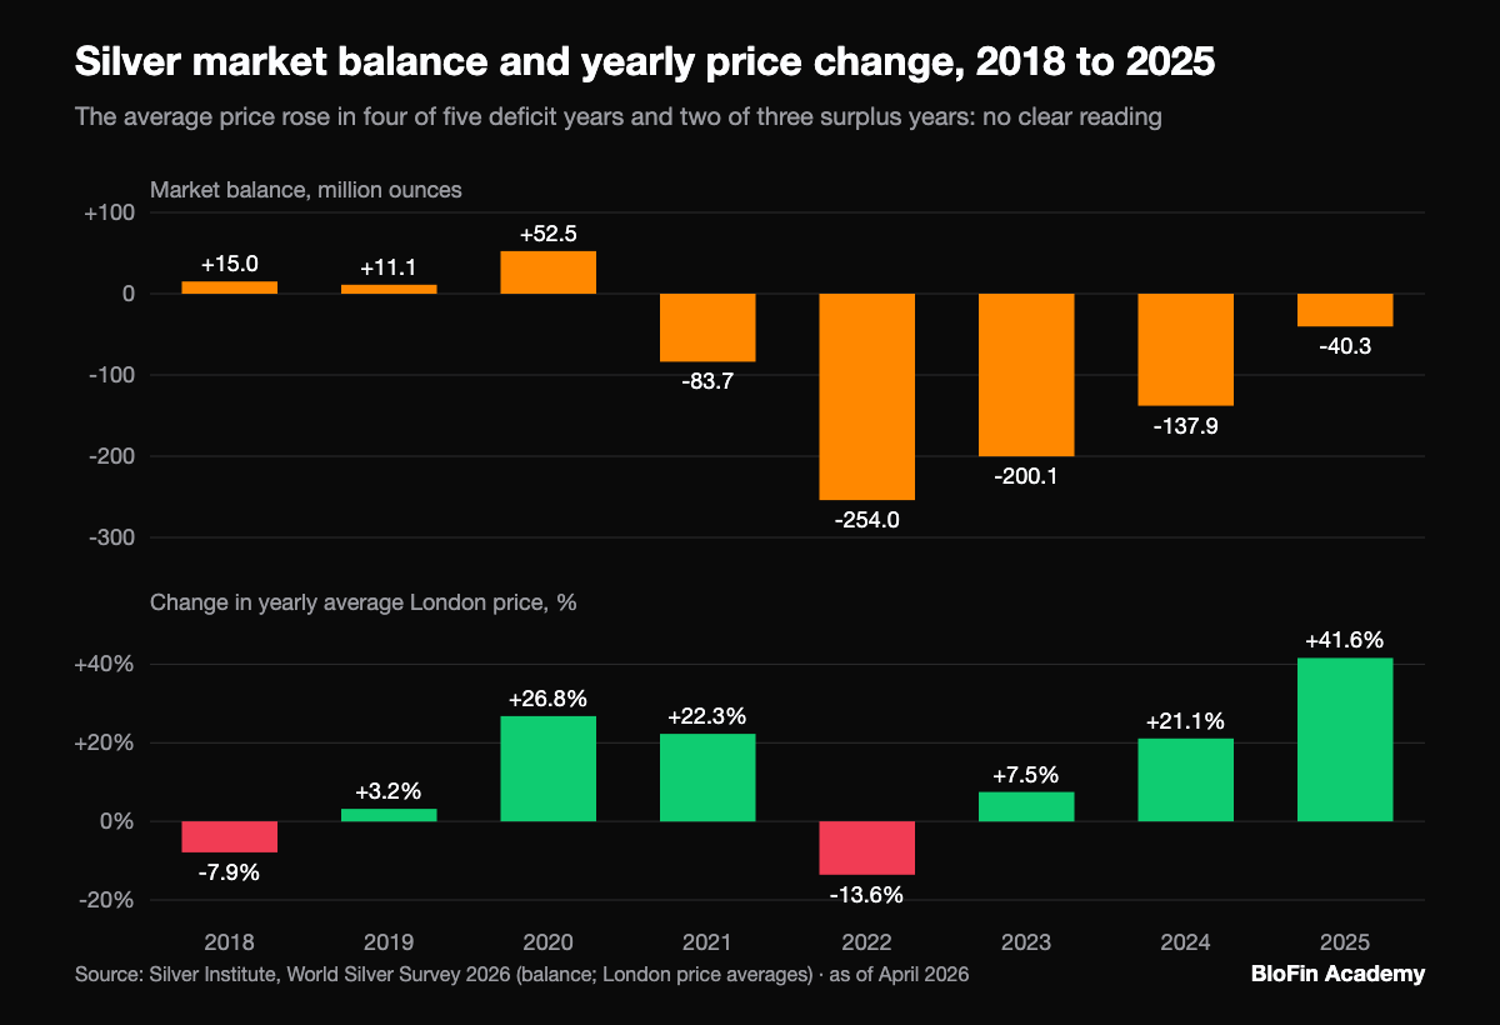
Set the survey's yearly fund flows beside the balance, and the idea that deficits lift the price gets a fairer test (source: Silver Institute, World Silver Survey 2026).
Year | Balance, million ounces | Fund flows, million ounces | Change in average London price |
|---|---|---|---|
2018 | +15.0 | -21.4 | -7.9% |
2019 | +11.1 | +83.3 | +3.2% |
2020 | +52.5 | +331.1 | +26.8% |
2021 | -83.7 | +64.9 | +22.3% |
2022 | -254.0 | -117.4 | -13.6% |
2023 | -200.1 | -37.3 | +7.5% |
2024 | -137.9 | +67.5 | +21.1% |
2025 | -40.3 | +278.1 | +41.6% |
Correlation runs from -1, where two series move in opposite ways, to +1, where they move as one. Across those eight years, the balance and the yearly price change score +0.34, which eight points cannot tell apart from zero. The sign runs against the idea, since it pairs bigger surpluses with bigger rises, and leaving out one year at a time moves the score from -0.04 to +0.59. A simple count leans slightly toward the deficit idea. The average price rose in four of the five deficit years, by 15.8% on average, and in two of the three surplus years, by 7.4% on average. So neither measure gives a reliable reading (source: Silver Institute, World Silver Survey 2026).
Fund flows fit far better against the yearly average price, with a correlation of +0.84 and the same direction in seven of the eight years. The exception is 2023, when funds sold 37.3 million ounces and the average price still rose. A yearly average lags, though: measured December to December on monthly averages, the direction matches in five of the eight and the correlation is +0.78 (source: World Bank Pink Sheet). Eight years is the same small sample, so this is a pattern and leaves the cause open. Rising prices can pull money into funds as easily as fund buying can lift prices.
The survey also shows a second balance that subtracts fund buying, as if funds were one more buyer. On that line, 2020 flips. The headline shows a 52.5 million ounce surplus, but funds bought 331.1 million, which leaves a 278.6 million shortfall. It also makes 2025 the widest shortfall, at 318.4 million. Its correlation with the price change is -0.82, so bigger shortfalls went with bigger rises. The fund flows are built into that line, so it repeats the fund result and adds no new evidence. Eight points cannot carry a strong claim here either (source: Silver Institute, World Silver Survey 2026).
The survey accepts that the link is uneven, saying that "deficits don't matter, until they do" (source: Silver Institute, World Silver Survey 2026). Its example is the squeeze of October 2025. Around 225 million ounces had been added to vaults tied to CME Group, the owner of the COMEX futures market, between December 2024 and early October. Rising fund holdings and a spike in physical demand did the rest. So a deficit can matter by slowly draining the cushion, but the yearly figure cannot tell you when it will start to bite. The balance also gave no protection during silver's fall from its January 2026 high.
Above-ground silver stocks beside the deficit
Above-ground stocks are the silver already mined and refined, and they dwarf a yearly deficit. Identifiable bullion inventories stood at 1,394.5 million ounces at the end of 2025, up 13% in a deficit year, so the 40.3 million shortfall was about 2.9% of those stocks (source: Silver Institute, World Silver Survey 2026).
That count covers only London and the exchange vaults that report, so it can't show all the silver above ground. London held 894.4 million ounces of the total at the end of 2025 and CME vaults 449.4 million, with Shanghai's two exchanges under 50 million combined. The running deficit still matters, since the five-year total of about 716 million ounces equals about 51% of that count (source: Silver Institute, World Silver Survey 2026).
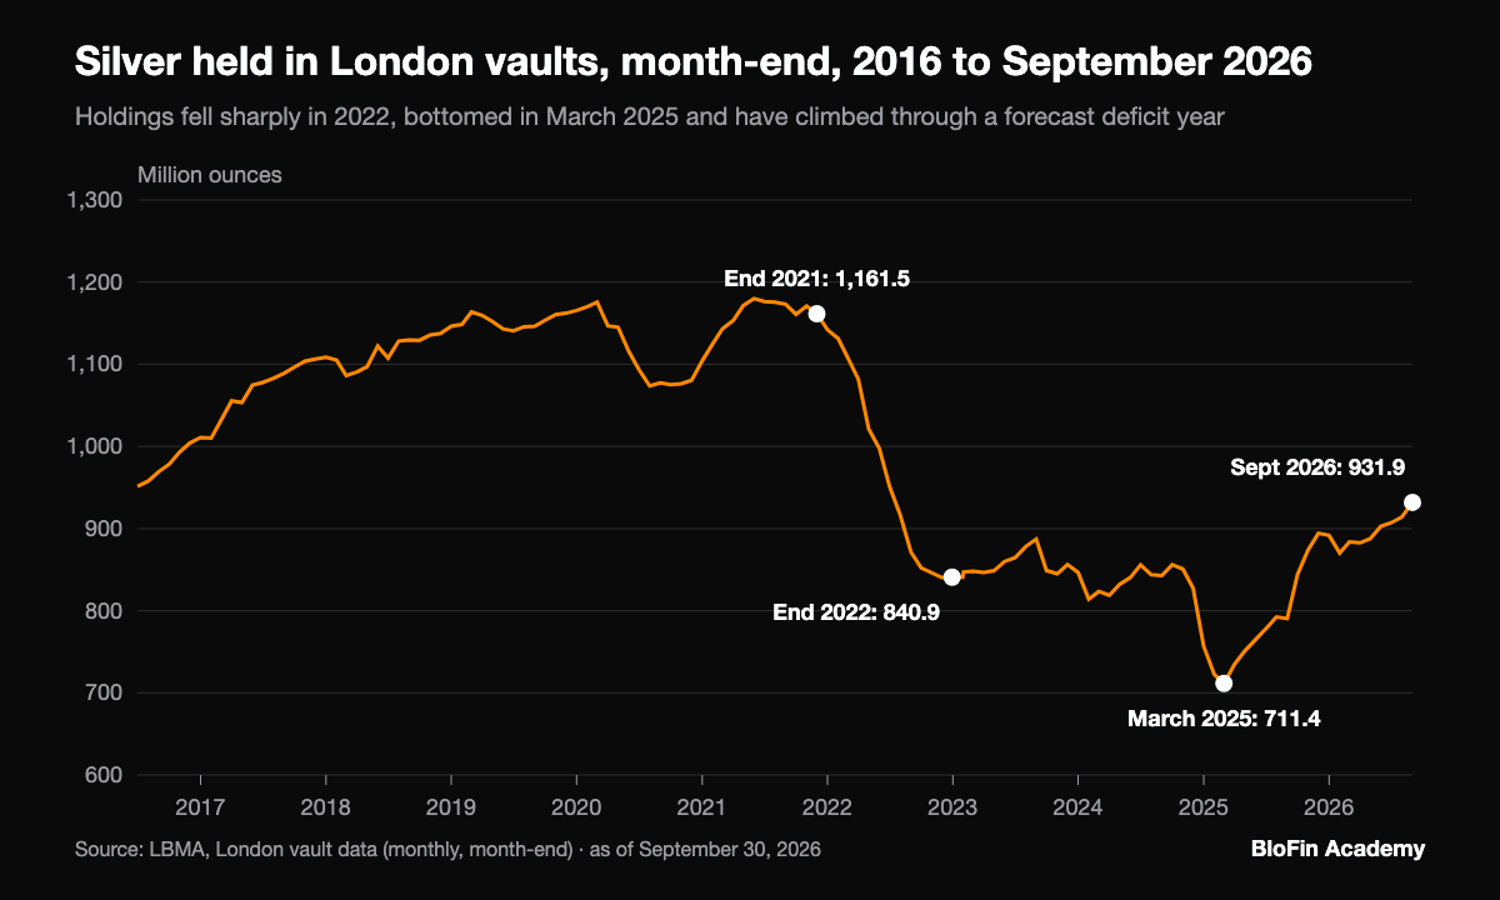
London's vaults show that stocks and the deficit only sometimes move together. Holdings fell 320.5 million ounces in 2022, to 840.9 million, more than that year's 254.0 million deficit. In 2023 they rose 15.3 million despite a 200.1 million deficit, and they hit a low of 711.4 million in March 2025. By September 2026 they had climbed to 931.9 million ounces, or 28,985 tonnes, their highest since July 2022. That is up 37.5 million this year, while the April survey still forecast a deficit (source: LBMA, London vault data).
The stock that counts in a squeeze is the part nobody has already claimed. The survey estimated London's free float at about 136 million ounces as September 2025 closed, when funds held 83% of the vaults (source: Silver Institute, World Silver Survey 2026). Metals Focus now puts metal outside funds at about 267 million, nearly double its October 2025 low (source: Economic Times, October 30, 2026). Deutsche Bank's more than 300 million at the end of August is a separate estimate. It counts metal freely available for purchase, so the figures are not one series (source: Mining.com, October 5, 2026).
For scale, daily spot trading in London averaged roughly 450 million ounces in 2025, so the 2025 deficit equals about 9% of one average day's trading volume (source: Silver Institute, World Silver Survey 2026). That is trading volume, a larger figure than the amount London's banks clear each day (source: LBMA, clearing data). Neither says how much metal could actually be delivered. To test a stock-based argument, read COMEX and LBMA silver inventories vault by vault, because metal moves between those locations.
How much silver has been mined and how much is left
Roughly 58.6 billion ounces of silver have been mined through 2025, according to the Silver Institute's July 2026 ratio report. At 846.6 million ounces, 2025's output added about 1.4% to that total, and the whole historical total equals about 69 years of current mining (source: Silver Institute, gold/silver ratio report).
Much of that metal is gone for practical purposes. The same report says silver has suffered "far greater, practically irrecoverable losses" than gold. That is why the mined ratio of 8.3 to 1 shrinks to 2.87 to 1 for above-ground stocks at the end of 2025. The report gives that ratio with no ounce count for silver alone, so be wary of anyone quoting a precise figure for all the silver left above ground (source: Silver Institute, gold/silver ratio report).
Underground, the US Geological Survey lists world reserves of 610,000 tonnes, about 19.6 billion ounces, or about 23.5 years at its estimate of 2025 output (source: US Geological Survey, Mineral Commodity Summaries 2026). A reserve figure is not a countdown. It counts only ore that pays to mine today, and it can grow as companies drill and as prices rise. Primary silver mines alone report another 7,792.4 million ounces of resources beyond their reserves (source: Silver Institute, World Silver Survey 2026).
Mining costs and the idea of a price floor
All-in sustaining cost, or AISC, is the industry's measure of what it costs a mine to keep producing an ounce, and people often treat it as a price floor. Primary silver mines averaged $12.21 an ounce in 2025 on a by-product accounting basis, against an average London price of $40.03 (source: Silver Institute, World Silver Survey 2026).
The idea has some history behind it. In 2020 spot silver fell to an intraday low of $11.64, its lowest since January 2009 (source: Silver Institute, World Silver Survey 2021). The 2026 edition puts AISC at $11.15 for 2019 and $10.74 for 2020, which leaves that low $0.49 and $0.90 above the line (source: Silver Institute, World Silver Survey 2026). That is one episode, and because the low stayed above both figures, it can't show that the line would have held.
Three things weaken the floor as a trading idea. The figure covers primary mines, about a quarter of output, while the rest of supply comes from mines that care about another metal's price. By-product accounting means the cost falls when gold or copper credits rise. The survey credits record gold prices for much of 2025's cost relief. Regional averages also run from $10.28 in North America to $16.23 in the CIS, the former Soviet region (source: Silver Institute, World Silver Survey 2026).
Today the idea is mostly theoretical. On November 5, 2026, the XAGUSDT Perpetual's mark stood at 53.38 USDT. At about a dollar per USDT, that is roughly 4.4 times the 2025 AISC, so a fall to that level would be a 77.1% drop. That sum measures the gap only, and it says nothing about whether such a move could happen.
Who trades silver
Silver is traded by miners and refiners managing their exposure, industrial buyers securing metal, banks and dealers in London, funds on COMEX, and traders on the Shanghai Futures Exchange. Annual turnover dwarfs physical supply, with Shanghai futures alone turning over 163,935 million ounces in 2025, about 194 times that year's mine output (source: Silver Institute, World Silver Survey 2026).
Market, 2025 | Turnover, million ounces | Multiple of mine output |
|---|---|---|
Shanghai futures | 163,935 | 194 |
LBMA, including swaps, options and leases | 148,448 | 175 |
CME, including Micro | 123,109 | 145 |
Shanghai options | 56,258 | 66 |
Those multiples are why short-term price moves can have little to do with the tally of ounces. Contracts change hands hundreds of times over for every ounce that comes out of the ground. A figure published once a year is only one of many reasons people trade on a given day.
If you would rather trade those moves than watch them, the XAGUSDT Perpetual page shows the live mark price and funding rate before you commit any margin. Funding on the contract settles every four hours. BloFin has no silver spot pair or silver token, so this contract is the silver market on the platform.
Using supply and demand figures when you trade silver
Supply and demand figures work best as background for judging a price story, and they have a poor record as a signal for when to buy or sell. A deficit points to pressure on stocks, though reported vaults have grown in some deficit years, so read vault data, fund flows and leverage beside it.
Most of the useful readings arrive on a schedule you can follow. The Silver Institute publishes an outlook early in the year, the full survey in spring and, in many years, an interim review late in the year (source: Silver Institute, 2025 interim review). LBMA publishes London vault holdings monthly, and the funds publish their own holdings. India's import numbers matter for the months in between, and Heraeus put the fall at about a third over the first nine months of 2026 (source: Kitco, November 2, 2026).
When someone quotes a deficit to you, ask four questions. Which edition is the number from, and has a newer one changed it? Does it include fund buying? How large is it beside the metal in vaults outside fund holdings? And was the claim tested against years when the price went the other way, such as 2022, when the yearly average fell 13.6%? Once you have those answers, read up on how to trade silver from the first deposit to the close.
This tally also sits a long way from the daily quote, since the markets that determine the silver price span spot, futures and benchmark trading. Leverage on a perpetual magnifies moves that have nothing to do with the balance. Liquidation of a position goes by the mark price, which means it can close out long before a slow supply story has had time to play out.
Looking to trade silver? To get started, you'll need to first create a BloFin account, fund your account with cryptocurrency, and navigate to the XAGUSDT Perpetual trading page.
Frequently asked questions
Which company mines the most silver?
Fresnillo was the largest silver miner in 2025, with 47.6 million ounces, or 5.6% of world output. KGHM came next at 43.3 million, then Polymetal and Newmont at 28.0 million each, and Southern Copper at 24.2 million (source: Silver Institute, World Silver Survey 2026). Several of those names are mainly copper or gold producers, which shows the by-product pattern at company level.
Is there a physical silver shortage right now?
London's vaults do not point to one. They held 931.9 million ounces at the end of September 2026 (source: LBMA, London vault data), of which Metals Focus puts about 267 million outside funds, nearly double its October 2025 low (source: Economic Times, October 30, 2026). Deutsche Bank's head of metals research wrote that "peak silver scarcity is clearly in the rear-view mirror" (source: Mining.com, October 5, 2026). The survey argued in April that global stocks were still declining, even though its count of reporting vaults rose 13% in 2025, and that the era of virtually unlimited liquidity had ended (source: Silver Institute, World Silver Survey 2026).
Could the silver market move into surplus?
Yes, and Deutsche Bank and Metals Focus both raised that for 2027 in October 2026. The market last ran a surplus in 2020. The case rests on solar makers cutting silver use and on weak jewelry (source: Economic Times, October 30, 2026). The April survey already had solar demand falling 19% to 151.0 million ounces in 2026, with recycling up 7% (source: Silver Institute, World Silver Survey 2026).
Does mined silver ever get lost for good?
Some of it does, and far more of silver than of gold, by the Silver Institute's account. That is why its gold-to-silver ratio for metal above ground sits so far below its ratio for all metal mined (source: Silver Institute, gold/silver ratio report). Recycling returned 197.6 million ounces in 2025, equal to about 17.5% of that year's demand (source: Silver Institute, World Silver Survey 2026).
Does a high silver price reduce demand?
For some buyers it clearly does, and for others it has not. In 2025, jewelry fell 8% and silverware 21%, and the survey ties both to higher prices and expects further drops in 2026. Solar makers also sped up cutting the silver in each panel as costs rose. Coins and bars rose 14% in the same year, and funds took in 278.1 million ounces, so investors kept buying as the price climbed (source: Silver Institute, World Silver Survey 2026).
Researched and written by the BloFin Academy editorial team with AI-assisted drafting. All facts independently verified. Primary sources include the Silver Institute's World Silver Surveys and gold/silver ratio report, the US Geological Survey, LBMA and BloFin's XAGUSDT Perpetual page, current as of November 5, 2026.
Nothing in this article constitutes financial advice, and nothing in it is a recommendation to buy, sell or hold silver in any form. Deficit figures and forecasts are revised often and have missed by wide margins, and a deficit has not reliably meant a higher price. On the XAGUSDT Perpetual, leverage can magnify losses and lead to liquidation, and funding can cost a long position every four hours. Past performance does not indicate future results. Do your own research and consider your risk tolerance before you trade on BloFin.