
Most people judge the stock market by a handful of names. When Nvidia, Alphabet and Meta drop 13% to 19% in a month, the screens turn red and the headlines talk about a sell-off. It feels as if everything is going down with them.
That is close to what happened between October 5 and November 3, 2026. Technology stocks fell 12.2% and Alphabet fell 19.2%, yet nine of the 11 sectors in the S&P 500 rose. Healthcare and consumer staples each gained almost 10%, and Walmart gained 18.8% (source: calculated from Yahoo Finance data). Reuters described the same shift in mid-October, reporting that investors worried about AI stocks had moved into Eli Lilly, UnitedHealth and other healthcare and consumer names (source: Reuters via The Star, October 16, 2026).
Traders call this sector rotation. If you only watch the largest AI stocks, a rotation can look like a crash. You also need to know how far to trust the pattern, because the popular version, where defensive stocks such as drugmakers and grocers rise whenever AI stocks fall, holds far less often than people think.
BloFin lists perpetual contracts on both sides of this split, from the QQQUSDT Perpetual on the Nasdaq 100 to single stocks in healthcare, consumer and financials, all settled in USDT.
What is sector rotation?
Sector rotation is when leadership in the stock market moves from one group of industries to another, so some sectors rise while others fall. Investors usually tie it to changes in growth, inflation, interest rates or faith in a theme. An index can look weak during a rotation even when most sectors are rising.
The stock market is split into 11 sectors under a system called the Global Industry Classification Standard (GICS): energy, materials, industrials, consumer discretionary, consumer staples, health care, financials, information technology, communication services, utilities and real estate. Each one has an exchange-traded fund (ETF) that tracks it, such as XLK for technology and XLV for health care, so the moves are easy to compare (source: TrendSpider, Sector Rotation).
Investopedia defines rotation as money moving from one industry to another as investors anticipate the next stage of the economic cycle (source: Investopedia, Sector Rotation). That is the standard definition, but a price chart only shows which groups did better. IG points out that sector comparisons measure how far one group beat or lagged the index, and that is different from measuring the money that moved (source: IG, November 1, 2026). Every share sold also has a buyer, so "money rotated into healthcare" is shorthand for healthcare buyers being more eager than sellers. It is a useful way to describe a price pattern, and you should treat it as that.
Say you hold a tech fund and a healthcare fund, and tech falls 12% in a month while healthcare rises 10%. Your screen shows a loss on one and a gain on the other, while an index that holds both barely moves. That is a rotation in its simplest form: the same news, read differently by two groups of investors.
Sector rotation vs a stock market crash
The quickest way to tell the two apart is to count the sectors going down. In a broad sell-off, almost everything falls together, because investors are selling stocks in general. From February 19 to April 8, 2025, all 11 sectors fell, and even consumer staples, the strongest of them, lost 5.9%. In the rotation of October 2026, only technology and communication services fell (source: calculated from Yahoo Finance data).
The two call for different responses. A sell-off is a question about stocks as a whole, so it matters to almost anyone who holds them. A rotation is a question about which stocks you hold, so the same month can be painful for an AI-heavy portfolio and good for one full of drugmakers and retailers. A rotation can still turn into a sell-off, and the sector count would show it, with more sectors going red and the defensive groups starting to fall.
Why can the S&P 500 fall while most sectors rise?
The S&P 500 can fall while most sectors rise because it is weighted by company size. The largest companies count for far more than the smallest, so a sharp drop in a few giants can outweigh gains across hundreds of smaller stocks, and most of those giants are tech or internet companies.
The Magnificent Seven, meaning Nvidia, Microsoft, Apple, Alphabet, Amazon, Meta and Tesla, made up about 34.8% of the S&P 500's market value on October 13, 2026 (source: Benzinga, October 14, 2026). Say you want to check how much those seven stocks matter. Take a group that makes up 35% of an index and let it fall 6.5%, which is what an ETF tracking the seven did from October 5 to November 3. The drop alone takes about 2.3 points off the index, because 0.35 times 6.5 is about 2.3. The S&P 500 ETF fell 2.6% over the same stretch, so seven stocks explain most of the headline (source: calculated from Yahoo Finance data). The Nasdaq 100 ETF (QQQ), which holds more tech, fell harder at 9.4%, and a chip-stock ETF (SMH) fell 18.2%.
The seven-stock ETF holds them in similar amounts, while the index gives them different weights, so treat 2.3 as a rough figure. The point still holds: the headline number was mostly about seven companies, and the other 493 were doing something quite different. This is why "the market is down" and "most stocks are down" can be two different claims, and why it pays to check which one you are reading.
Equal-weight S&P 500 vs the S&P 500
The equal-weight S&P 500 holds the same companies at about the same weight, which works out at roughly 0.2% each, and it resets those weights every quarter (source: Invesco, RSP). Because Nvidia counts for no more than a mid-sized insurer, the index shows what the typical stock is doing.
From October 5 to November 3, 2026, the equal-weight ETF (RSP) rose 3.9% while the regular S&P 500 ETF (SPY) fell 2.6%. That 6.5-point gap is the widest of the 59 periods of about a month we measured since November 2021, each one starting where the last ended. Measured from any start date, the only earlier month that came close was the one to August 7, 2024, at about the same 6.5 points (source: calculated from Yahoo Finance data). IG measured a similar split over a slightly different window, with the S&P 500 down 1.1% and its equal-weight version up 4.4% in the four weeks to October 30 (source: IG).
BloFin lists the SPYUSDT Perpetual on the S&P 500 ETF, and the QQQUSDT Perpetual follows the tech-heavy Nasdaq 100 through QQQ, so you can watch both from one account.
Sectors that rose and fell in October 2026
Nine of the 11 S&P 500 sectors rose between October 5 and November 3, 2026, led by healthcare, consumer staples and utilities, while technology and communication services fell. The S&P 500 ETF still lost 2.6%, because the two falling sectors hold many of the index's largest companies.
Here is each sector's ETF over that period and over the sell-off of early 2025. The returns include dividends (source: calculated from Yahoo Finance data):
Sector (ETF) | Sell-off: Feb 19 to Apr 8, 2025 | Rotation: Oct 5 to Nov 3, 2026 |
|---|---|---|
Health care (XLV) | −8.8% | +9.9% |
Consumer staples (XLP) | −5.9% | +9.8% |
Utilities (XLU) | −8.3% | +8.6% |
Real estate (XLRE) | −11.8% | +7.4% |
Consumer discretionary (XLY) | −21.8% | +6.3% |
Materials (XLB) | −17.0% | +6.2% |
Financials (XLF) | −15.5% | +6.1% |
Energy (XLE) | −16.3% | +5.1% |
Industrials (XLI) | −15.8% | +0.7% |
Communication services (XLC) | −17.7% | −9.1% |
Technology (XLK) | −25.7% | −12.2% |
S&P 500 (SPY) | −18.8% | −2.6% |
Nine of the 11 sectors gained between October 5 and November 3, 2026, but the S&P 500 still lost 2.6% because technology and communication services fell.
Sector labels also hide a lot. Home Depot rose 18.7%, Nike 13.3% and McDonald's 12.9%, but Bank of America fell 8.0% in a financial sector that gained 6.1%, while JPMorgan rose 2.2%. Within the Magnificent Seven the spread was just as wide: Alphabet fell 19.2%, Meta 16.3% and Nvidia 13.5%, while Apple, Amazon and Microsoft barely moved and Tesla rose 5.2% (source: calculated from Yahoo Finance data).
Several things drove the fall in tech. September's consumer price index rose 3.7% from a year earlier, against 3.6% expected, which raised fears that the Federal Reserve would keep rates high. Memory-chip stocks also sold off on fears of new competition from China's CXMT. Investors grew worried too about how much tech companies were borrowing for the AI buildout (source: CNBC, October 17, 2026). How the FOMC meeting works covers how markets price a Fed decision, and the AI bubble debate covers the spending worries.
Healthcare hit an all-time high during trading on October 20, helped by Eli Lilly, which was up 4.7% at midday and reached a record high (source: Reuters via Kitco, October 20, 2026).
A rotation also need not mean big investors are leaving the old leaders. Goldman Sachs data on its hedge fund clients showed their net bets on the Magnificent Seven, meaning long positions minus short positions, rising from about 15% of their US holdings in July to 22% by October 5 (source: StockCharts, October 9, 2026). That is the day this rotation's window opens.
Do defensive stocks rise when AI stocks fall?
Defensive stocks usually fall less than tech when tech drops, but they do not reliably rise. Over about five years, staples, healthcare and utilities finished higher in only five to eight of tech's 14 down periods, and they also rose in most of tech's up periods. They move largely independently of tech.
Defensive stocks are companies whose sales hold up when the economy weakens, such as drugmakers, grocers and power companies. We split about five years to November 3, 2026 into 59 periods of 21 trading days. Then we looked at each sector whenever technology (XLK) rose or fell by more than 3% (source: calculated from Yahoo Finance data):
Sector (ETF) | Correlation with tech | Higher when tech rose over 3% (25 periods) | Higher when tech fell over 3% (14 periods) | Beat tech when it fell over 3% |
|---|---|---|---|---|
Consumer staples (XLP) | 0.02 | 16 | 6 | 13 |
Utilities (XLU) | 0.09 | 17 | 8 | 12 |
Health care (XLV) | 0.18 | 16 | 5 | 14 |
Financials (XLF) | 0.32 | 19 | 5 | 13 |
Consumer discretionary (XLY) | 0.60 | 16 | 3 | 10 |
Correlation runs from 1, where two things move together, to −1, where they move in opposite ways. Numbers near zero, like those for staples and utilities, mean tech's direction told you almost nothing about theirs. If these sectors really moved against tech, you would see negative figures and you would see them fall in most of tech's good months. Neither shows up.
What they do offer is a smaller loss. In tech's weak periods, healthcare beat tech 14 times out of 14 and staples 13 times, even though each finished higher less than half the time. That is why people call them defensive. It also explains the cost of holding them: since November 24, 2021, technology has returned about 115%, against 51% for healthcare and 39% for staples (source: calculated from Yahoo Finance data).
So October 2026 was unusual. Staples, healthcare and utilities all rose while tech fell more than 3% in only four of the 14 periods, and the average gap between those three sectors and tech, at 21.6 points, was the widest of all 59. The next widest was 12.9 points, in the period ending July 7, 2026. Shifting the start dates changes the numbers but not the ranking. This move peaked at about 24 points in the month to November 2, 2026, against about 18.7 points for the widest earlier month, the one to August 7, 2024.
Staples, healthcare and utilities beat tech by an average of 21.6 points in the 21 trading days to November 3, 2026, the widest of 59 periods since November 2021.
How long a sector rotation lasts
A rotation has no set length, and a big gap has told you little about what comes next. Defensive sectors beat tech by more than 5 points in 10 earlier periods. They beat it again in the next period only five times, a coin flip on a small sample (source: calculated from Yahoo Finance data). StockCharts makes the same point about timing, warning that one week of relative performance is too little to establish a change in leadership (source: StockCharts).
The three earlier periods when all three defensive sectors rose while tech fell more than 3% each ended differently. After the period ending July 31, 2024, the pattern carried on, with staples up 5.2% in the next period and tech down 0.6%. After the period ending March 4, 2025, tech fell another 3.9% and healthcare fell 2.2%, as the sell-off that began on February 19 deepened into April. After the period ending July 7, 2026, the move reversed: tech rose 3.8% while utilities fell 4.5%. Three cases point three ways, so a strong month for defensive stocks is a description of the past month and little more.
Sector rotation and the business cycle
The classic theory says different sectors lead at different stages of the economic cycle, because their profits depend on growth, interest rates and consumer confidence. Investors try to move early, since markets tend to look three to six months ahead. In practice, those stages are only clear in hindsight.
Investopedia lays out the textbook version like this (source: Investopedia):
Economic stage | What the economy looks like | Sectors that have tended to do well |
|---|---|---|
Early recovery | Confidence rising, industrial production growing, rates at their low | Industrials, basic materials, energy |
Late recovery | Rates rising fast, confidence starting to slip, production flat | Energy, consumer staples, services |
Early recession | Confidence at its worst, production falling, rates at their peak | Services, utilities, cyclicals and transports |
Full recession | GDP shrinking, rates falling, profits under pressure | Cyclicals and transports, technology, industrials |
The model is a useful map, and it has real limits. The US has had 12 business cycles since 1945, averaging about six years each, which is a thin record for any rule (source: Fidelity, Sector Rotation Strategies). The official call on when a recession ended can arrive more than a year late, according to Investopedia. Fidelity also warns that a rotation strategy can bring bigger swings and can lag the broad market, and that industries within one sector can have quite different drivers.
October's move also fits the map only partly. Staples and utilities appear in its later stages, but healthcare, the strongest sector, appears in none of them. Much of October's story was also specific to AI, such as chip competition and debt, and no chart of the business cycle would have shown you that. Earnings play a part too, since earnings season can shift the leaders within weeks. Rotations can come from a theme falling out of favor just as easily as from a turn in the economy.
How to spot sector rotation
You can spot sector rotation by comparing the index with its equal-weight version, then checking how many sectors are up and how many stocks are above their long-term average. You need only free charts, and four checks will tell you whether a falling index is a rotation or a broad decline.
Start with the two versions of the S&P 500. Open the SPY chart and add RSP as a comparison. Both lines then show percentage change from the same starting point. If RSP is holding up or rising while SPY falls, the weakness sits in the largest companies, as it did in October when the two finished 6.5 points apart. If both drop hard together, as they did in early 2025, when SPY lost 18.8% and RSP lost 16.0%, the selling is broad (source: calculated from Yahoo Finance data).
Next, count the sectors. Most finance sites show all 11 on one page, so check how many are green over the past month. Nine of 11 suggests rotation, and 11 of 11 falling suggests a sell-off. Then check breadth, which means how many stocks are taking part in a move. A common measure is the share of S&P 500 stocks trading above their 200-day moving average. IG put it at 59% at the end of October, up from 41% at the start of the month, even as the index fell (source: IG).
Finally, look at relative strength, which is one price divided by another. A chart of XLV divided by XLK rises when healthcare is beating tech and falls when tech is beating healthcare, whatever the market as a whole is doing. If that line has climbed for a few weeks, the leadership change has some substance. If it turned up only days ago, it is too early to read much into it, since a single week says little about who leads next (source: StockCharts). Even after big gaps, the leaders stayed ahead in the next period only about half the time.
None of these checks tells you what happens next. They tell you what kind of market you are looking at today, which helps you avoid selling everything because of a headline about seven stocks.
How to trade sector rotation on BloFin
BloFin lists USDT-settled perpetual contracts on US stocks and index ETFs across several sectors, so you can go long or short either side of a rotation from a crypto balance. Each contract has its own leverage limit and funding payments, and stock market hours affect how it trades.
Group | Perpetuals on BloFin | Maximum leverage |
|---|---|---|
Health care | 20x | |
Consumer | 20x | |
Financials | 20x | |
Energy | 10x | |
AI and large tech | 20x | |
AI and large tech | 50x | |
Index ETFs | Nasdaq 100 (QQQ), Russell 2000 (IWM) | 20x |
Index ETFs | S&P 500 (SPY) | 50x |
A perpetual contract follows an asset's price and has no expiry date. Going long profits if the price rises, and going short profits if it falls. Funding is a fee that longs and shorts pay each other to keep the contract close to the stock price. It is paid every eight hours on the LLYUSDT Perpetual, so it can cost or pay you for as long as you hold. Outside the stock market's regular hours, these contracts can see limited price movement and thin liquidity, and BloFin may restrict orders to reduce-only, which means you can only close a position (source: BloFin, stock futures trading hours).
A rotation can be traded in two common ways. You can go long a stock in the group you think will keep leading. Or you can pair a long in one group with a short in the other, say long the LLYUSDT Perpetual and short the QQQUSDT Perpetual, so the result depends on the gap between them. A pair like that still carries market risk, because QQQ tends to move further with the market than healthcare stocks do. In the 59 periods of 21 trading days measured earlier, an equal-sized long on the healthcare ETF and short on QQQ swung more than either ETF alone. It also lost money in 27 of the 39 periods when the S&P 500 rose (source: calculated from Yahoo Finance data). Each side pays or receives its own funding and can lose money on its own. A single stock can also move against its sector, as Bank of America did in October.
Position size matters more here, because a rotation can reverse. Say you open a 1,000 USDT long on the LLYUSDT Perpetual at 5x, which ties up 200 USDT of margin and, at about $1,420, comes to about 70 contracts of 0.01 share each. If the stock gives back 10%, which is about what the whole healthcare sector gained in a month, you lose about 100 USDT, or half your margin. A stop-loss on BloFin sets that exit in advance, and how leverage and liquidation work shows how far the liquidation price sits at different leverage levels.
How to open a stock or ETF perpetual on BloFin
Step 1: Create your BloFin account and send USDT to it. A deposit lands in your Funding Account, so move the USDT to your Futures Account with Transfer, found under Assets.

Step 2: Hover your cursor over the TradFi tab and select Futures.
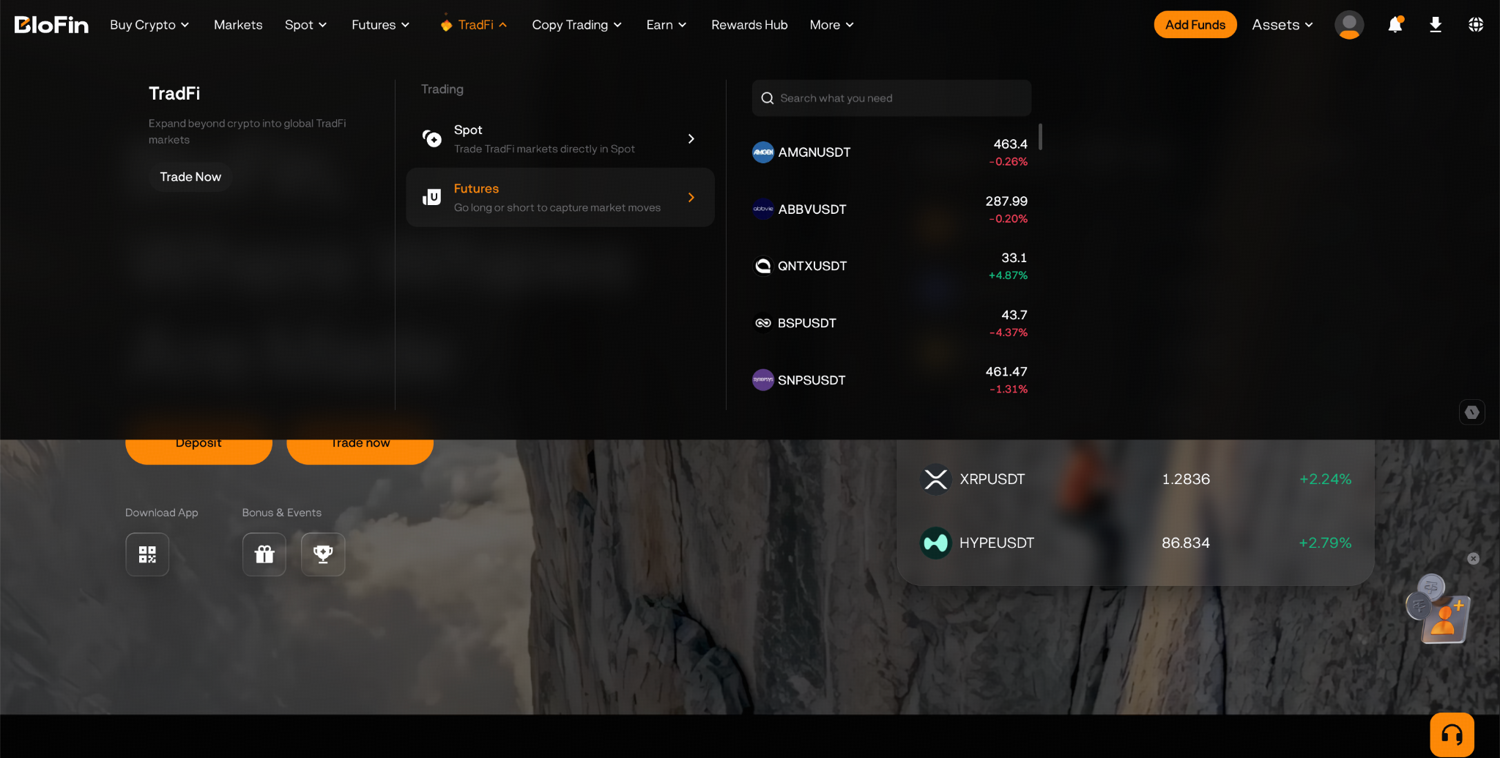
Step 3: Click on the trading pair at the top left corner and search for the stock or ETF, such as LLY or QQQ.
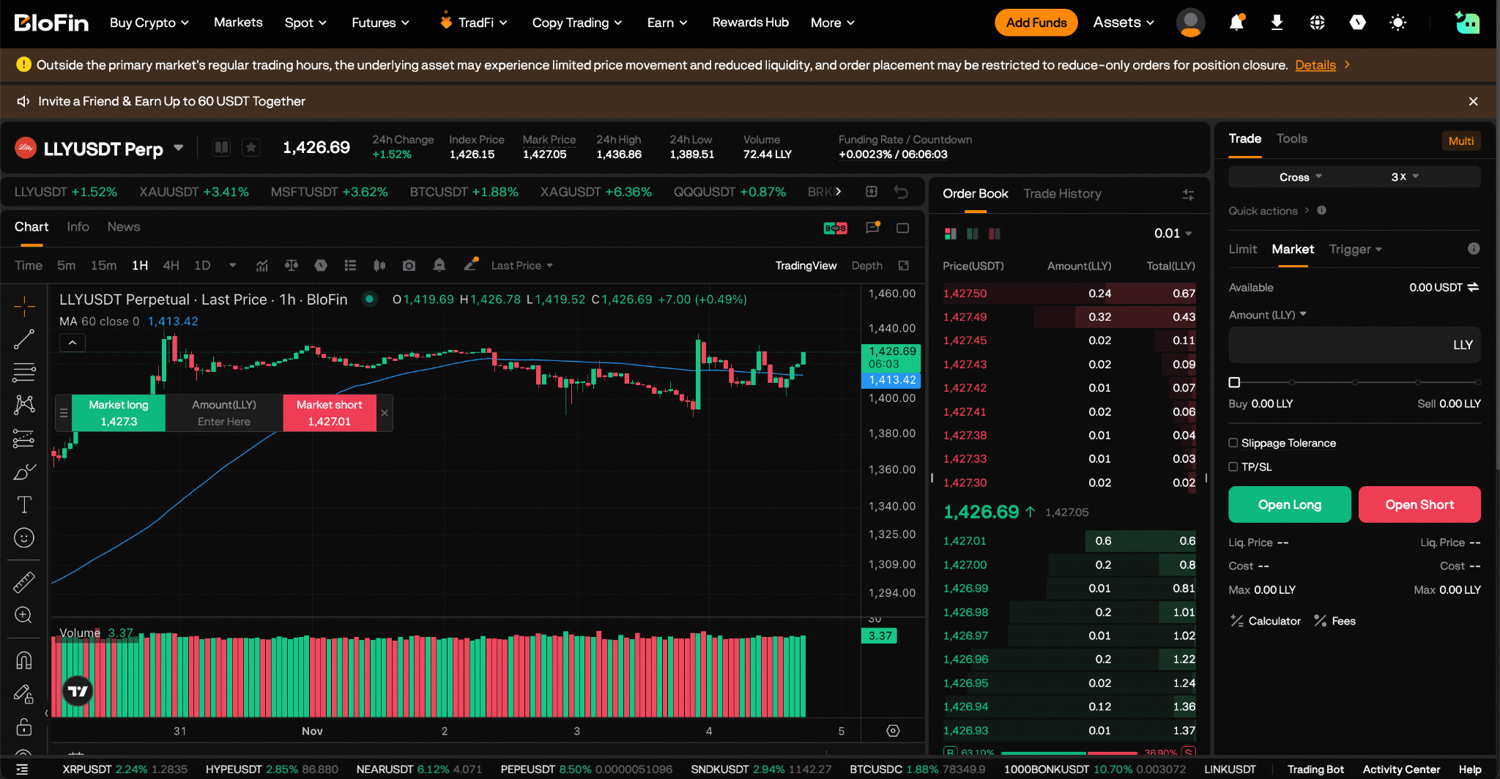
Step 4: On the order panel, click the margin mode button, shown as Cross by default, to choose your margin mode, and click the leverage button beside it to set your leverage. Then choose Limit or Market and enter your amount.
Step 5: Tick TP/SL and enter a stop-loss price. Before you click Buy to go long or Sell to go short, check Liq. Price and Cost. Your first trade on BloFin walks through the order screen in more detail. Your open trade then shows under Positions, and closing a trade on BloFin shows how to exit.
Looking to trade both sides of a rotation? To get started, you'll need to first create a BloFin account, fund your account with cryptocurrency, and navigate to the SPYUSDT Perpetual, QQQUSDT Perpetual or LLYUSDT Perpetual page.
Frequently asked questions
What is the difference between cyclical and defensive stocks?
Cyclical stocks, such as carmakers, airlines and retailers of big-ticket goods, tend to rise and fall with the economy, because customers can delay those purchases. Defensive stocks sell things people keep buying in a downturn, such as medicine, food and electricity, so their profits usually swing less.
Does sector rotation affect bitcoin?
Bitcoin has tended to move with technology stocks far more than with defensive ones. Over 59 periods since November 2021, its correlation was 0.40 with tech, 0.12 with healthcare and 0.01 with staples. It finished higher in only 2 of the 14 periods when tech fell more than 3%, and it fell 9.8% from October 5 to November 3, 2026 (source: calculated from Yahoo Finance data). Crypto has its own version of rotation too, which bitcoin dominance helps you track, and why crypto is crashing covers what has weighed on the market.
What does a sector rotation chart show?
A sector rotation chart plots each sector on two measures at once: relative strength against the market on one axis, and the momentum of that strength on the other. Sectors tend to travel clockwise around the chart, turning up, then leading, then rolling over and lagging (source: TrendSpider).
Which ETFs are used for sector rotation?
The Select Sector SPDR funds are the common choice, with one ticker per sector: XLE, XLB, XLI, XLY, XLP, XLV, XLF, XLK, XLC, XLU and XLRE. Each fund tracks an index of one sector of the S&P 500, as State Street describes for XLK, so comparing their returns over the same dates shows roughly which parts of the index led (source: State Street, XLK).
Is sector rotation a good investment strategy?
The record is mixed. Rotating well can reduce losses when one theme falls, but it means predicting leadership changes in advance, and you can miss long runs like technology's 115% return since November 2021. A rotation strategy can also underperform the broad market (source: Fidelity), and every sector move you make adds trading costs.
Researched and written by the BloFin Academy editorial team with AI-assisted drafting. All facts independently verified. Sources include Yahoo Finance, Reuters, CNBC, IG, StockCharts, Benzinga, Invesco, Investopedia, Fidelity, TrendSpider, State Street and BloFin, current as of November 4, 2026.
Nothing in this article constitutes financial advice, and nothing in it is a recommendation to buy, sell or hold any stock, ETF or crypto asset. A rotation can reverse without warning: after past gaps between defensive sectors and tech, the leaders stayed ahead only about half the time, and a position built on the last month's winners can lose money quickly. Stock perpetuals carry funding costs and thin liquidity outside regular market hours, and a leveraged position can lose its full margin or be liquidated. BloFin services are not available in restricted locations, including the United States. Past performance does not indicate future results. Do your own research and consider your risk tolerance before you trade on BloFin.