
On November 4, 2026, a major US financials fund closed at its highest level in at least five years. On the same day, the main index of US banks sat 8.4% below its August record, and Bank of America was about 20% under its own peak (source: calculated from Yahoo Finance data). Those two facts look as if they can't both be true, and working out how they can teaches a lot about what moves a bank stock.
Two rough months came first. The KBW Bank Index fell for six straight weeks to mid-October, its longest losing streak since the 2008 financial crisis, even though the big banks were reporting solid results (source: TradingKey). Then the mood turned. After Democrats won control of both chambers of Congress in the midterm elections, financials rallied on November 4. Investors kept moving money out of tech even though the sector rose modestly that day (source: Yahoo Finance).
You read a bank stock differently from most shares. A bank earns the gap between what it pays for money and what it charges for it, plus fees and trading income. That means interest rates, loan losses and trading desks all reach the share price, and a good quarter can still send it lower. Knowing which of those is moving helps you tell a problem at one bank from a mood across the market.
BloFin's JPMUSDT Perpetual and GSUSDT Perpetual are USDT-settled contracts on JPMorgan Chase and Goldman Sachs, so you can go long, which profits if the price rises, or short, which profits if it falls, on either one from a crypto balance. Its BRKBUSDT Perpetual follows Berkshire Hathaway, the largest holding in that financials fund.
What are bank stocks?
Bank stocks are shares in companies that take deposits, make loans or arrange deals for clients, such as JPMorgan Chase and Wells Fargo. Stock Analysis counts 344 of them on US exchanges, foreign banks included, worth about $6 trillion together on November 4 (source: Stock Analysis).
Owning one gives you a small claim on that bank's profits, which often reach you partly as a dividend. The share price moves with what investors expect those profits to be next. These are nine of the largest US names, with their market value on November 4 and their 2026 return to that date, dividends included (source: Stock Analysis for market value; calculated from Yahoo Finance data for returns):
Bank (ticker) | Main business | Market value | 2026 return |
|---|---|---|---|
JPMorgan Chase (JPM) | Consumer, corporate and investment banking | $935 billion | +11.4% |
Bank of America (BAC) | Consumer and corporate banking | $356 billion | −4.6% |
Morgan Stanley (MS) | Wealth management and investment banking | $304 billion | +11.7% |
Goldman Sachs (GS) | Investment banking and trading | $278 billion | +7.1% |
Wells Fargo (WFC) | Consumer and commercial banking | $262 billion | −4.6% |
Citigroup (C) | Corporate services, markets and consumer banking | $206 billion | +9.1% |
US Bancorp (USB) | Regional banking | $95 billion | +17.6% |
PNC Financial (PNC) | Regional banking | $93 billion | +15.5% |
Truist Financial (TFC) | Regional banking | $61 billion | +6.6% |
Stock Analysis leaves Goldman Sachs and Morgan Stanley out of its count, though both report in the same week as the big lenders. Most of Goldman Sachs's revenue comes from activities other than lending (source: Goldman Sachs, SEC filing), and the same is true of Morgan Stanley (source: Morgan Stanley, SEC filing). SPY, an exchange-traded fund (ETF) that follows the S&P 500, returned 13.3% in 2026 to November 4, so of these nine, only US Bancorp and PNC beat it.
How do banks make money?
Banks make most of their money from the gap between the interest they earn on loans and bonds and the interest they pay on deposits, plus fees from cards, deals and trading. That gap, measured against the loans and bonds earning it, is net interest margin, which was 3.32% across US banks in the second quarter of 2026 (source: FDIC).
Here is how that works with round numbers. Say a bank pays 2% on your $100 deposit and lends the $100 out at 5%. It collects $5, pays you $2 and keeps $3 before its costs. Now give it 20 loans like that, whose gaps add up to $60 a year, and suppose one borrower stops paying and the whole $100 is lost. That single loan has taken more than the year's gap on all 20, which is why investors watch loan losses so closely when margins look healthy.
The mix differs a lot from bank to bank. In the third quarter, JPMorgan earned $27.1 billion of net interest income, the gap in dollars, out of $50.9 billion of revenue, using the figure it calls managed revenue. About half came from lending and holding bonds (source: JPMorgan, SEC filing). Goldman Sachs earned $3.8 billion of net interest income out of $18.7 billion, about one-fifth, and most of the rest came from advising on deals and from trading (source: Goldman Sachs, SEC filing). The two shares can go separate ways on the same news as a result.
Big banks, regional banks and investment banks
Size and business model decide which risks reach the share price first, so the three groups can behave very differently in a crisis.
Type | Examples | Earns most from | What tends to hurt it |
|---|---|---|---|
Big banks | JPMorgan, Bank of America, Citigroup, Wells Fargo | A wide mix of lending, cards, deals and trading | Weak consumers, bad loans, rule changes |
Regional banks | US Bancorp, PNC, Truist | Local lending and deposits | Customers pulling deposits, property loans, paying more for deposits |
Investment banks | Goldman Sachs, Morgan Stanley | Deals, trading and wealth management | Quiet markets, fewer deals, sudden market moves |
The spring of 2023 shows the difference. After the run on Silicon Valley Bank, the State Street SPDR S&P Regional Banking ETF, KRE, lost 37.5% from March 8 to May 4, while JPMorgan lost 2.7% and SPY gained 1.6% (source: calculated from Yahoo Finance data). Fear about deposits landed on the smaller lenders.
If one of these types fits what you want to follow, BloFin's JPMUSDT Perpetual tracks a big bank and its GSUSDT Perpetual tracks an investment bank.
Why did bank stocks fall in autumn 2026?
Bank stocks fell in the autumn of 2026 because investors worried about where higher interest rates would lead, more than about what banks had just earned. The KBW Bank Index, which tracks 24 US banks, dropped 12.8% from its record close on August 14 to October 16 (source: calculated from Yahoo Finance data).
The Federal Reserve raised rates on September 16. By mid-October, a Barclays analyst noted the index had trailed the S&P 500 in 18 of the 21 trading days since, a run with no match since the index began in 1992 (source: Equity Insider on PR Newswire, citing Bloomberg). Higher rates lift what a bank earns on loans, yet borrowing costs held high for long enough can slow lending and push up defaults. Investors also had weak bond trading and worries about AI disrupting financial services to weigh (source: Equity Insider on PR Newswire, citing Bloomberg), and a credit managers' survey showed rising concern about corporate defaults (source: TradingKey).
Meanwhile, the results were mostly good, which is what made the slide so striking. Five of the six biggest banks earned more than a year earlier, and all six still closed lower on results day. Net income at Wells Fargo rose to $6.0 billion from $5.6 billion (source: Wells Fargo, SEC filing), at Citigroup to $5.2 billion from $3.8 billion (source: Citigroup, SEC filing), and at Morgan Stanley to $4.9 billion from $4.6 billion (source: Morgan Stanley, SEC filing). Here are all six, with each move on results day and the share price change from the index's August 14 high to November 4 (source: calculated from Yahoo Finance data):
Bank | Q3 2026 net income | Q3 2025 net income | Move on results day | Share price, August 14 to November 4 |
|---|---|---|---|---|
Wells Fargo | $6.0 billion | $5.6 billion | −3.1% | −1.6% |
JPMorgan Chase | $15.3 billion | $14.4 billion | −0.9% | −3.0% |
Citigroup | $5.2 billion | $3.8 billion | −5.6% | −10.5% |
Goldman Sachs | $5.3 billion | $4.1 billion | −0.2% | −10.7% |
Morgan Stanley | $4.9 billion | $4.6 billion | −2.7% | −10.8% |
Bank of America | $6.9 billion | $8.3 billion | −4.8% | −19.9% |
Bank of America is the one that fell short. Its quarter included a $1.2 billion regulatory settlement charge, and even without it, net income was $8.1 billion, slightly below the year before (source: Bank of America, SEC filing). Credit looked calm as well, with four big banks setting aside about $7.6 billion for bad loans, roughly 3% less than a year earlier (source: TradingKey). A share price reflects what investors expect over the next few quarters, so good results for the last three months can still fail to calm worries about what comes next.
Some of the fall has since reversed. The index gained 5.0% from October 16 to November 4, as the 10-year Treasury yield, the interest rate on the US government's 10-year bonds, eased from 5.10% to 4.89% (source: calculated from Yahoo Finance data). The Fed held its target range for short-term interest rates at 3.75% to 4% on October 28, with two voters preferring another rise (source: Federal Reserve). The next Fed rate meeting falls on December 8 and 9.
Do higher interest rates help bank stocks?
Higher interest rates have helped bank stocks when they rose gently and tended to hurt when they jumped. The textbook says a bank earns more on its loans as rates climb. At September 30, Bank of America put an immediate one-point rise at about $1.4 billion of extra net interest income over 12 months (source: Bank of America, quarterly report).
The share price record is messier. Split the last five years into 59 periods of 21 trading days, about a month each, and compare the bank index with SPY on price alone, because the index leaves out dividends. The results depend heavily on how fast the 10-year Treasury yield moved (source: calculated from Yahoo Finance data):
10-year yield over the period | Periods | Periods the bank index rose | Periods the bank index beat SPY |
|---|---|---|---|
Rose by more than 0.3 of a point | 12 | 2 | 4 |
Rose by 0.1 to 0.3 of a point | 15 | 11 | 10 |
Moved less than 0.1 of a point | 18 | 12 | 7 |
Fell by more than 0.1 of a point | 14 | 8 | 6 |
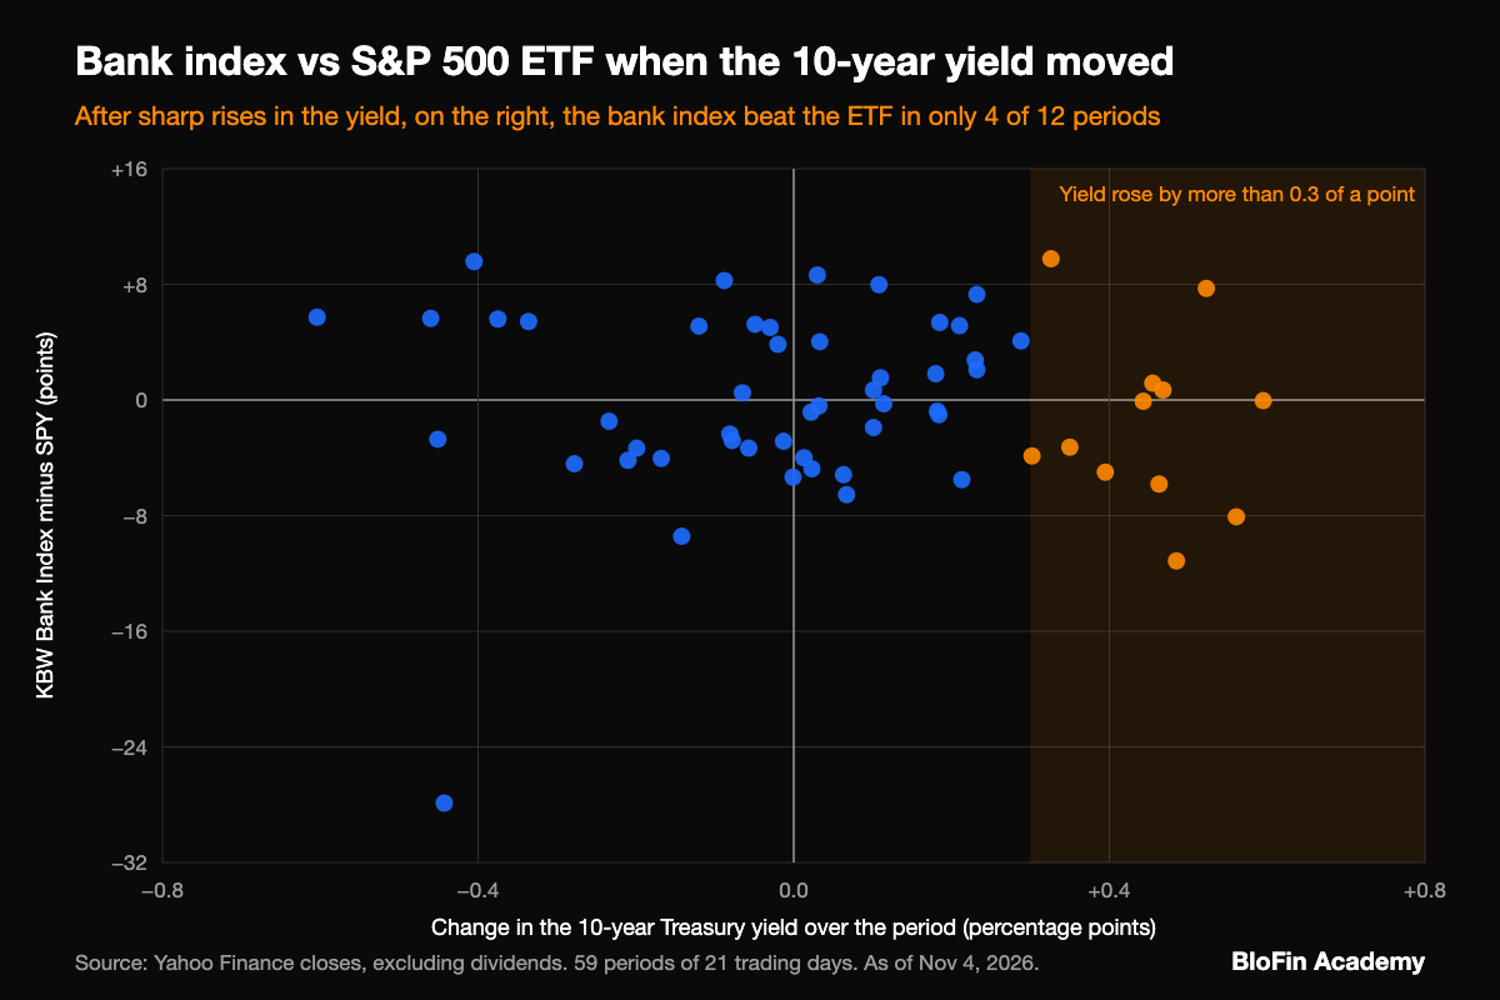
The gentle rises went well, with the index ahead of SPY in 10 of 15 periods. The sharp ones went the other way, and most of them date from 2022 and 2023, so a handful of bad months is doing a lot of the work. Across all 59 periods, the correlation between the change in yield and the bank index's gap over SPY was just 0.01 (source: calculated from Yahoo Finance data). A correlation of 1 means they moved together and 0 means no link, so the yield alone told you almost nothing. The widest miss came in the month to March 30, 2023, when the bank index trailed SPY by about 28 points during the Silicon Valley Bank scare, even though the yield fell.
The last full cycle of rate rises shows how far apart the banks themselves can land. From the Fed's first rise in March 2022 to its last in July 2023 (source: Federal Reserve), the share price of JPMorgan gained 14.0% and Goldman Sachs gained 4.9% (source: calculated from Yahoo Finance data). Citigroup, though, lost 16.4% and Bank of America lost 24.3% (source: calculated from Yahoo Finance data). Over the same dates, the bank index lost 31.4% and SPY gained 4.6% (source: calculated from Yahoo Finance data).
Bonds explain part of the difference between those banks. A bank that bought long-term bonds when yields were low holds assets worth less when yields climb. US banks carried $326.7 billion of unrealized losses on their bonds in the second quarter of 2026, meaning losses on paper that become real if the bonds are sold (source: FDIC). Deposits matter too, because savers start asking for more interest, which narrows the gap a bank keeps.
Bank stocks vs financial stocks
Financial stocks are a wider group than bank stocks, because they also include insurers, payment networks, asset managers and brokers. The State Street Financial Select Sector SPDR ETF, XLF, is the fund that closed at its highest level in at least five years on November 4 (source: calculated from Yahoo Finance data).
Banks, as State Street classes them, were only about 26% of it on November 3, a figure that leaves out the investment banks Goldman Sachs and Morgan Stanley (source: State Street, XLF). On that date, XLF had about 28.3% of its money in Berkshire Hathaway, Visa and Mastercard, against about 18.4% in JPMorgan, Bank of America and Goldman Sachs combined (source: State Street, XLF).
Those non-banks sit outside most of the risks in a bank's results. Visa says it does not issue cards or extend credit and bears no credit risk on those activities (source: Visa, SEC filing), and Mastercard says the same about issuing cards and extending credit (source: Mastercard, SEC filing). So when a card balance goes unpaid, the loss falls on the bank behind the card, not on the network. Berkshire Hathaway is a holding company, one that owns other businesses, and its most important are insurance, a freight railroad and utilities and energy (source: Berkshire Hathaway, SEC filing).
That split between banks and non-banks explains how a financials fund can reach a high while banks slide.
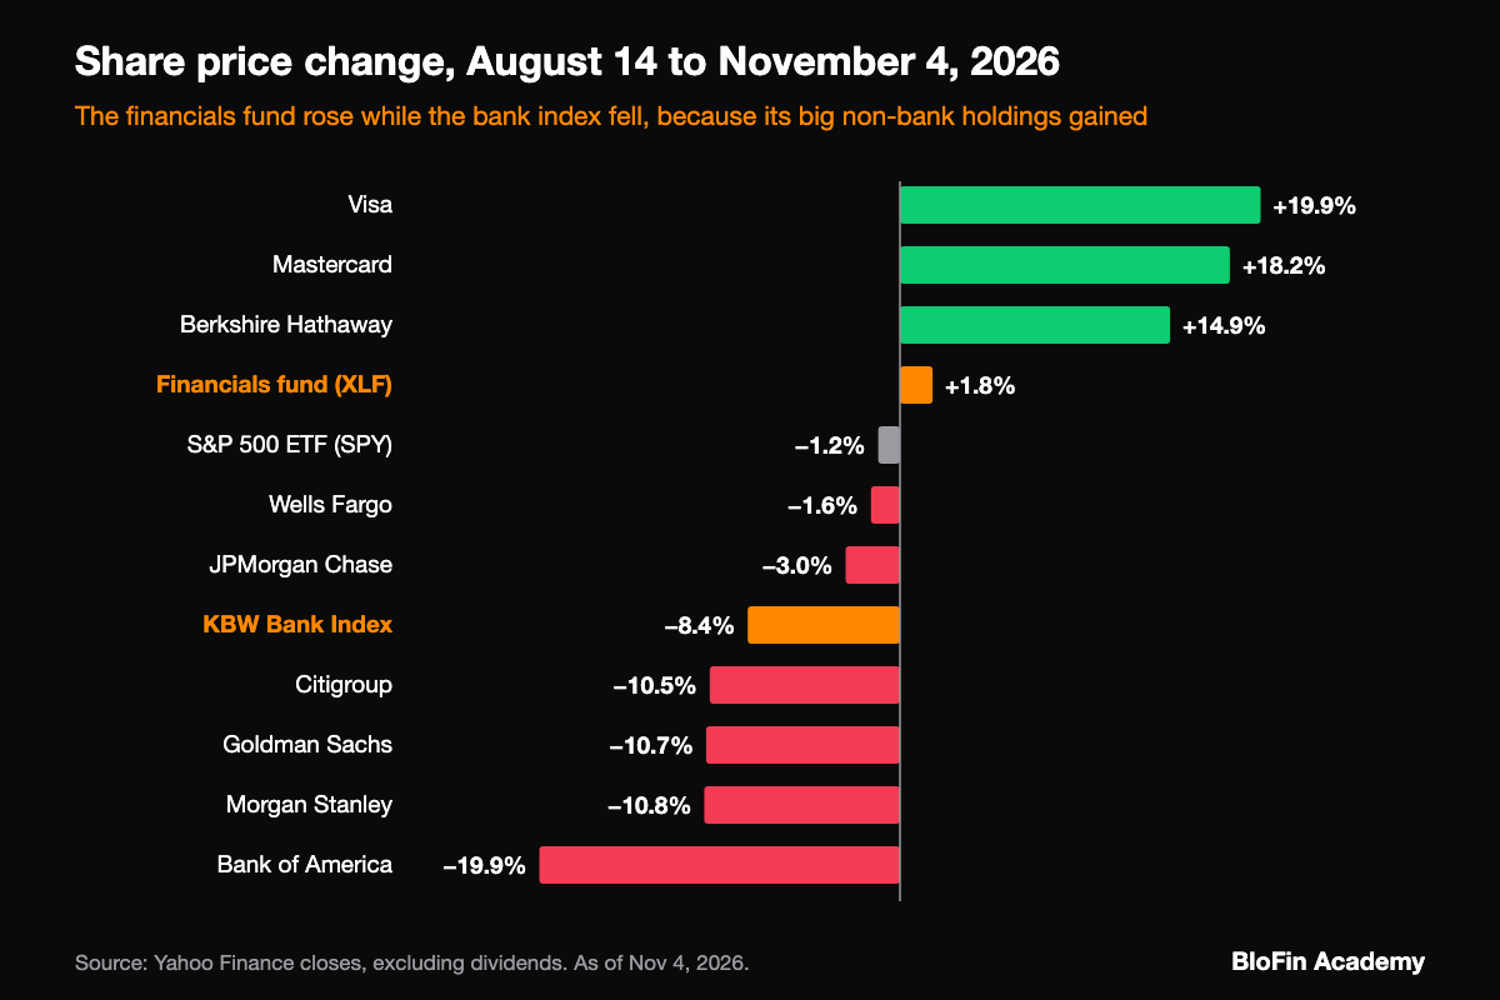
From August 14 to November 4, those three non-banks rose between 14.9% and 19.9% in share price, which helped XLF gain 1.8% while the bank index lost 8.4% (source: calculated from Yahoo Finance data). As a rough sum using the November 3 weights, those three added roughly 4 to 5 points to the fund, while JPMorgan, Bank of America and Goldman Sachs took away roughly 1.5 to 2 (source: calculated from State Street weights and Yahoo Finance data). A headline saying financials hit a high tells you little about the banks. Before you buy a fund to get bank exposure, check its published list of holdings to see how much of it is actually banks.
Do bank stocks hold up when tech stocks fall?
Bank stocks have rarely held up when tech stocks fall, even though the latest month made it look that way. In 13 of 59 periods of 21 trading days since November 2021, QQQ, the Nasdaq 100 ETF, lost more than 3%, and the bank index rose in only four of those (source: calculated from Yahoo Finance data).
The bank index's median, or middle, change in those 13 was −4.1%, against −4.9% for SPY (source: calculated from Yahoo Finance data). The most recent of those periods is one of the four: QQQ lost 8.9% in the 21 trading days to November 4, while the bank index gained 4.0%. That kind of move out of big tech and into other groups is called sector rotation, and it shows up mainly when the market as a whole falls only modestly. In the five QQQ falls when SPY lost less than 3%, the bank index rose in three, and in the eight when SPY also lost more than 3%, it rose in one (source: calculated from Yahoo Finance data).
Banks are a cyclical group, meaning their profits rise and fall with the economy, so their shares tend to swing harder than the market. The standard deviation of those 21-day returns, a measure of how widely returns swing, was 7.6 points for the bank index against 4.4 for SPY (source: calculated from Yahoo Finance data). Holding banks does make you less reliant on the Magnificent 7, but it moves your risk to bad loans and the economy instead of removing it.
How to read a bank's earnings report
To read a bank's earnings report, start with net interest income and margin, compare the provision for credit losses with net charge-offs, then check the capital ratio and return on tangible common equity. Those lines show what the bank earned, what it expects to lose and how much cushion it has.
These examples come from third-quarter 2026 results, except the industry figure for unrealized bond losses (source: Bank of America, Wells Fargo, JPMorgan, Morgan Stanley and Citigroup SEC filings; FDIC for unrealized losses):
Measure | What it tells you | Example |
|---|---|---|
Net interest income | Interest earned minus interest paid, in dollars | Bank of America, $16.4 billion, up 8% from a year earlier |
Net interest margin | That gap as a percentage of the assets earning it | Wells Fargo, 2.43%, down from 2.61% a year earlier |
Provision for credit losses | Money set aside for loans that may go bad | JPMorgan, $2.7 billion |
Net charge-offs | Loans the bank has now written off as lost | JPMorgan, $2.2 billion |
Common equity tier 1 (CET1) ratio | The bank's core capital against its risky assets, its cushion for losses | JPMorgan, 13.9%, and Wells Fargo, 10.0% |
Return on tangible common equity | Profit against the money shareholders have in the business, leaving out items such as goodwill, the premium a bank paid when buying another company | Morgan Stanley, 22.6%, and Citigroup, 11.5% |
Unrealized bond losses | Bonds worth less than the bank paid, shown across the industry | US banks, $326.7 billion in Q2 2026 |
A provision running ahead of charge-offs means the bank is adding to its reserves, as JPMorgan's $539 million reserve build shows. That can reflect a growing loan book as well as an expectation of more losses. For the timing of these reports each quarter and how markets tend to react, earnings season covers the wider calendar.
Capital also limits what shareholders receive, because regulators set how much of it large banks must hold. For the third quarter of 2020, the Federal Reserve suspended share buybacks, where a company purchases its own stock, and capped dividends at large banks to preserve capital (source: Federal Reserve).
How to invest in bank stocks
You can hold bank stocks in three main ways: buying shares in a single bank through a broker, buying a fund, or trading a contract that follows the price. A fund spreads your money across many banks, so one bad result matters less.
To buy shares in a single bank, you open an account with a stock broker, search for the ticker and place an order. The measures in its earnings report are how you compare one bank with another.
The choice of fund decides what you actually own. The State Street SPDR S&P Bank ETF, KBE, holds US banks and related firms such as mortgage lenders (source: State Street, KBE). The State Street SPDR S&P Regional Banking ETF, KRE, holds regional banks (source: State Street, KRE). Both give their holdings roughly equal shares, while XLF spreads across the whole financial sector by company size (source: State Street, XLF). Returns here include dividends (source: calculated from Yahoo Finance data):
Fund | What it holds | Holdings on November 3 | Annual fee | 2026 return to November 4 |
|---|---|---|---|---|
Financial Select Sector SPDR ETF (XLF) | Banks, insurers, payments and more, weighted by size | 76 | 0.08% | +9.4% |
SPDR S&P Bank ETF (KBE) | US banks and related firms, in roughly equal shares | 107 | 0.35% | +13.7% |
SPDR S&P Regional Banking ETF (KRE) | US regional banks, in roughly equal shares | 167 | 0.35% | +16.4% |
KBE and KRE give a small bank about the same share as a large one, so they lean towards smaller lenders. That helps explain why they have led XLF in 2026 and fell harder in the spring of 2023. You can't buy the KBW Bank Index itself, because an index only measures the group (source: Nasdaq, KBW Bank Index), but the Invesco KBW Bank ETF, KBWB, is based on it (source: Invesco, KBWB).
How to trade bank stocks on BloFin
BloFin lists the JPMUSDT Perpetual and the GSUSDT Perpetual, both USDT-settled with leverage of up to 20x. Its BRKBUSDT Perpetual, also up to 20x, follows Berkshire Hathaway, which owns bank shares and much else but is itself a holding company. BloFin has no contract on Bank of America, Wells Fargo, Citigroup or Morgan Stanley.
A perpetual contract follows an asset's price and has no expiry date. You hold a contract and own no shares, so you get no votes or dividends, which matters more for banks than for many tech stocks. Funding, a regular payment between traders who are long and short, is paid every eight hours, so it costs or pays you for as long as you hold. Outside the main market's regular hours, the asset a contract follows may see limited price movement and reduced liquidity, meaning fewer buyers and sellers (source: BloFin, JPMUSDT Perpetual). BloFin may also limit orders to reduce-only at those times, so you can only close a position (source: BloFin, stock futures trading hours).
Leverage means holding a position larger than the money you put up, and that money is your margin. Say you open a 1,000 USDT long on the JPMUSDT Perpetual at 5x, which ties up 200 USDT of margin. At about $352, the 1,000 USDT position comes to about 284 contracts of 0.01 share each. If JPMorgan repeats its 9.7% fall from August 12 to October 7 (source: calculated from Yahoo Finance data), you lose about 97 USDT before fees and funding, or nearly half your margin. A stop-loss on BloFin closes the position at a price you set in advance, and how leverage and liquidation work shows what happens if the margin runs out.
How to open a bank stock perpetual on BloFin
Step 1: Create your BloFin account and send USDT to it. A deposit lands in your Funding Account, so move the USDT to your Futures Account with Transfer, found under Assets.

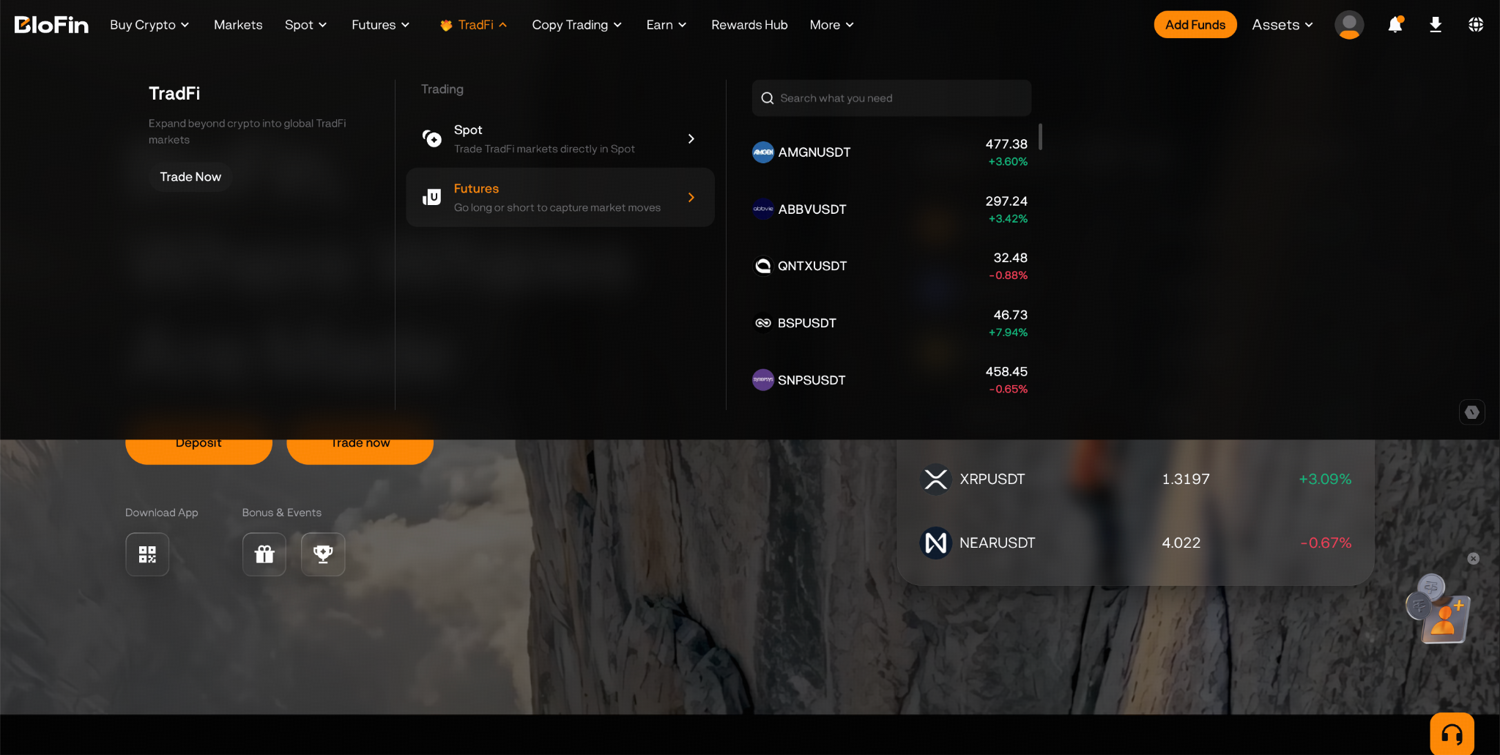
Step 2: Hover your cursor over the TradFi tab and select Futures.
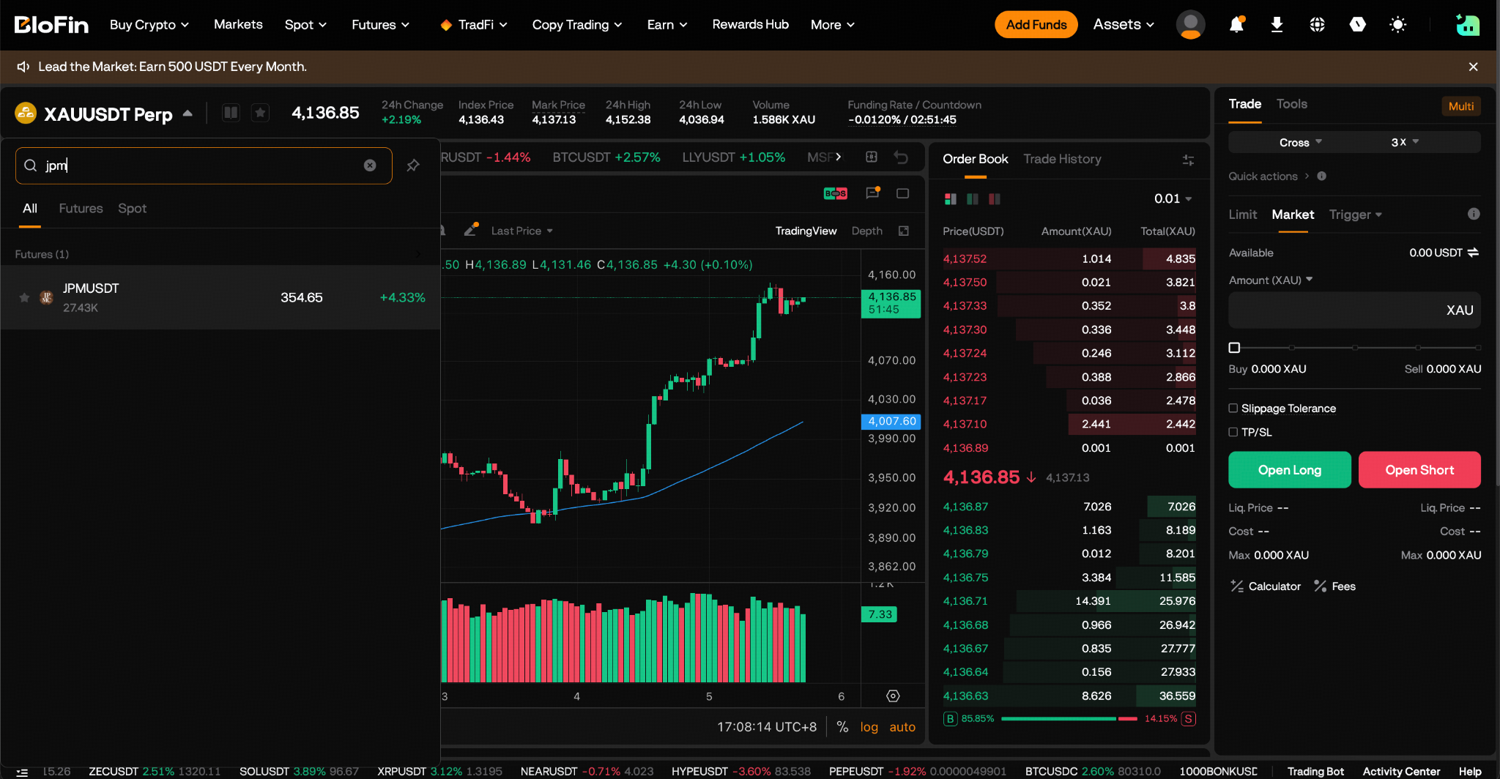
Step 3: Click on the trading pair at the top left corner and search for the stock, such as JPM or GS.
Step 4: On the order panel, click the margin mode button, shown as Cross by default, to choose your margin mode, and click the leverage button beside it to set your leverage. Cross lets a losing position draw on the rest of your futures balance, while Isolated limits the loss to the margin you assign. Then choose Limit, which fills only at your price or better, or Market, which fills right away at the best price available, and enter your amount.
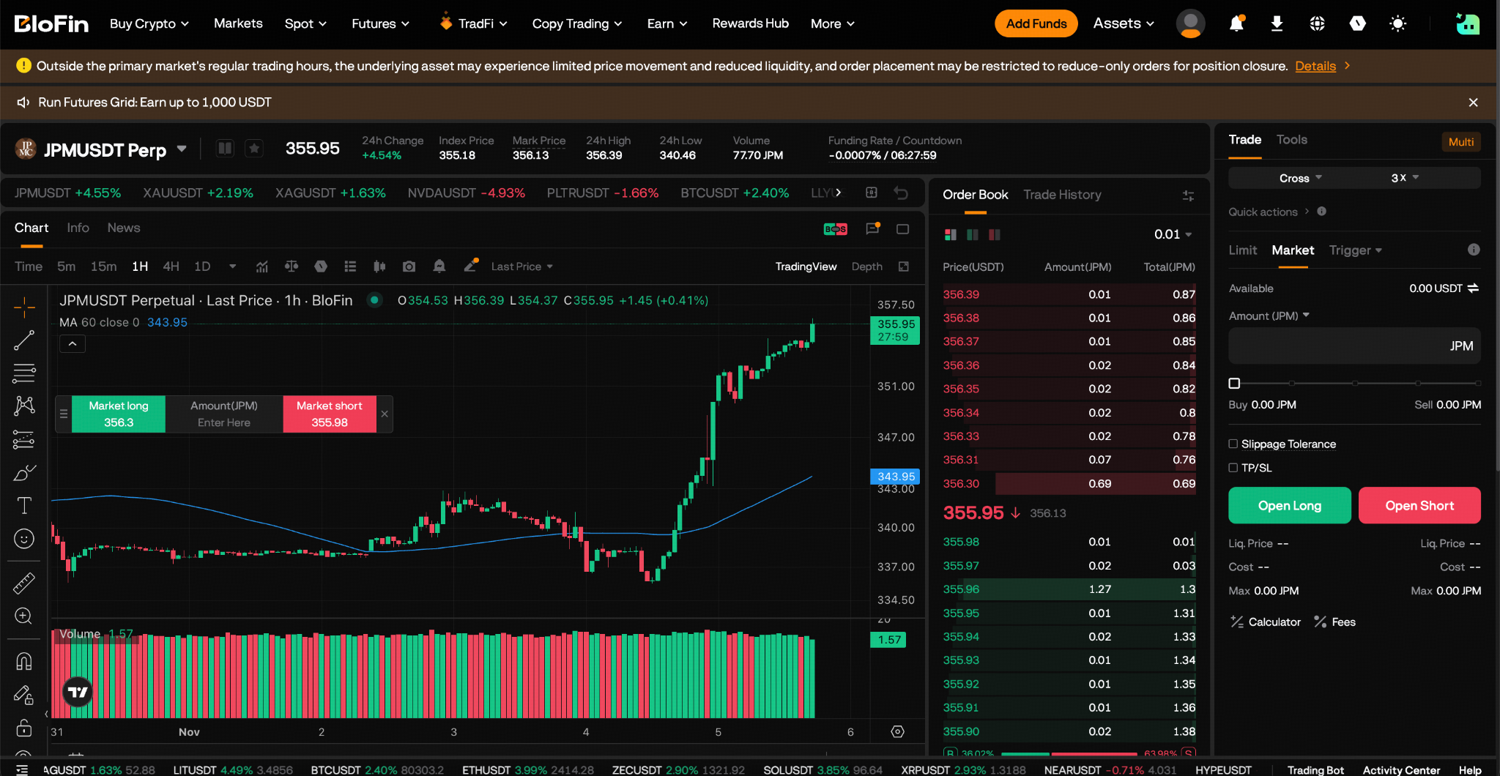
Step 5: Tick TP/SL and enter a stop-loss price. Before you click Buy to go long or Sell to go short, check Liq. Price and Cost. Your first trade on BloFin walks through the order screen in more detail. Your open trade then shows under Positions, and closing a trade on BloFin shows how to exit.
Looking to trade bank stocks? To get started, you'll need to first create a BloFin account, fund your account with cryptocurrency, and navigate to the JPMUSDT Perpetual, GSUSDT Perpetual or BRKBUSDT Perpetual page.
Frequently asked questions
Are bank stocks a good investment?
That depends on what you already own and how large a fall you could sit through. The KBW Bank Index lost 23.7% in 2022 and 4.8% in 2023, then gained 32.8% in 2024 and 28.8% in 2025, before dividends (source: calculated from Yahoo Finance data). A standard S&P 500 fund already holds big banks, so buying them on top raises your share rather than adding something new.
Do bank stocks pay dividends?
Most large US banks pay a dividend every quarter. Over the 12 months to November 4, 2026, the payouts came to about 1.7% of the share price at JPMorgan, 2.2% at Bank of America, 3.2% at PNC and 4.1% at Truist (source: calculated from Yahoo Finance data). A higher figure can reflect a lower share price as well as a larger payment, and a bank can cut its dividend.
Are regional banks riskier than big banks?
Regional banks have been hit harder in a crisis, since they rely more on local deposits and lending and have fewer other businesses to lean on. KRE, the regional bank fund, returned −7.6% with dividends in 2023, the year of the deposit scare, while JPMorgan returned +30.6%, and KRE trailed JPMorgan in every year from 2022 to 2025 (source: calculated from Yahoo Finance data). In 2026 to November 4, though, KRE is ahead of it.
Do bank stocks move with bitcoin?
Only loosely. Across 59 periods of 21 trading days since November 2021, the correlation between the KBW Bank Index and bitcoin was 0.27. A correlation of 1 would mean they moved in lockstep and 0 would mean no link at all (source: calculated from Yahoo Finance data). Bitcoin has its own drivers, and five years of monthly returns is a small sample.
Are stablecoins a threat to bank stocks?
Stablecoins look small so far. Dollar stablecoins, at about $295.1 billion on November 4, 2026 (source: DefiLlama), equal about 1.5% of the $19.8 trillion in US commercial bank deposits in the week to October 21 (source: Federal Reserve H.8). The risk to a bank's shares would be losing cheap deposits, which narrows its margin. Whether stablecoins will drain bank deposits turns on where issuers hold their reserves and whether holders can earn interest.
Researched and written by the BloFin Academy editorial team with AI-assisted drafting. All facts independently verified. Sources include Yahoo Finance, the FDIC, the Federal Reserve, SEC filings from JPMorgan Chase, Bank of America, Wells Fargo, Citigroup, Goldman Sachs, Morgan Stanley, Visa, Mastercard and Berkshire Hathaway, State Street, Nasdaq, Stock Analysis, Invesco, TradingKey, Equity Insider, DefiLlama and BloFin, current as of November 5, 2026.
Nothing in this article constitutes financial advice, and nothing in it is a recommendation to buy, sell or hold any stock, ETF or crypto asset. Bank stocks can fall sharply on fear about deposits or bad loans, as regional banks did in 2023, and past returns and correlations do not predict future ones. Stock perpetuals carry funding costs and pay no dividends, liquidity in the asset a contract follows may be reduced outside regular market hours, and a leveraged position can lose its full margin or be liquidated. BloFin services are not available in restricted locations, including the United States. Past performance does not indicate future results. Do your own research and consider your risk tolerance before you trade on BloFin.