
For most of the past three years, a handful of giant technology companies carried the US stock market, and the rest of the index, which investors nicknamed the S&P 493, trailed far behind. Late in 2026 the pattern turned. Analysts now expect those other companies to grow their profits faster than the biggest names, and their shares have started to move ahead as well.
The earnings data shows the shift first. In a note published on November 3, 2026, FactSet put blended third-quarter earnings growth for the Magnificent 7 at 22.6%, down from the 33.6% expected on September 30. Blended growth for the other 493 companies rose to 32.6% from 27.8% over the same weeks. If those figures hold, it will be the first quarter since the end of 2022 in which the seven grew earnings more slowly than the rest (source: FactSet).
Prices followed. From October 5 to November 10, 2026, with dividends, a fund that holds every S&P 500 company in about the same amount gained 4.6%. Over the same weeks the ordinary S&P 500 fund, where the biggest companies count for the most, lost 3.2% (source: calculated from Yahoo Finance data). Two funds holding the same 500 companies moved in opposite directions, and the gap between them says a lot about what you own when you buy "the market".
BloFin lists a USDT-settled perpetual contract on the S&P 500 fund, the SPYUSDT Perpetual, and on several of the largest companies outside the seven, including the JPMUSDT Perpetual on JPMorgan Chase and the LLYUSDT Perpetual on Eli Lilly.
What is the S&P 493?
The S&P 493 is an informal name for the S&P 500 minus the Magnificent 7, the group of technology giants made up of Apple, Nvidia, Microsoft, Alphabet, Amazon, Meta and Tesla. It describes the other 493 or so companies in the index, from banks and drugmakers to retailers and oil producers, and no official index carries the name.
The term exists because the S&P 500 has become top-heavy. The index weights each company by its market value, so a company worth $4 trillion moves the index far more than one worth $40 billion. When seven companies make up about a third of the index, the headline number mostly tells you what those seven did, and the S&P 493 is shorthand for asking how everyone else is doing. The Magnificent 7 stocks explains how the group formed and how much of the index it moves.
The number is approximate. The S&P 500 holds about 500 companies, and a few of them, such as Alphabet, have two classes of shares in the index, so the fund that tracks it lists slightly more than 500 holdings. Take out the seven and you are left with roughly 493 companies, which is where the name comes from.
Say you own $1,000 of an S&P 500 fund. On November 10, 2026, about $328 of that sat in the seven companies and about $670 in everything else, with a little left in cash (source: State Street, SPY holdings). You own all 500 companies, and two-thirds of your money is in the S&P 493. Even so, a 10% move in Apple or Nvidia shows up in your balance far more than a 10% move in a mid-sized insurer.
What is in the S&P 493?
The S&P 493 contains every sector, and it also contains several large AI companies. Broadcom, the biggest company outside the seven, made up 2.43% of the S&P 500 fund on November 10, 2026, which is more than Meta or Tesla. The chipmakers AMD and Micron are also among the ten largest members of the 493.
These are the ten largest companies in the S&P 493, by their weight in the S&P 500 fund on November 10, 2026.
Company | Sector | Weight in the S&P 500 fund |
|---|---|---|
Broadcom | Technology (chips) | 2.43% |
Eli Lilly | Healthcare | 1.77% |
Berkshire Hathaway | Financials | 1.67% |
JPMorgan Chase | Financials | 1.40% |
AMD | Technology (chips) | 1.30% |
Micron Technology | Technology (chips) | 1.26% |
Visa | Financials | 1.11% |
Johnson & Johnson | Healthcare | 1.04% |
ExxonMobil | Energy | 1.04% |
Walmart | Consumer staples | 0.86% |
(source: State Street, SPY holdings)
Together those ten companies held 13.89% of the fund, and the other 480 or so shared the rest of the 493's weight (source: State Street, SPY holdings). That gives the 493 a long tail. The middle company outside the seven weighed about 0.07%, and the smallest 250 companies in the whole index added up to under 9%, a little more than Apple on its own at 7.84%.
That mix matters when you read a headline about the 493. "The S&P 493 is beating the Magnificent 7" can mean that banks, drugmakers and energy companies are doing well, but it can also mean that chip companies outside the seven are rising with the AI buildout. Check which companies are behind the move before you treat it as a sign that the whole economy is strong. The 493 include the sectors covered in defensive stocks, such as consumer staples, healthcare and utilities. They also include almost all of the banks and industrial companies, so they react more to the wider economy than the seven do.
How is the S&P 493 doing in 2026?
The S&P 493 is ahead of the Magnificent 7 in 2026. FactSet expects faster third-quarter profit growth from the 493. From January 1 to November 10, 2026, with dividends, the equal-weight S&P 500 fund returned 16.7% while the ordinary S&P 500 fund returned 10.8% (source: FactSet, calculated from Yahoo Finance data).
Say you had put $10,000 into each fund on January 1, 2026. By November 10 the equal-weight fund would have been worth about $11,668 and the S&P 500 fund about $11,083, a gap of nearly $600 (source: calculated from Yahoo Finance data).
The earnings shift came from surprises in both directions. In the FactSet note, only two of the five Magnificent 7 companies that had reported beat analysts' estimates, against 82% of all S&P 500 companies, and in total the five fell 14.7% short of what analysts expected. Part of the shortfall was accounting. Alphabet booked an $8.7 billion loss on equity investments and Meta took a $9.9 billion litigation charge, while the Amazon figure a year earlier had included gains on its stake in Anthropic. FactSet used these three companies' results under GAAP, the standard accounting rules, which keep one-off items like these in, because most analysts forecast them that way (source: FactSet). Analysts expect the gap to last another quarter: the estimate for the fourth quarter of 2026 is 22.6% growth for the seven and 30.8% for the rest.
The whole index is growing quickly. FactSet put blended third-quarter earnings growth for all S&P 500 companies at 31.4% on November 6, 2026, which would be the eighth quarter in a row of double-digit growth if it holds (source: FactSet, November 6, 2026). Both groups are growing, and this quarter the 493 are growing faster. How earnings season works explains blended growth rates, estimates and surprises.
Two of the seven, Apple and Nvidia, had not reported when FactSet compared the groups. Nvidia, the second-largest holding in the S&P 500 fund after Apple, reports its third-quarter results on November 17, 2026 (source: FactSet, State Street, SPY holdings), and its result feeds straight into the seven's final growth figure. Treat the comparison as a reading taken partway through the season, which will change once every company has reported.
How concentrated is the S&P 500?
The S&P 500 is more concentrated in a few companies than at any time in decades. The ten largest companies made up about 18% to 23% of the index from 1990 to 2015, and that share nearly doubled to a record 40.7% at the end of 2025, according to RBC Wealth Management (source: RBC Wealth Management).
Even the dot-com boom did not get this far. RBC puts the top ten at roughly 23% at the end of 2000, with a peak of about 27% during that year, led by Cisco, Microsoft and Intel. On November 10, 2026, the ten largest companies in the S&P 500 fund held 38.72%, a little below the record. That is still far above the 18% to 23% range of 1990 to 2015 (source: State Street, SPY holdings, RBC Wealth Management). Seven of those ten are the Magnificent 7, and the other three are Broadcom, Eli Lilly and Berkshire Hathaway.
Concentration matters because of what it does to your diversification. A fund with 500 companies sounds spread out, but when about 39 cents of every dollar sits in ten companies, a bad quarter at one of them moves your whole position. RBC also found that in 2025 the ten largest companies held about 41% of the index weight but were expected to produce only about 32% of its earnings. Investors were paying more for each dollar of profit at the top than in the rest of the index (source: RBC Wealth Management). The firm argues that high concentration alone does not prove a bubble, because the largest companies are very profitable, but it raises the risk that one company's news drives the result. The AI bubble covers the spending behind that profit.
Say you put $10,000 into an S&P 500 fund. At the November 10 weights, about $3,872 sits in ten companies and about $6,128 is spread over the other 490 or so. If those ten fell 20% and nothing else moved, your fund would lose about $774, or 7.7%, even though 98% of the companies in it had not changed in price.
How has the equal-weight S&P 500 done against the S&P 500?
From May 2003 to November 2026, the equal-weight S&P 500 fund finished almost level with the ordinary S&P 500 fund, at 11.31% a year against 11.33% with dividends. Equal weight led for most of the first ten years, and the ordinary index led for the twelve after (source: calculated from Yahoo Finance data).
An equal-weight index holds the same 500 companies, but it gives each one about the same share, roughly 0.2% (source: RBC Wealth Management). Nvidia and a regional bank count the same, so the index tells you what the typical company is doing. The best-known fund that tracks it is the Invesco S&P 500 Equal Weight ETF, ticker RSP.
Period | Equal-weight fund (RSP) | S&P 500 fund (SPY) | Years equal weight did better |
|---|---|---|---|
2004 to 2013 | +141.9% | +103.1% | 6 of 10 |
2014 to 2025 | +228.9% | +353.3% | 4 of 12 |
May 1, 2003 to November 10, 2026 | +1,142.9% | +1,150.7% | 10 of 22 full years |
The two eras show what drives each index (source: calculated from Yahoo Finance data). Equal weight tends to do better when smaller companies and the broad economy lead, as they did after the 2008 crisis, when the equal-weight fund returned 44.6% in 2009 against 26.4% for the S&P 500 fund. The ordinary index does better when the largest companies keep growing faster than everyone else, which describes most years since 2014. From 2023 to 2025 the gap grew to a record. RBC measured the three-year lead of the ordinary index at over 32% by the end of 2025, more than the roughly 31% lead it reached in early 2000 before the dot-com crash (source: RBC Wealth Management).
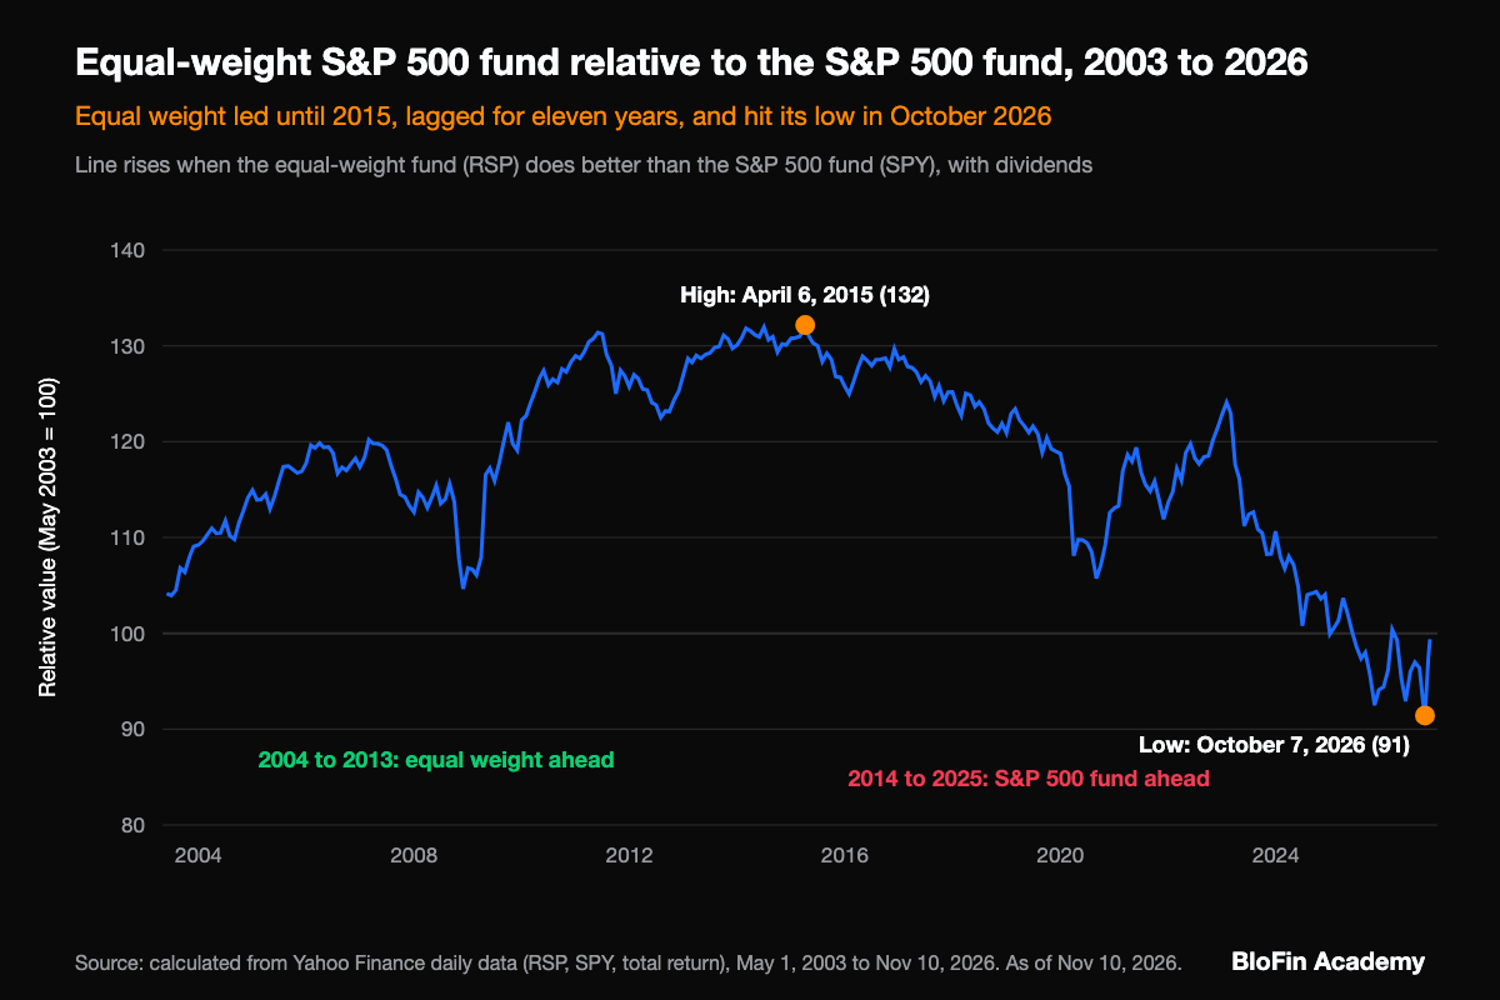
The turn came in October 2026. Measured against the S&P 500 fund, the equal-weight fund reached its lowest point since its 2003 launch on October 7, 2026, after more than eleven years of falling behind from its high in April 2015. From October 7 to November 10 it gained 4.9% while the S&P 500 fund lost 3.5%, which lifted the ratio 8.7% off the low (source: calculated from Yahoo Finance data). One month does not show whether a new era has started, since the equal-weight fund also did better than the S&P 500 fund in 2016, 2021 and 2022 before falling behind again.
Say you had put $10,000 into each fund at the start of 2004. By the end of 2013 the equal-weight fund was worth about $24,191 and the S&P 500 fund about $20,309. Start again with $10,000 each at the beginning of 2014, and by the end of 2025 the S&P 500 fund was worth about $45,332 against $32,893 for equal weight. Which one looks better depends almost entirely on which decade you pick.
Is there an S&P 493 ETF?
There is an ETF built to hold the S&P 493: the Defiance Large Cap ex-Mag 7 ETF, ticker XMAG, which launched on October 21, 2024. It tracks the BITA US 500 ex Magnificent 7 Index, made of the 500 largest US stocks minus the seven, and had 494 holdings and a gross expense ratio of 0.35% (source: Defiance, XMAG).
XMAG and the equal-weight fund answer different questions, even though both are used as "the 493". XMAG still weights each company by its market value and rebalances every quarter, so Eli Lilly, Broadcom, Micron and JPMorgan are its largest holdings, and it behaves like the S&P 500 with the seven cut out (source: Defiance, XMAG). The equal-weight fund keeps the seven at about the same small share as every other company and gives a small company the same say as a large one. The ordinary S&P 500 fund keeps all seven at full size.
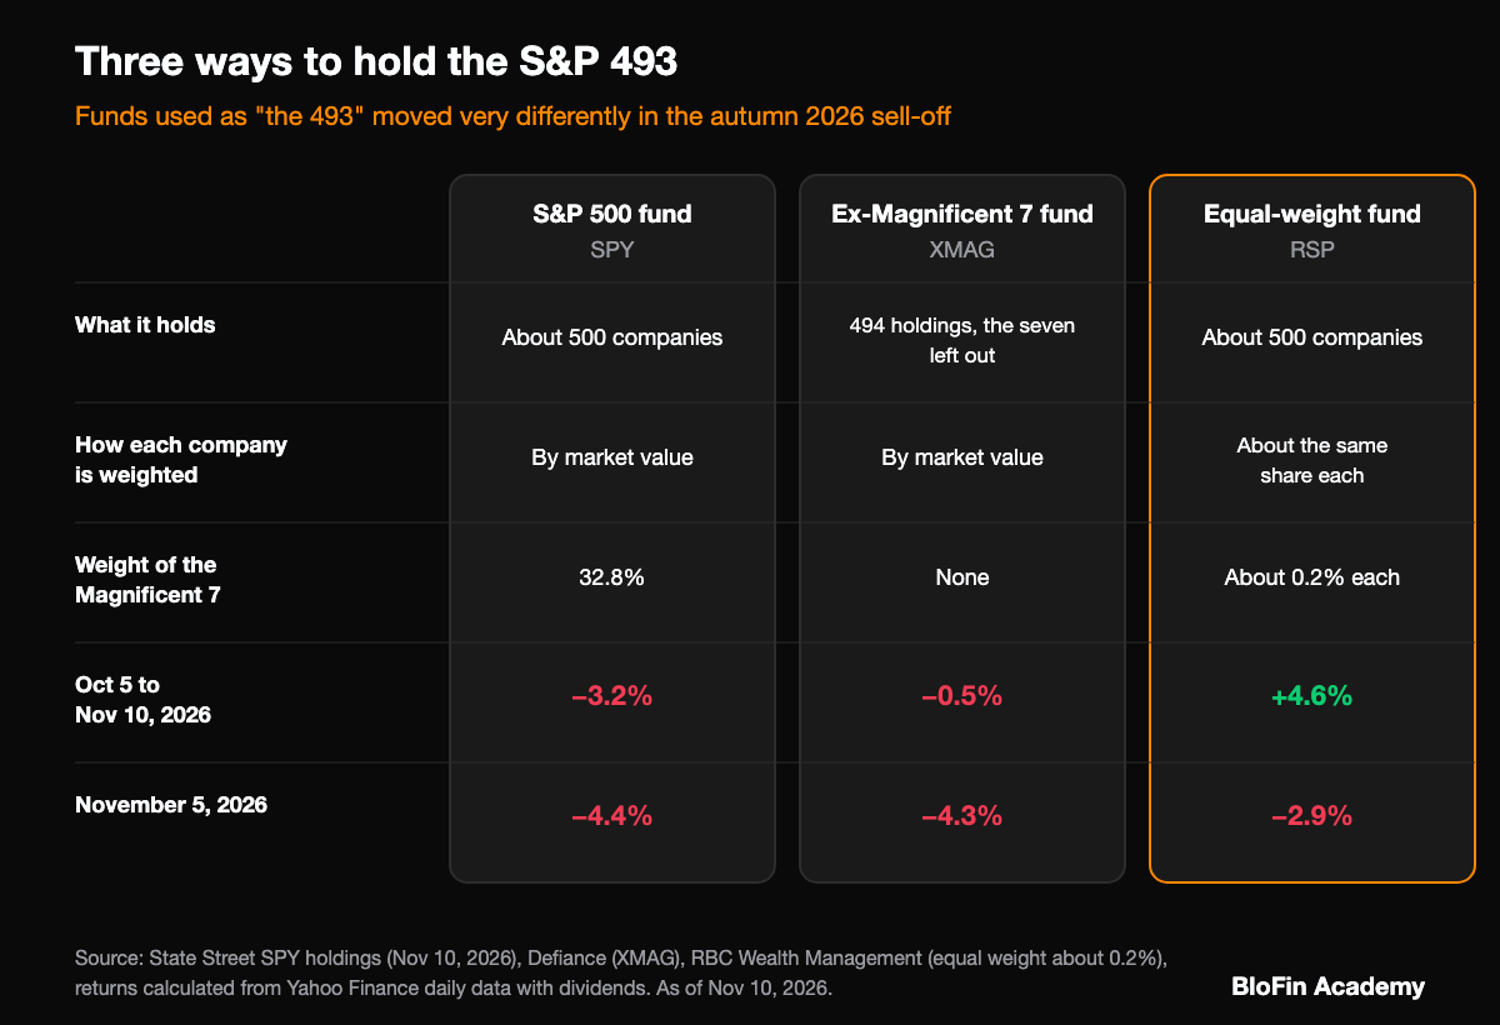
The difference showed up clearly in the sell-off of late 2026. From October 5 to November 10, 2026, with dividends, XMAG lost 0.5% while the equal-weight fund gained 4.6% (source: calculated from Yahoo Finance data). The large companies outside the seven, which include Broadcom, AMD and Micron, fell with the AI trade, while the typical company rose. Say you had put $10,000 into each fund on October 5: by November 10 you would have had about $10,462 in the equal-weight fund, $9,949 in XMAG and $9,679 in the S&P 500 fund (source: calculated from Yahoo Finance data). On November 5, when the S&P 500 fund fell 4.4%, XMAG fell 4.3% and the equal-weight fund 2.9%, so on the worst day of the sell-off removing the seven barely helped.
Over longer stretches the gaps can run the other way. In 2025, XMAG returned 15.6% and the equal-weight fund 11.2%, both behind the S&P 500 fund at 17.7%. In the sell-off from February 19 to April 8, 2025, XMAG fell 16.2%, the equal-weight fund 16.0% and the S&P 500 fund 18.8% (source: calculated from Yahoo Finance data). If what you want is "the market minus big tech", XMAG is the closer match; if you want "the typical stock", equal weight is.
What is market breadth?
Market breadth is a count of how many stocks join in when an index rises or falls. A broad rally lifts most companies in an index, while a narrow one rests on a few large ones. The simplest check compares the equal-weight S&P 500 with the ordinary one, because when equal weight keeps up, the gains are spreading.
Traders use several breadth measures. The advance-decline line counts how many stocks rose each day against how many fell. The percentage of stocks above their 200-day moving average shows how many are in a longer uptrend. New highs against new lows compare stocks at 52-week peaks with stocks at 52-week troughs. All of them ask the same question: are most companies moving with the index, or only the biggest?
The equal-weight comparison is the easiest to follow because it uses two funds you can look up on any chart site. Plot the equal-weight fund divided by the S&P 500 fund, and a rising line means the typical company is doing better than the index; a falling line means the largest companies are doing the work. That line fell for most of 2023 to 2025 and turned up after October 7, 2026, which matched the FactSet earnings shift (source: calculated from Yahoo Finance data). Sector rotation shows how the same gap appears when money moves between sectors.
Breadth works best as a description of the market you are in, and it has a mixed record as a timing tool. Narrow markets can last for years, as 2014 to 2025 showed, and a broad rally can fade within weeks. Say you see breadth improve for a month while the S&P 500 falls, as it did from October 5 to November 10. That tells you the weakness sits in the largest companies, and it says nothing certain about where either group goes next. If you want to follow the whole index while that gap plays out, BloFin's SPYUSDT Perpetual tracks the S&P 500 fund, seven giants included.
How to trade the S&P 500 and S&P 493 stocks on BloFin
BloFin has no contract that tracks the S&P 493 or the equal-weight S&P 500 directly. The SPYUSDT Perpetual follows the S&P 500 fund, so it includes the seven at full weight. BloFin also lists perpetuals on large companies outside the seven, such as JPMorgan Chase and Eli Lilly, plus the IWMUSDT Perpetual on a small-company fund.
The SPYUSDT Perpetual offers leverage of up to 50x, and one contract is 0.01 share of the fund. The IWMUSDT Perpetual follows the iShares Russell 2000 ETF, a fund of small US companies (source: iShares, IWM). A contract on one company, such as JPMorgan, carries that company's own risks, so it behaves more like a single stock than like the 493 as a group.
Like any perpetual, this contract tracks the fund's price and never expires. Holding it gives you no shares, so the fund's dividends never reach you, and dividends make up part of the long-run return of any S&P 500 fund. Funding, a regular payment between traders who are long and short, costs or pays you at set intervals for as long as you hold. Outside regular weekday trading hours, and on weekends and market holidays, trading may be limited to reduce-only orders, which means you can cut a position down or close it, but not open or add to one (source: BloFin, stock futures trading hours).
An index contract still moves hard on a bad day, and leverage multiplies the move against the money you put up, called margin. Say you want 1,000 USDT of exposure to the S&P 500 fund through a long on the SPYUSDT Perpetual, and you put up 200 USDT in Isolated margin. Only that 200 USDT backs the trade, so your leverage is 5x. At the fund's November 10 close of $749.92 that is about 133 contracts. A day like November 5, 2026, when the fund fell 4.41%, would take about 44 USDT, or 22% of your margin, before fees and funding (source: calculated from Yahoo Finance data). Raise the leverage to 20x on the same 200 USDT of isolated margin and the same day would take 88% of it.
At 20x in Isolated margin, a move of a little under 5% against you is enough for liquidation, which closes the position before the loss can exceed your margin. In Cross mode, the default on BloFin, the rest of your futures balance also backs the position, which moves the liquidation price further away and puts more of your balance at risk. A stop-loss on BloFin closes the position at a price you choose in advance, though a fund that opens sharply lower can fill past your stop at the next available price.
How to open an S&P 500 perpetual on BloFin
Step 1: Create your BloFin account and send USDT to it. A deposit lands in your Funding Account, so move the USDT to your Futures Account with Transfer, found under Assets.
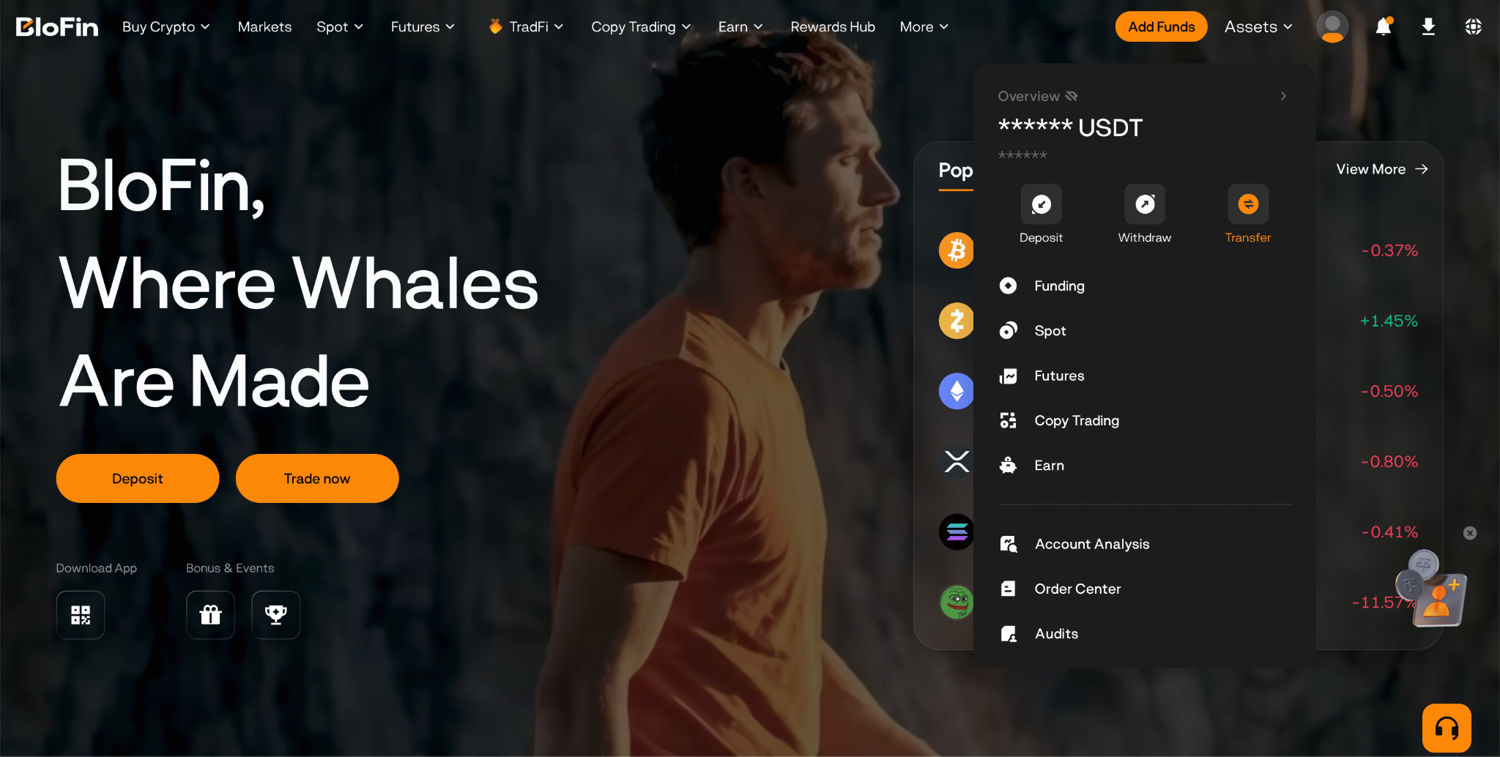
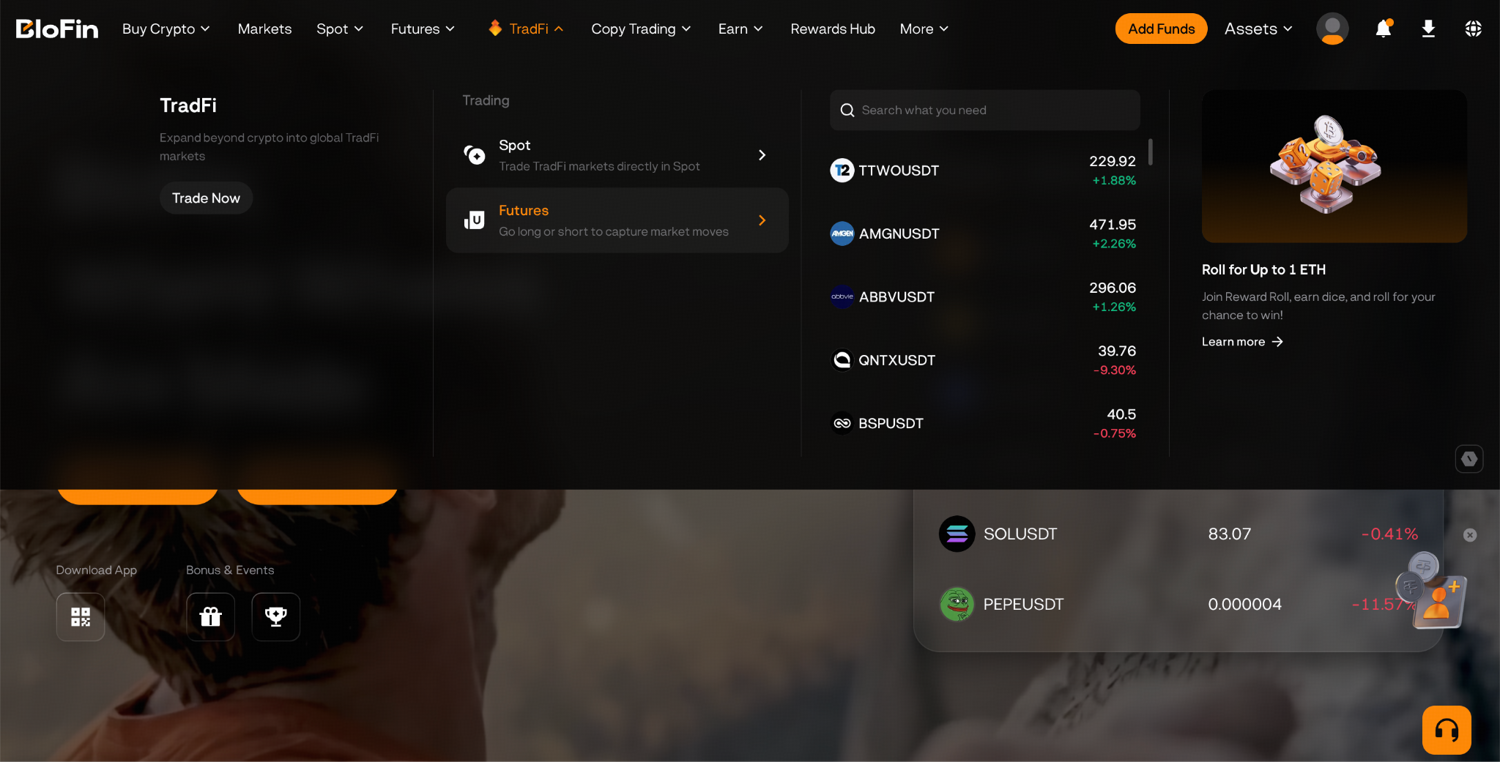
Step 2: Hover your cursor over the TradFi tab and select Futures.
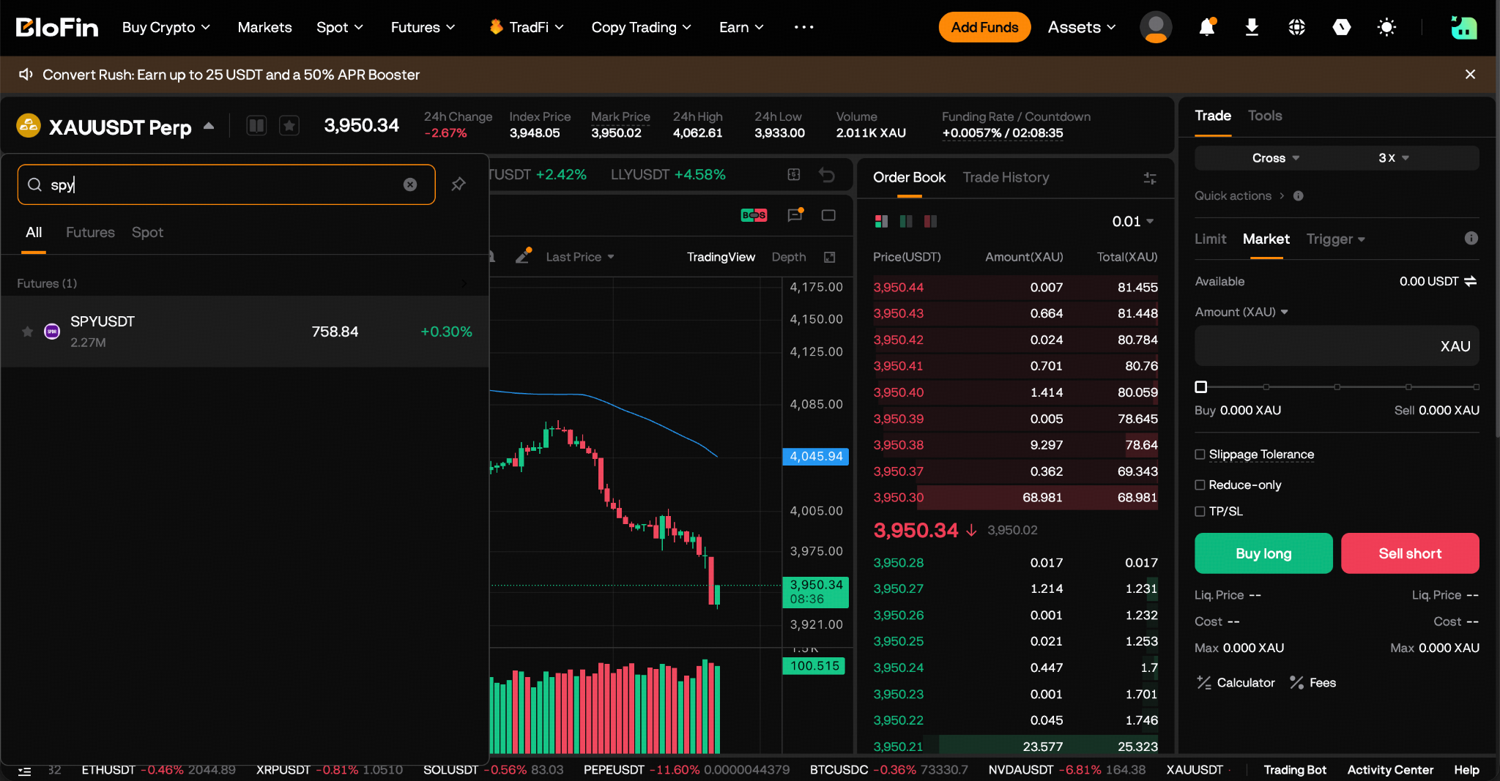
Step 3: Click on the trading pair at the top left corner and search for the contract, such as SPY, IWM or JPM.
Step 4: On the order panel, click the margin mode button, shown as Cross by default, to choose your margin mode, and click the leverage button beside it to set your leverage. Cross lets a losing position draw on the rest of your futures balance, while Isolated limits the loss to the margin you assign. Then choose Limit, which fills only at your price or better, or Market, which fills right away at the best price available, and enter your amount.
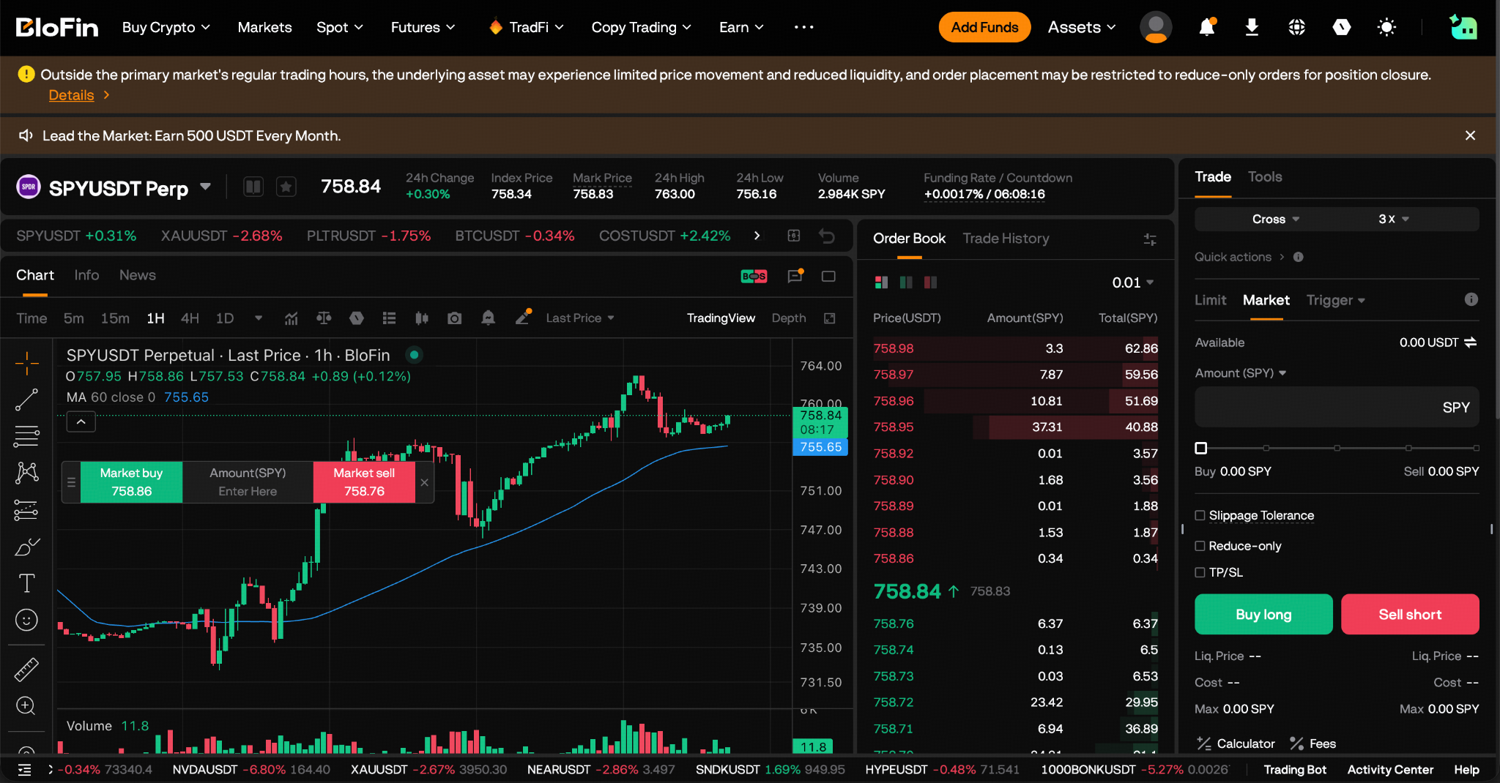
Step 5: Tick TP/SL and enter a stop-loss price. Before you click Buy to go long or Sell to go short, check Liq. Price and Cost. Your first trade on BloFin walks through the order screen in more detail. Your open trade then shows under Positions, and closing a trade on BloFin shows how to exit.
Looking to trade the S&P 500 and the companies outside the Magnificent 7? To get started, you'll need to first create a BloFin account, fund your account with cryptocurrency, and navigate to the SPYUSDT Perpetual, IWMUSDT Perpetual, JPMUSDT Perpetual or LLYUSDT Perpetual page.

Frequently asked questions
How did the equal-weight S&P 500 do in the 2022 bear market?
The equal-weight S&P 500 lost less than the ordinary index. Between January 3 and October 12, 2022, RSP dropped 20.3% including dividends, SPY dropped 24.5% and QQQ, which tracks the Nasdaq 100, dropped 34.3%. For the whole of 2022, RSP ended down 11.6% and SPY down 18.2% (source: calculated from Yahoo Finance data).
Is the S&P 493 the same as the equal-weight S&P 500?
The two are different. The S&P 493 leaves the Magnificent 7 out entirely, while the equal-weight S&P 500 keeps all 500 companies, including the seven, and gives each about the same share. In the equal-weight index Apple counts for about as much as any other member, so the seven together make up only a small slice of it.
Are S&P 493 stocks cheaper than the Magnificent 7?
By RBC Wealth Management's measure, the ordinary S&P 500 has been more expensive than its equal-weight version, in which the seven count for little. RBC found in January 2026 that the ordinary index traded at a valuation premium of nearly 30% to the equal-weight one, up from about 13% just before the pandemic (source: RBC Wealth Management). That points to the largest companies costing more than the rest, although a lower valuation can reflect slower expected growth, so it is no guarantee of better returns.
Are small-cap stocks part of the S&P 493?
The S&P 493 are large companies, and small-cap stocks are usually measured by a separate index, the Russell 2000, which holds companies smaller than those in the S&P 500. Its best-known fund, the iShares Russell 2000 ETF, held about 1,970 companies on November 10, 2026, and returned 14.69% in 2026 to that date (source: iShares, IWM).
When did the S&P 493 last grow earnings faster than the Magnificent 7?
The last time was the fourth quarter of 2022, when earnings for the Magnificent 7 fell 30.6% from a year earlier while earnings for the other 493 companies grew 1.6% (source: FactSet). The third quarter of 2026 is on track to be the next, with the final answer due once every company has reported.
Researched and written by the BloFin Academy editorial team with AI-assisted drafting. All facts independently verified. Sources include FactSet, RBC Wealth Management, State Street, Defiance, iShares, Yahoo Finance and BloFin, current as of November 11, 2026.
Nothing in this article constitutes financial advice, and nothing in it is a recommendation to buy, sell or hold any stock, ETF or crypto asset. Earnings figures for the third quarter of 2026 are partly estimates and will change as the last companies report, and an index that has led for a month can fall behind again for years, as the equal-weight S&P 500 did after 2015. A contract on the S&P 500 fund still carries the Magnificent 7 at full weight, pays no dividends, carries funding costs and may be limited to reduce-only orders outside regular market hours, and at high leverage a single bad day such as November 5, 2026 can take most of your margin. BloFin services are not available in restricted locations, including the United States. Past performance does not indicate future results. Do your own research and consider your risk tolerance before you trade on BloFin.